∗Equal contribution.
ABSTRACT
This study investigates behavioral signatures in computer-based testing and their relationship to students’ test-taking efficiency, contributing a granular behavioral taxonomy that moves beyond rigid archetypes. Using process data from the 2017 NAEP Grade 8 Mathematics assessment (N=1,642), we developed an unsupervised-to-supervised learning framework utilizing Principal Component Analysis and Gaussian Mixture Modeling to identify five core behavioral dimensions (i.e., Navigation Intensity, Problem-Solving Tool Use, UI Interface Interaction, Deliberate Pausing, and Content Interaction Over UI), followed by supervised methods including tree-based model to predict efficiency patterns. Through engineering 43 features, including a Relative Action Intensity Score to standardize interaction density across heterogeneous items, our analysis categorized students into 13 distinct behavioral clusters with efficiency rates ranging from 13% (Impulsive Rushers) to 73% (Strategic Navigators). Our XGBoost model achieved an AUC of 0.729 (Adjusted AUC = 0.458), outperforming all previous approaches from the 2019 NAEP Data Mining Competition. Importantly, we reveal that UI complexity significantly impacts efficiency, with inefficient students disproportionately interacting with interface elements rather than content. Our granular behavioral taxonomy demonstrates that while inefficiency concentrates in specific patterns (particularly impulsive rushing), efficiency emerges through multiple strategic pathways. These results provide evidence-based guidelines for computer-based tests (CBT) design, recommending reduced UI complexity to minimize extraneous cognitive load and accommodate diverse student strategies.
Keywords
1. INTRODUCTION
Recent technological advancements in the test-taking landscape have shifted traditional paper-based exams toward computer-based tests (CBT). This transition introduces new interaction demands, as students must navigate complex digital interfaces by clicking, dragging, typing, and scrolling while solving assessment items [9]. Such changes highlight the importance of understanding how students engage with CBT interfaces. For instance, for students with limited digital literacy, this can impose additional cognitive load, making it difficult to efficiently complete tests and potentially affecting performance [13]. More critically, this raises concerns about test validity—whether assessments truly measure cognitive abilities in the intended domain or inadvertently assess digital interface proficiency [10, 22, 23]. On the other hand, the transition to CBT enables collection of detailed behavioral data, including clicks, drags, navigational paths, and precise timestamps, which are the data previously unavailable in paper-based tests [14].
This presents opportunities to examine test-taking behaviors comprehensively and investigate how interaction patterns relate to efficiency. Using process data from the 2017 NAEP Grade 8 Mathematics assessment, which contains rich behavioral information from over 1,600 students, this study develops new approaches for understanding and predicting test-taking efficiency in digital environments [20]. Two key research questions guide this study: (1) What distinct behavioral patterns emerge in students’ interaction with computer-based tests? and (2) Which behavioral patterns distinguish efficient from inefficient test-taking approaches?
Our study makes several key contributions: First, we develop a five-dimensional behavioral framework to capture distinct engagement patterns, leading to the identification of 13 behavioral clusters that reveal multiple pathways to efficiency while showing inefficiency concentrates in specific problematic patterns. Second, using these behavioral dimensions as features in supervised machine learning models, we achieve improved predictive performance on test-taking efficiency that substantially outperforms previous approaches including winners of the 2019 NAEP Data Mining Competition [19, 6, 12, 25]. Finally, we provide evidence-based CBT interface design recommendations, particularly regarding UI complexity reduction to minimize extraneous cognitive load. 1
2. RELATED WORK
The shift toward computer-based testing has enabled researchers to apply educational data mining techniques to understand student behaviors and predict performance outcomes [5]. Process data analysis has emerged as a key approach for examining the sequence and timing of student actions during digital assessments [14].
In particular, the 2019 NAEP Data Mining Competition generated significant research interest in predicting test-taking efficiency, resulting in multiple methodological approaches published in a special issue of the Journal of Educational Data Mining [3]. Bosch (2021) [6] employed AutoML feature engineering using TSFRESH and Featuretools, generating over 4,000 automatically extracted features and achieving an Adjusted AUC of 0.331. However, the limited interpretability of this approach makes it difficult to derive actionable insights for practitioners. Zehner et al. (2021) [25] adopted a top-down psychometric approach, using latent speed and ability models to categorize students into four distinct test-taking types, achieving moderate performance with Adjusted AUC of 0.270. Patel et al. (2021) [19] utilized educational process analysis and fuzzy mining algorithms, focusing on temporal sequences and behavioral prototypes, and achieving Adjusted AUC of 0.326. In particular, they specifically discuss how observed “flipping behaviors" could inform interface design improvements. Levin (2021) [12] won the competition with Adjusted AUC = 0.315 by combining process mining with expert feature engineering, using approximately 330 features reduced to fewer than 30 through iterative selection to build a predictive model.
While these approaches established critical benchmarks, they often relied on binary classifications or rigid process sequences that overlook the multi-dimensional nature of student-interface interactions. Our study advances this literature by proposing a novel five-dimensional behavioral framework spanning across interaction intensity, tool use, and UI engagement, to identify 13 distinct student clusters. By accounting for both interpretability and performance, our model achieves an Adjusted AUC of 0.458, significantly outperforming the original competition winners while offering new insights into how interaction complexities impact testing efficiency.
3. METHODS
3.1 Data Explanation
For this research, we utilized the process data from the 2017 National Assessment of Educational Progress (NAEP) Grade 8 Mathematics assessment. NAEP is the largest and only representative ongoing assessment that measures U.S. students’ knowledge and learning experiences in various subjects (e.g., mathematics, reading, science, writing, civics, economics, etc.) across the nation, states, and 27 urban districts, dating back to 1969 [4]. NAEP officially transitioned from paper-based to digitally-based assessment (DBA) for mathematics and reading in 2017 [20]. This transition to DBA has allowed NAEP to collect and archive “process data.” Process data includes new types of detailed information beyond merely analyzing students’ right or wrong. It captures students’ interactions with the assessment platform and tasks, time-stamped records of student-initiated actions (e.g., clicking drawing tools) after viewing an item, logged processes students follow to arrive at answers, the steps or strategies students use for problem-solving, and the resources or tools utilized during assessments. The process data offers valuable opportunities for researchers to explore student test-taking behaviors and determine whether students use their time efficiently during tests [5].
The complete process data from the 2017 NAEP Grade 8 mathematics assessment, as well as Grade 4 mathematics, are available through restricted access by request. However, for this research, we utilized a limited dataset of Grade 8 process data provided by the Educational Testing Service for the NAEP Data Mining 2019 Competition. The competition organizers publicly provided NAEP process data for approximately 2,400 students who took the NAEP test in early 2017, and participants were asked to use this process data to build a behavioral detection model predicting whether students would spend their time efficiently on the test. While the original dataset includes survey questionnaires capturing students’ demographic characteristics, their performance, and learning opportunities both in and outside of school, and their broader educational experiences, the competition dataset contains limited information, focusing exclusively on students’ test-taking processes and their efficiency (see Appendix A for the full variable list that we were able to access). Nevertheless, acknowledging these constraints, we aimed to maximize the potential of the available data to explore and understand student behaviors in digital assessments.
For the analysis, we utilized four key variables from the complete dataset: (1) StudentID, (2) Observable, (3) EventTime, and (4) Efficiently Completed Block B. The dataset consisted of a total of 1,642 students. From the outset, the competition organizers designated 1,232 students as the training set and 410 students as the test set, and we maintained this original division in our analysis. However, there were no inherent differences in data collection methods or conditions between these two groups; all 1,642 students completed two 30-minute test sections referred to as Block A and Block B, under identical testing conditions. In terms of efficiency, the training set includes 744 efficient, 488 inefficient test-takers and the test set has 248 efficient and 162 inefficient test-takers.
Among the selected variables, the Observable variable was particularly important for our research interest, as it contained information about the specific actions taken by students during the test. Of the initial 42 actions recorded, we included only 38 actions in our analysis. Four actions related solely to procedural interactions necessary for beginning or ending the test (i.e., “Yes,” “No,” “OK,” and “Leave Section”) were excluded. The EventTime variable allowed us to examine the duration of individual student actions and the total amount of time students spent on test items.
Regarding the efficiency variable (i.e., Efficiently Completed Block B), the NAEP Mathematics test consisted of two 30-minute blocks (Block A and Block B), each with a fixed set of questions. The objective of the competition was to predict students’ efficiency in Block B using their process data from Block A. That is, all predictor features used in our analyses were derived from students’ interactions in Block A, and the efficiency outcome was derived from Block B. The outcome variable was a binary indicator (i.e., True or False) showing whether students spent their time efficiently or inefficiently in Block B. The competition organizers operationalized “efficiency” as: (1) completing all problems in Block B, and (2) allocating a reasonable amount of time to each problem [20]. To determine what constituted a “reasonable amount of time,” they conceptually defined it as the minimum possible time needed to solve each problem, and operationalized it by ranking the total time each student spent on each problem in Block B and establishing the 5th percentile as the lower-bound cutoff, applied per problem, such that a student was labeled as “inefficient” if their time on any problem fell below the 5th percentile of all students’ time on that same problem, and “efficient” only if they completed all problems and no problem fell below this threshold. Importantly, this operationalization is purely relative and time-based, without consideration of item correctness or validated psychometric standards. The competition organizers themselves acknowledged that defining this threshold is difficult and has limitations [20]. Despite this, the definition of efficiency is built into the competition dataset, and we adopt it as such throughout our study.
3.2 Feature Engineering
Following NAEP’s guidance that researchers must develop meaningful variables from process data before deriving insights [16], we conducted feature engineering as described below. As part of our preprocessing and feature engineering approach, we first applied an exploratory Principal Component Analysis (PCA) [11] for feature engineering to the 38 student actions captured by the “Observable” variable. The main purpose of this initial PCA was dimensionality reduction—to uncover underlying dimensions reflecting distinct student test-taking behaviors, which then provided a data-driven foundation for subsequent feature engineering. Building on the categories identified through our initial PCA of student actions, we engineered several quantitative features to capture students’ test-taking behavior. The resulting PCA dimensions provided an empirically driven basis for the subsequent feature-engineering phase. Specific variables derived from these PCA-based behavioral dimensions are detailed further in the Results section. We noted that this PCA represents the initial step in the project’s analytic workflow, guiding the process of feature engineering. A second, separate PCA as the method for unsupervised learning was conducted later as part of the analytic methods and is described in detail in the subsequent section.
3.2.1 PCA for Feature Engineering
The decision to retain how many principal components was guided by a visual inspection of a scree plot of eigenvalues, where we observed a notable decrease and leveling off of the explained variance after the fourth component, suggesting that additional components beyond the fourth provided diminishing explanatory value. We therefore decided to maintain four dimensions for interpretability, ensuring that meaningful and coherent dimensions representing students’ test interactions. Based on the PCA results depicted in Figure 1, we labeled each principal component and categorized the 38 actions for each dimension. We labeled the first dimension as Problem-Solving Support Actions which is associated with the actions that directly support students’ problem-solving process, such as activating scratchwork modes, drawing, and using calculators. The second dimension is labeled as Open Response Actions, and it involves tools directly used for inputting answers, including opening and closing the equation editor. The third dimension was named Navigation Actions, which includes the action to navigate between test items, such as clicking Next, Back button, or item-entry actions. The fourth dimension is named UI Interaction Actions, and it pertains to interface modifications that are indirectly related to problem-solving, such as zooming, scrolling, and managing timers.
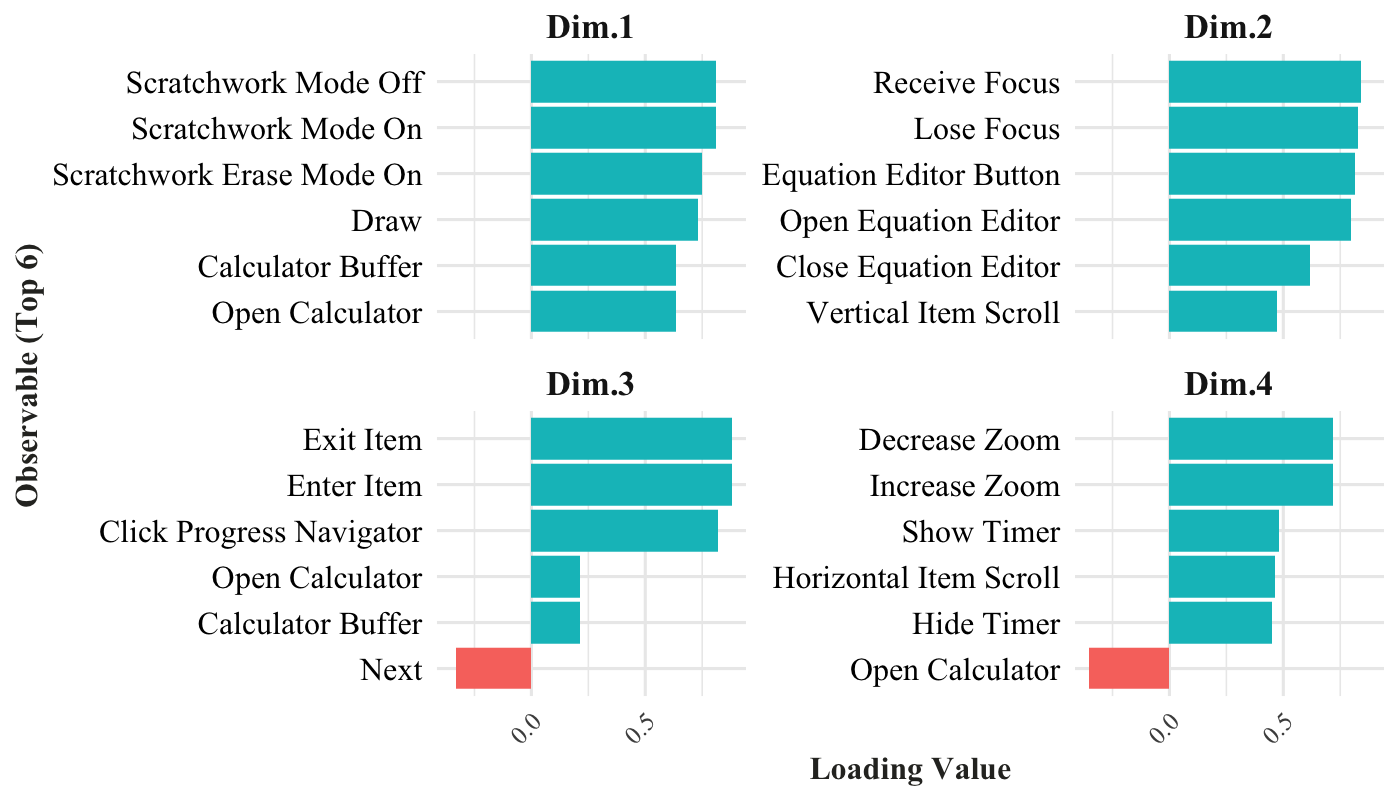
Additionally, we found seven actions (e.g., click choice, drop choice, clear answer) that did not align with any specific principal component, as these actions represented essential answering behaviors required across all item types, regardless of students’ interaction patterns. These actions were considered together with the four dimensions for feature engineering with the label of Essential Answer Actions. Detailed descriptions of 38 actions grouped under each principal component are presented in Table 1. These new categories of the actions were utilized further to create new variables with feature engineering.
| PC | Name of Category | Actions | # of Actions |
|---|---|---|---|
| Dim 1 | Problem-Solving Support Actions | Open Calculator, Close Calculator, Move Calculator, Calculator Buffer, Scratchwork Mode On, Scratchwork Mode Off, Scratchwork Draw Mode On, Scratchwork Erase Mode On, Scratchwork Highlight Mode On, Highlight, Draw, Erase, Clear Scratchwork | 13 |
| Dim 2 | Open Response Actions | Receive Focus, Lose Focus, Open Equation Editor, Close Equation Editor, Equation Editor Button | 5 |
| Dim 3 | Navigation Actions | Next, Back, Enter Item, Exit Item, Click Progress Navigator | 5 |
| Dim 4 | UI Interaction Actions | Change Theme, Hide Timer, Show Timer, Increase Zoom, Decrease Zoom, Text-to-Speech, Vertical Item Scroll, Horizontal Item Scroll | 8 |
| Extra | Essential Answer Actions | Click Choice, Math Keypress, Drop Choice, First Text Change, Last Text Change, Clear Answer, Eliminate Choice | 7 |
3.2.2 Feature Engineering
In addition to the interaction pattern categories identified through our initial PCA of student actions, we engineered several quantitative features to capture different dimensions of student test-taking behavior. As presented in Table 2, we engineered 43 features across five categories of variables: Interaction Patterns, Time Management, Answer Timing, Hiatus Time, and Navigation Patterns.
| Categories | Features | # of Features |
|---|---|---|
| Interaction Patterns | overall RAIS, problem-solving support RAIS, open response RAIS, navigation RAIS, UI interaction RAIS, essential answer RAIS | 6 |
| Time Management | average time per question, time per question variability, essential answer time, essential answer average interval, problem-solving time, problem-solving average interval, open response time, open response average interval, navigation time, navigation average interval, UI interaction time, UI interaction average interval, total time, essential answer proportion, problem-solving proportion, open response proportion, navigation proportion, UI interaction proportion, problem-solving to answer ratio, navigation to answer ratio, open response to answer ratio, UI interaction to answer ratio | 22 |
| Answer Timing | time to first answer variability, median time to first answer | 2 |
| Hiatus Time | very rapid hiatus percentage (<0.16s), rapid hiatus percentage (0.16-0.5s), normal hiatus percentage (0.5-2.6s), deliberate hiatus percentage (2.6-6.8s), extended hiatus percentage (>6.8s), median hiatus | 6 |
| Navigation Patterns | total question switches, forward switches, backward switches, forward movement percentage, unique questions attempted, average revisits per question, maximum revisits per question | 7 |
Interaction Patterns. To quantify the density of student interactions across the different action categories as defined above, we developed the Relative Action Intensity Score (RAIS) metric, which standardizes student action counts relative to the average student behavior, and enables meaningful comparisons across students and items by controlling for question-specific interaction items. Specifically, the overall RAIS was calculated by first determining the ratio of a student’s action count on each item to the average action count for that item across all students, then averaging these ratios across all items attempted by the student. Values greater than 1.0 indicating above-average interaction intensity and values less than 1.0 indicating below-average interaction intensity.
We then developed dimension-specific RAIS metrics by applying the same computation above to each of the action categories identified from the initial PCA: problem-solving support RAIS measures intensity of optional tool usage (e.g., calculator, scratchwork, drawing tools); open response RAIS measures intensity of interactions with text input and equation tools; navigation RAIS measures forward and backward movements between questions and within the test; UI interaction RAIS measures interface adjustments such as zooming, theme changes, and timer visibility; and essential answer RAIS measures intensity of actions directly required to submit answers. The rationale behind engineering these dimension-specific RAIS metrics is to provide more nuanced behavioral patterns by distinguishing between students who may have the same overall activity levels but distribute their actions differently across interaction types.
Time Management. We engineered 22 temporal features to capture time management patterns. For each student, we calculated average time per question using the difference between the earliest and latest timestamp on each question, as well as time per question variability to measure consistency in time allocation. We then quantified the time spent on each of the five action categories (i.e., problem-solving time, open response time, navigation time, UI interaction time, and essential answer time) by summing the time hiatuses between consecutive actions within each category, with an arbitrarily set upper threshold of 30 seconds to avoid overestimation from extended pauses between different question attempts. For each action category, we also calculated average interval measures (i.e., problem-solving average interval, open response average interval, navigation average interval, UI interaction average interval, and essential answer average interval) to characterize the dispersion of each action type (i.e., how “spaced out” the intervals are per action type). To be more specific, the lower values of these variables suggest more dense engagement in a category and higher values indicate more dispersed behavior, that students do not perform the certain action regularly.
For comparison across students, we derived proportions of total time spent on each category (problem-solving proportion, open response proportion, navigation proportion, UI interaction proportion, essential answer proportion) and efficiency ratios (problem-solving to answer ratio, navigation to answer ratio, open response to answer ratio, UI interaction to answer ratio) to assess how students distributed their time across different types of interactions.
Answer Timing. We captured students’ answering approaches with two features: median time to first answer (i.e., seconds between entering a question and first answer attempt) and time to first answer variability (standard deviation of how quickly a student responds upon seeing a question, measured across all questions). These metrics serve as indicators of comprehension speed, decision-making approaches, and impulsivity in responding. They were calculated separately for different question types (e.g., multiple-choice, fill-in-the-blank, and matching) to account for the varying response mechanisms.
Hiatus Time. We analyzed time gaps between consecutive actions to quantify students’ interaction rhythms (i.e., how fast they perform clicks). Based on the overall hiatus distribution across all students, we established five categories and calculated the percentage of actions in each: very rapid hiatus percentage (\(<\)0.16s), rapid hiatus percentage (0.16-0.5s), normal hiatus percentage (0.5-2.6s), deliberate hiatus percentage (2.6-6.8s), and extended hiatus percentage (\(>\)6.8s). We also calculated median hiatus as an overall indicator of click pace.
Navigation Patterns. We engineered 7 features to capture navigation behaviors: total question switches, forward switches (to later questions), backward switches (to earlier questions), forward movement percentage (proportion of forward-directed moves to capture a predilection toward linear answering strategies), unique questions attempted, average revisits per question, and maximum revisits per question (where a revisit was defined as returning to a previously seen question after having navigated away from it). These metrics collectively capture students’ sequencing strategies and tendencies toward linear progression versus non-linear back-and-forth exploration of the test content.
Upon engineering all features, we standardized most of them using z-score normalization to ensure comparability across different scales. However, we preserved the original values of RAIS features (already normalized relative to average student behavior), any proportion/percentage features (bounded between 0-1), and ratio features (inherently comparable across students) to maintain their interpretability. To prevent data leakage, test data features were standardized using means and standard deviations derived exclusively from the training dataset.
3.3 Analytic Method
The analytic approach of this study was conducted in two distinct phases: unsupervised learning and supervised learning. This methodological structure allowed for an initial exploration of behavioral patterns without predefined labels, subsequently informing predictive modeling of efficiency.
3.3.1 Unsupervised Learning
We implemented unsupervised learning techniques to systematically identify and describe students’ test-taking behaviors. Following the creation of the engineered features, we conducted a second PCA to further distill these features into coherent behavioral patterns that reflect underlying student test-taking strategies. Based on the results of this PCA, we applied Gaussian Mixture Modeling (GMM; [21]) to cluster students into groups characterized by similar test-taking behaviors as captured by the PCA. We leverage GMM for this task as it offers a probabilistic approach to clustering. Specifically, unlike deterministic methods such as k-means that assign each student to a fixed cluster membership, GMM acknowledges students’ varying combination and extent of behavioral patterns as existing along a continuum with fuzzy boundaries, offering a probabilistic interpretation [21].
3.3.2 Supervised Learning
The supervised learning phase of this research consisted of systematically applying predictive modeling techniques based on variables derived from the previous unsupervised learning stage. Using the training data (n = 1232), we trained predictive models based on the PCA-derived behavioral dimensions, feature-engineered variables, and student clusters from our unsupervised analyses. Specifically, we employed tree-based methods—Decision Tree, Random Forest [7], and XGboost—to predict students’ test-taking efficiency using all engineered features.
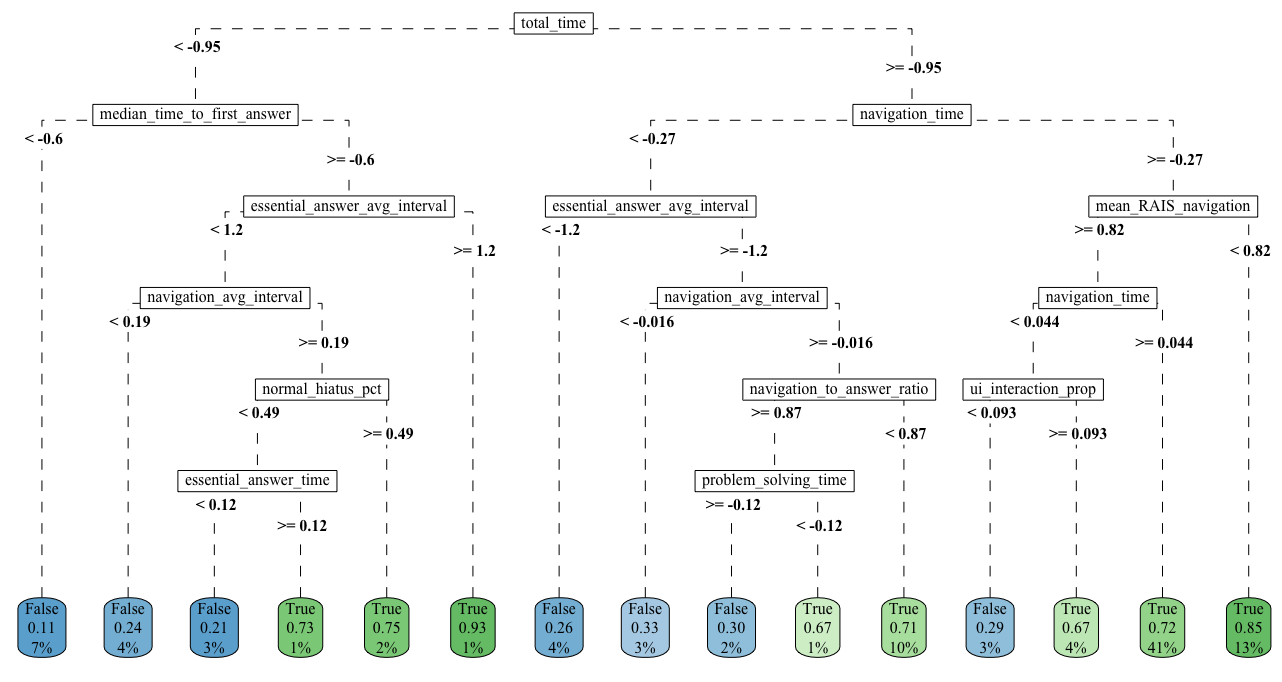
For Decision Tree modeling, we implemented 10-fold cross-validation to identify the optimal complexity parameter, exploring values from 0.0001 to 0.1. This tuning process balanced model complexity and predictive power while preventing overfitting. The final tree was visualized to examine decision pathways that distinguished efficient from inefficient test-takers. We then implemented the Random Forest model using ranger for computational efficiency, applying a similar 10-fold cross-validation but with hyperparameter optimization including mtry values of 2, 4, 6, 8, 10, and 12 (variables considered at each split), min.node.size values of 1, 2, and 3 (minimum observations in terminal nodes), and gini splitrule criterion. This approach generates an ensemble of decorrelated trees to reduce variance while maintaining predictive power. Lastly, for XGBoost, we employed a multi-parameter tuning strategy with 5-fold cross-validation, optimizing boosting rounds (50, 100), max depth (3, 6), learning rate (0.1, 0.3), and subsampling rates for both observations and features (0.7-1.0). For all three models, we evaluated and compared accuracy, sensitivity, specificity, and Area Under the Curve (AUC) on the held-out test data (n = 410), then extracted the top 15 most important features identified by the model with the highest AUC. We also report the Adjusted AUC (which is equivalent to the Gini coefficient), calculated as \(2 \times (\text {AUC} - 0.5)\), to directly compare with prior competition results [20]. Note that unlike conventional AUC, which has a chance level of 0.5, the Adjusted AUC is rescaled such that a value of 0 indicates chance-level performance and 1 indicates perfect discrimination. The supervised-learning analytic framework provided not only predictive power but also interpretative clarity regarding how distinct behavioral patterns contributed to efficient or inefficient test-taking behaviors.
4. RESULTS
4.1 Unsupervised Learning
4.1.1 PCA for Behavioral Dimensions
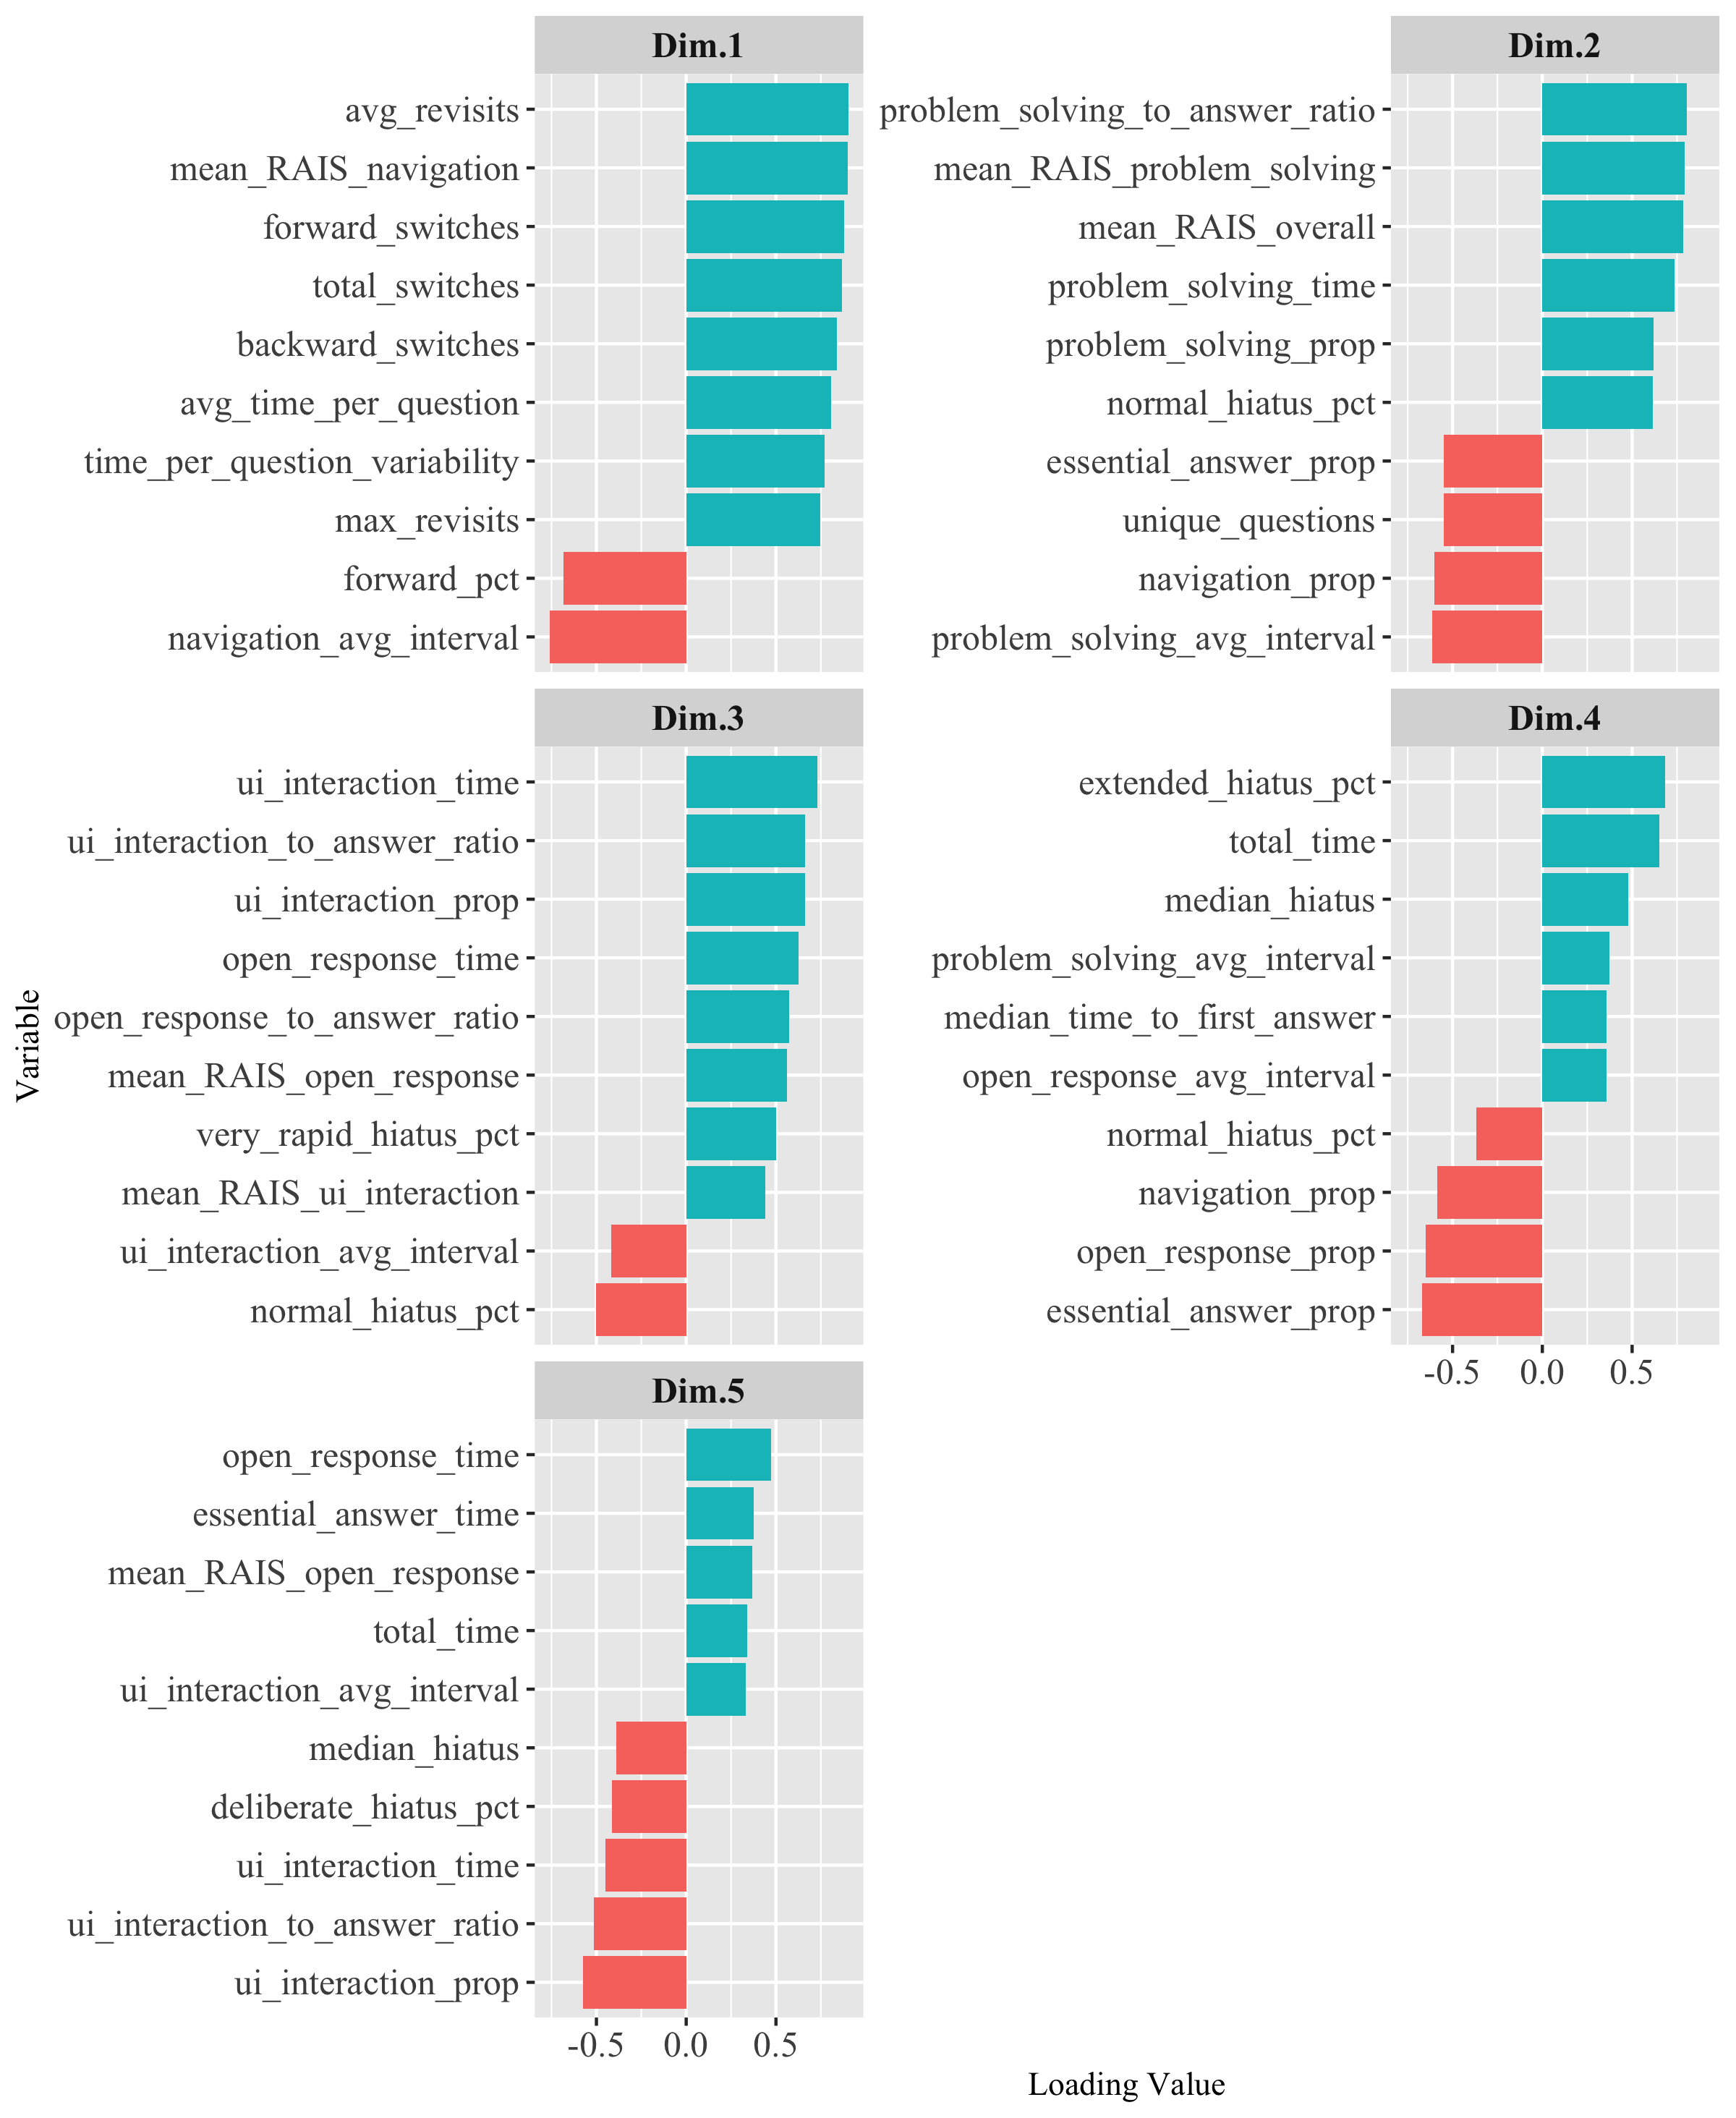
As the first unsupervised learning, we conducted the PCA with 43 feature-engineered variables. The decision to retain how many principal components was again guided by a visual inspection of a scree plot of eigenvalues, where we observed a notable decrease and leveling off of explained variance after the fifth component. Therefore, we decided to maintain five dimensions which collectively explained 62% of the variance in user interactions. Figure 2 displays the top ten contributing variables for each retained principal component. Based on the factor loadings we labeled each dimension (see Table 3).
| Principal Component | Positive Scores (+) | Negative Scores (-) | Name of Dimension |
|---|---|---|---|
| 1: Navigation Intensity vs. Efficiency | Frequent question-switching, multiple revisits, non-linear approach | Linear progression, fewer revisits, efficient navigation | Navigation Intensity |
| 2: Problem-Solving Tool Utilization vs. Direct Answering | Heavy use of calculators and tools, high problem-solving time | Focus on direct answering with minimal tool use | Problem-Solving Tool Use |
| 3: Interface Interaction vs. Content Focus | Significant time spent adjusting UI and test environment | Minimal interface adjustment, greater focus on content | UI Interface Interaction |
| 4: Deliberate Pausing vs. Continuous Engagement | Extended pauses, deliberate reflection before answers | Continuous engagement, fewer pauses, faster responses | Deliberate Pausing |
| 5: Content Interaction vs. Interface Adjustment | More time on responses and engaging with question content | More time adjusting interface relative to answering | Content Interaction over UI |
Dimension 1: Navigation Intensity. This dimension is primarily characterized by variables such as average revisits, forward switches, total switches, and backward switches, all of which are strongly and positively associated with item-switching behavior. In contrast, navigation average interval and forward percentage negatively correlated with this dimension Given this, we interpret Dimension 1 as a measure of navigation intensity. A higher score suggests that students frequently revisit and switch between different sections within short time gaps, engaging in more active and fragmented navigation. Conversely, a lower score indicates students navigate less frequently and with longer intervals between transitions, suggesting a more deliberate, linear, or less exploratory approach to problem-solving.
Dimension 2: Problem-Solving Tool Use. Dimension 2 is marked by high positive loadings on variables related to problem-solving behaviors, such as problem solving to answer ratio, problem solving time, and mean RAIS problem solving. In contrast, it exhibits negative loadings for variables associated with other types of engagement, including essential answer prop and navigation prop. This suggests that students with higher scores in this dimension primarily engage in problem-solving tool use, focusing their efforts on problem-solving rather than other behaviors such as submitting essential answers or navigating between sections.
Dimension 3: UI Interface Interaction. This dimension is predominantly associated with UI interaction-related variables, such as UI interaction time, UI interaction to answer ratio, and UI interaction prop, all of which exhibit strong positive loadings. Therefore, we interpret Dimension 3 as measuring the extent to which students engage with the user interface. A higher score in this dimension indicates students who frequently interact with the UI elements. It aligns with the negative value of the UI interaction average interval. The higher factor loading of this variable (i.e., the negative value of this dimension) indicates students less frequently interact with UI and with longer intervals between transitions, which suggests a more deliberate and less exploratory approach to UI interaction.
Dimension 4: Deliberate Pausing. Dimension 4 is characterized by positive loadings on variables related to time spent before taking action, including total time, extended hiatus percentage, and median time to first answer. Meanwhile, it exhibits negative loadings on variables reflecting active engagement, such as essential answer proportion and open response proportion. This pattern suggests that students with higher scores in this dimension engage in deliberate pausing and contemplation, as indicated by longer total time spent, more frequent and extended hiatuses, and slower initial responses. Conversely, lower scores in this dimension indicate a higher relative proportion of active engagement behaviors, such as providing open-ended responses, submitting essential answers, and frequently navigating through the interface. These students tend to engage in actions more frequently rather than deliberately pausing for extended periods.
Dimension 5: Content Interaction Over UI. This dimension is positively associated with variables related to content engagement, such as open response time and essential answer time, while it is negatively associated with UI interaction variables. Based on this pattern, we interpret Dimension 5 as a measure of content-focused interaction versus UI-focused interaction. Students with higher scores in this dimension spend more time engaging with content, such as responding to open-ended questions and providing essential answers. In contrast, students with lower scores demonstrate a greater focus on UI interactions rather than content engagement.
4.1.2 Gaussian Mixture Modeling
Following the dimension reduction through the second PCA, we employed GMM to identify distinct clusters of students based on their test-taking behaviors as captured by the principal components. To determine the optimal number of clusters, we evaluated models with 2 to 16 clusters using the Bayesian Information Criterion (BIC). As shown in Figure 3, the VVE model (i.e., variable volume, variable shape, equal orientation) achieved the highest BIC values, peaking at 13 clusters before beginning to plateau2. In the context of clustering students by behaviors, the VVE model thus suggests that students’ test-taking strategies may have varying prevalence (variable volume) and the degrees of dispersion across dimensions (variable shape); nonetheless, while they demonstrate different behavioral tendencies, the underlying relationships between these behavioral dimensions remain consistent across groups (equal orientation). Based on this analysis and considerations of interpretability, we selected the 13-cluster VVE as the optimal GMM model for capturing the diversity of behavioral patterns in our data.

The heatmap in Figure 4 visualizes the 13 identified student clusters, each with distinct behavioral patterns across the five principal components. Note that the dimension values are normalized across the student population, with a value of 0 representing the average behavior, while values further from 0 (either positive or negative) indicate more extreme deviations from the typical behavior patterns. The magnitude of a value indicates how strongly the particular behavioral pattern characterizes that cluster.
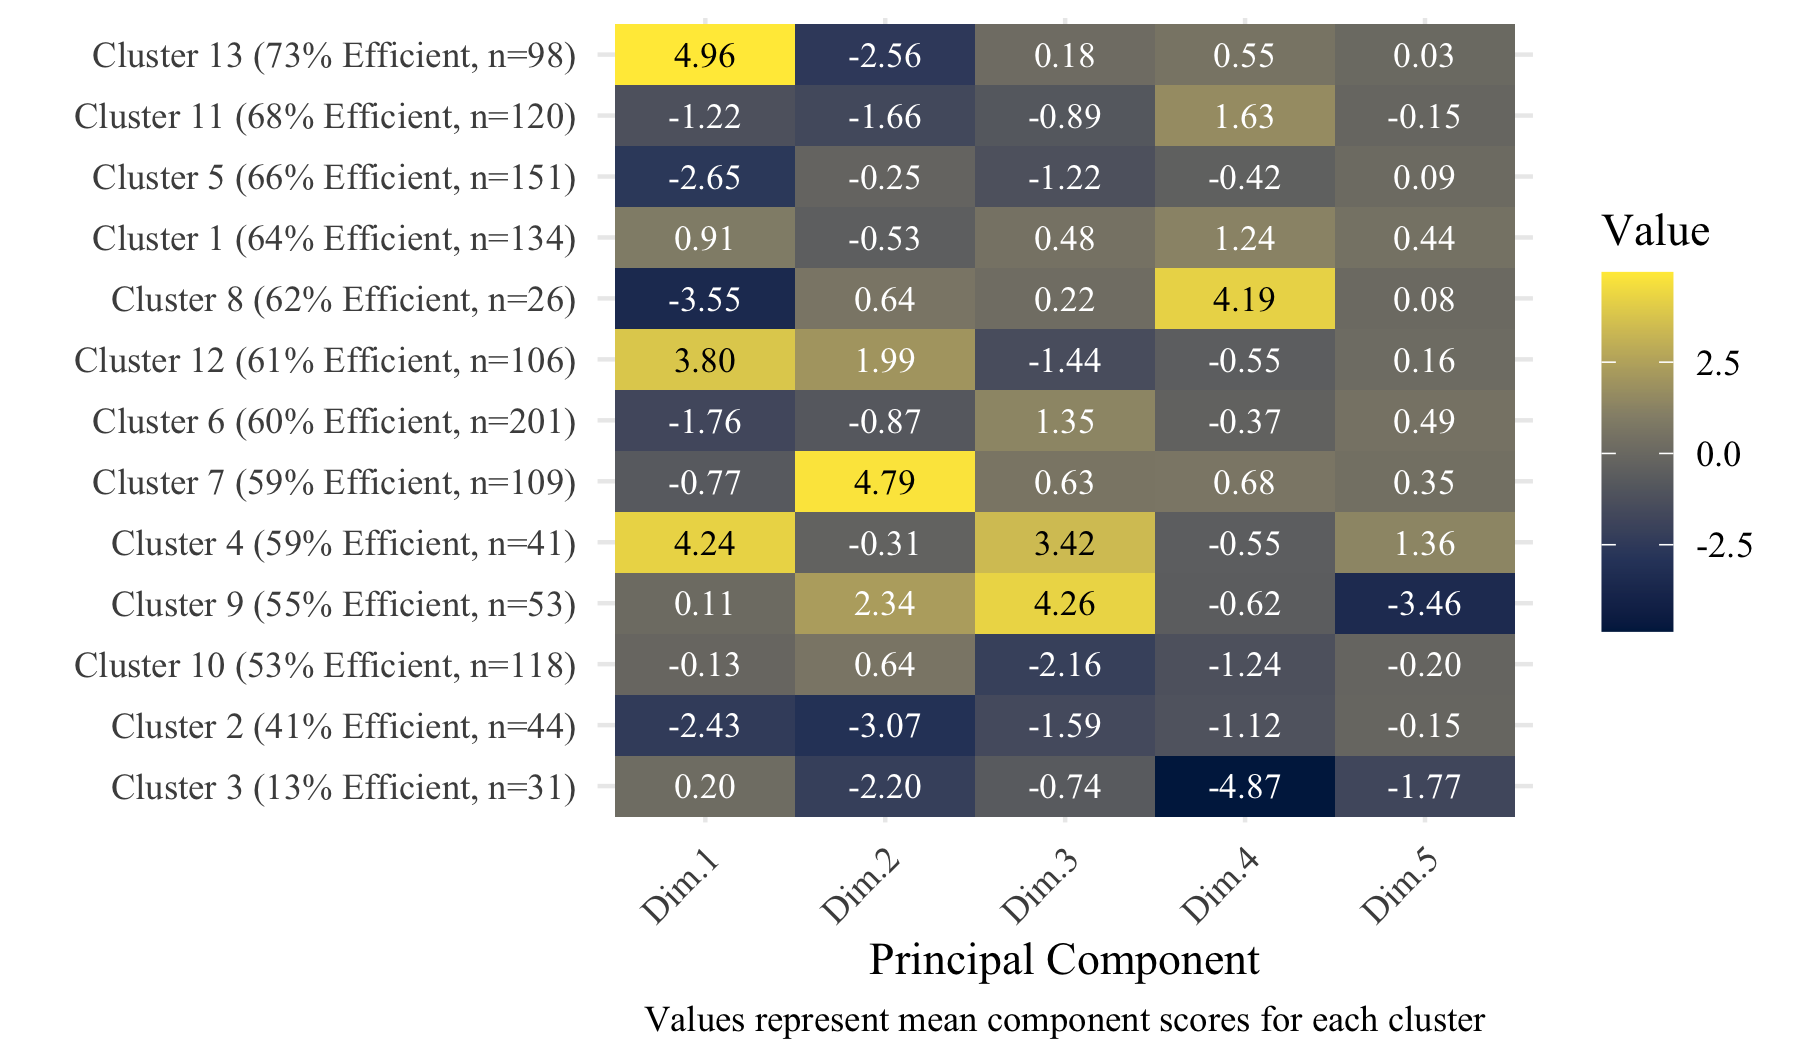
Table 4 presents the number of students per cluster and the percentage of efficient students within the cluster, along with more detailed interpretations of their key characteristics and notable behavioral dimension scores. Based on these hallmarks, we coined the names for each cluster. Note that the taxonomic naming convention of each cluster profile only captures the most distinct characteristics of the cluster for interpretability purposes, and should not be understood as defining the cluster or categorizing the students themselves. Furthermore, while cluster labels are grounded in observed behavioral patterns, they remain interpretive in nature.
| Cluster # | n | % of Efficient Students | Student Cluster Profile |
|---|---|---|---|
| 13 | 98 | 73% | Strategic Navigators: Exhibit extremely high navigation intensity (Dim.1: 4.96) with limited tool utilization (Dim.2: -2.56). They take deliberate pauses when needed (Dim.4: 0.55). Their strategic navigation between questions appears highly effective. |
| 11 | 120 | 68% | Deliberate Pausers: Characterized by taking thoughtful pauses (Dim.4: 1.63) while minimizing navigation switching (Dim.1: -1.22), tool usage (Dim.2: -1.66), and UI interaction (Dim.3: -0.89), reflecting a focused approach. |
| 5 | 151 | 66% | Interaction Minimalists: Show consistently low scores across most dimensions, particularly avoiding excessive navigation (Dim.1: -2.65) and UI interactions (Dim.3: -1.22). They take a streamlined and economical approach with continuous progression and minimal usage of supplementary tools. |
| 1 | 134 | 64% | Balanced Reflectors: Demonstrate positive but moderate scores across most dimensions with notable deliberate pausing (Dim.4: 1.24) and moderate navigation patterns (Dim.1: +0.91). |
| 8 | 26 | 62% | Reflective Pausers: Show notably reduced navigation activity (Dim.1: -3.55) but very high scores on deliberate pausing (Dim.4: 4.19). They spend more time considering their responses but generally do not switch back and forth between questions. |
| 12 | 106 | 61% | Navigation-Tool Integrators: Exhibit high navigation intensity (Dim.1: 3.80) with above-average tool usage (Dim.2: 1.99) while minimizing interface distractions (Dim.3: -1.44). They strategically leverage both navigation and problem-solving tools. |
| 6 | 201 | 60% | Interface-Oriented Moderates: Exhibit moderate UI interaction engagement (Dim.3: 1.35) while showing below-average navigation and problem-solving tool usage. Their somewhat balanced approach avoids extremes in any dimension while moderately interacting with the UI. |
| 7 | 109 | 59% | Tool Maximizers: Distinguished by very high problem-solving tool usage (Dim.2: +4.79) with moderate interface interaction (Dim.3: +0.63), reflecting that they mostly rely heavily on tools such as the scratchpad and the calculator. |
| 4 | 41 | 59% | Interface-Active Switchers: Demonstrates extremely high navigation intensity (Dim.1: +4.24) and interface interaction (Dim.3: +3.42), signifying frequent transitions between test items with extensive usage of UI interface elements. |
| 9 | 53 | 55% | Tool-Interface Dwellers: Show extremely high interface interaction (Dim.3: 4.26) combined with high tool utilization (Dim.2: 2.34) but very low content interaction (Dim.5: -3.46). They focus heavily on UI elements and problem-solving tools rather than direct content engagement. |
| 10 | 118 | 53% | Interface Avoiders: Characterized by limited usage of available assessment infrastructure with minimal UI interface engagement (Dim.3: -2.16). |
| 2 | 44 | 41% | Conservative Users: Show consistently negative scores across all dimensions, particularly low in navigation (Dim.1: -2.43) and tool utilization (Dim.2: -3.07), suggesting minimal interactions. |
| 3 | 31 | 13% | Impulsive Rushers: Exhibit extremely low deliberate pausing (Dim.4: -4.87) and tool utilization (Dim.2: -2.20). They also show substantial imbalance toward interface adjustment over content interaction (Dim.5: -1.77), spending more time manipulating UI elements than engaging with questions. Overall they show a combination of hurried progression with minimal pausing and poor content focus. |
The GMM clustering results on identified principal components reflect several implications. Firstly, there are multiple pathways to efficiency, but inefficiency concentrates in a few specific behavioral patterns. Specifically, while the percentage of efficient students vary somewhat gradually from Cluster 13 (73%) to Cluster 2 (41%), there is a dramatic drop to Cluster 3 (13%), where the overwhelming majority (87%) of students exhibit inefficient test-taking behavior. This Impulsive Rushers group (Cluster 3) demonstrates extremely low deliberative pausing (Dim 4: -4.87), minimal problem-solving tool utilization (Dim.2: -2.20), and disproportionate UI interface interaction over actual content engagement (Dim.5: -1.77). This combination of behaviors portrays the cluster as students who fiddle around with UI interface changes without engaging in the actual assessment content, rushing through questions while barely leveraging support tools like the scratchpad and calculator.
Secondly, deliberative pausing (Dim.4) emerges as an important factor for achieving efficiency. Including Strategic Navigator (73% efficient students), Deliberate Pausers (68% efficient students), Balanced Reflectors (64% efficient students), and Reflective Pausers (62% efficient students)—Clusters exhibiting above-average deliberate pausing behaviors—all achieved efficiency rates exceeding 62%. Conversely, as aforementioned, Impulsive Rushers (which has the lowest percentage of efficient students) showed the most extreme negative value on this dimension (Dim.4: -4.87). This result aligns with Wise’s [24] findings that “rapid-guessing behavior”—which test-takers spend very short time responding to multiple-choice items—indicates disengaged test-taking regardless of whether the assessment is low- or high-stake.
Thirdly, when interpreting clusters, the behavioral dimensions would be better to be considered and compared holistically rather than as isolated, deterministic factors. For example, Strategic Navigators (Cluster 13) achieved the highest efficiency (73% efficient students) through a distinctive combination of extremely high navigation intensity (Dim.1: 4.96) and minimal problem-solving tool utilization (Dim.2: -2.56), reflecting that they strategically move between questions and do not rely on computational aids such as the calculator or scratchwork features. This suggests that their efficiency may stem not only from their behavioral strategy but potentially also from stronger content knowledge or computational proficiency [1], though such interpretation requires further validation through external achievement data or cognitive measures beyond what current process data alone can provide.
4.2 Supervised Learning
4.2.1 Tree-Based Models
The three tree-based algorithms, all trained on the full set of 43 engineered features, yielded varying performance. As shown in Table 5, XGBoost outperforms both Decision Tree and Random Forest models across accuracy (0.688), sensitivity (0.859), and AUC (0.729). Random Forest achieved marginally better performance than Decision Tree in terms of accuracy (0.659 vs. 0.656) and AUC (0.698 vs. 0.682), though Decision Tree exhibited slightly higher sensitivity (0.815) than Random Forest (0.806). We note that all three of our tree-based models have outperformed the best AUC scores of the winners of the NAEP Data Mining Competition 2019 [19]. Specifically, our best model XGBoost with Adjusted AUC of 0.458 represents a 45.4% improvement over the original competition winner Levin [12] (2021) with Adjusted AUC of 0.315. While these gains are meaningful, an Adjusted AUC of 0.458 reflects only moderate predictive strength, indicating that behavioral process data alone provides useful but limited signal for predicting test-taking efficiency.
| Metric | Decision Tree | Random Forest | XGBoost |
|---|---|---|---|
| Accuracy | 0.656 | 0.659 | 0.688 |
| Sensitivity | 0.815 | 0.806 | 0.859 |
| Specificity | 0.414 | 0.432 | 0.426 |
| AUC | 0.682 | 0.698 | 0.729 |
| Adjusted AUC | 0.364 | 0.396 | 0.458 |
A notable pattern across all three models was the substantial gap between sensitivity and specificity metrics. While sensitivity values ranged from 0.806 to 0.859, specificity values were considerably lower, ranging from 0.414 to 0.432. This indicates that the models were much more successful at identifying efficient test-takers than detecting inefficient ones, which can be partly attributed to the class imbalance in the dataset.
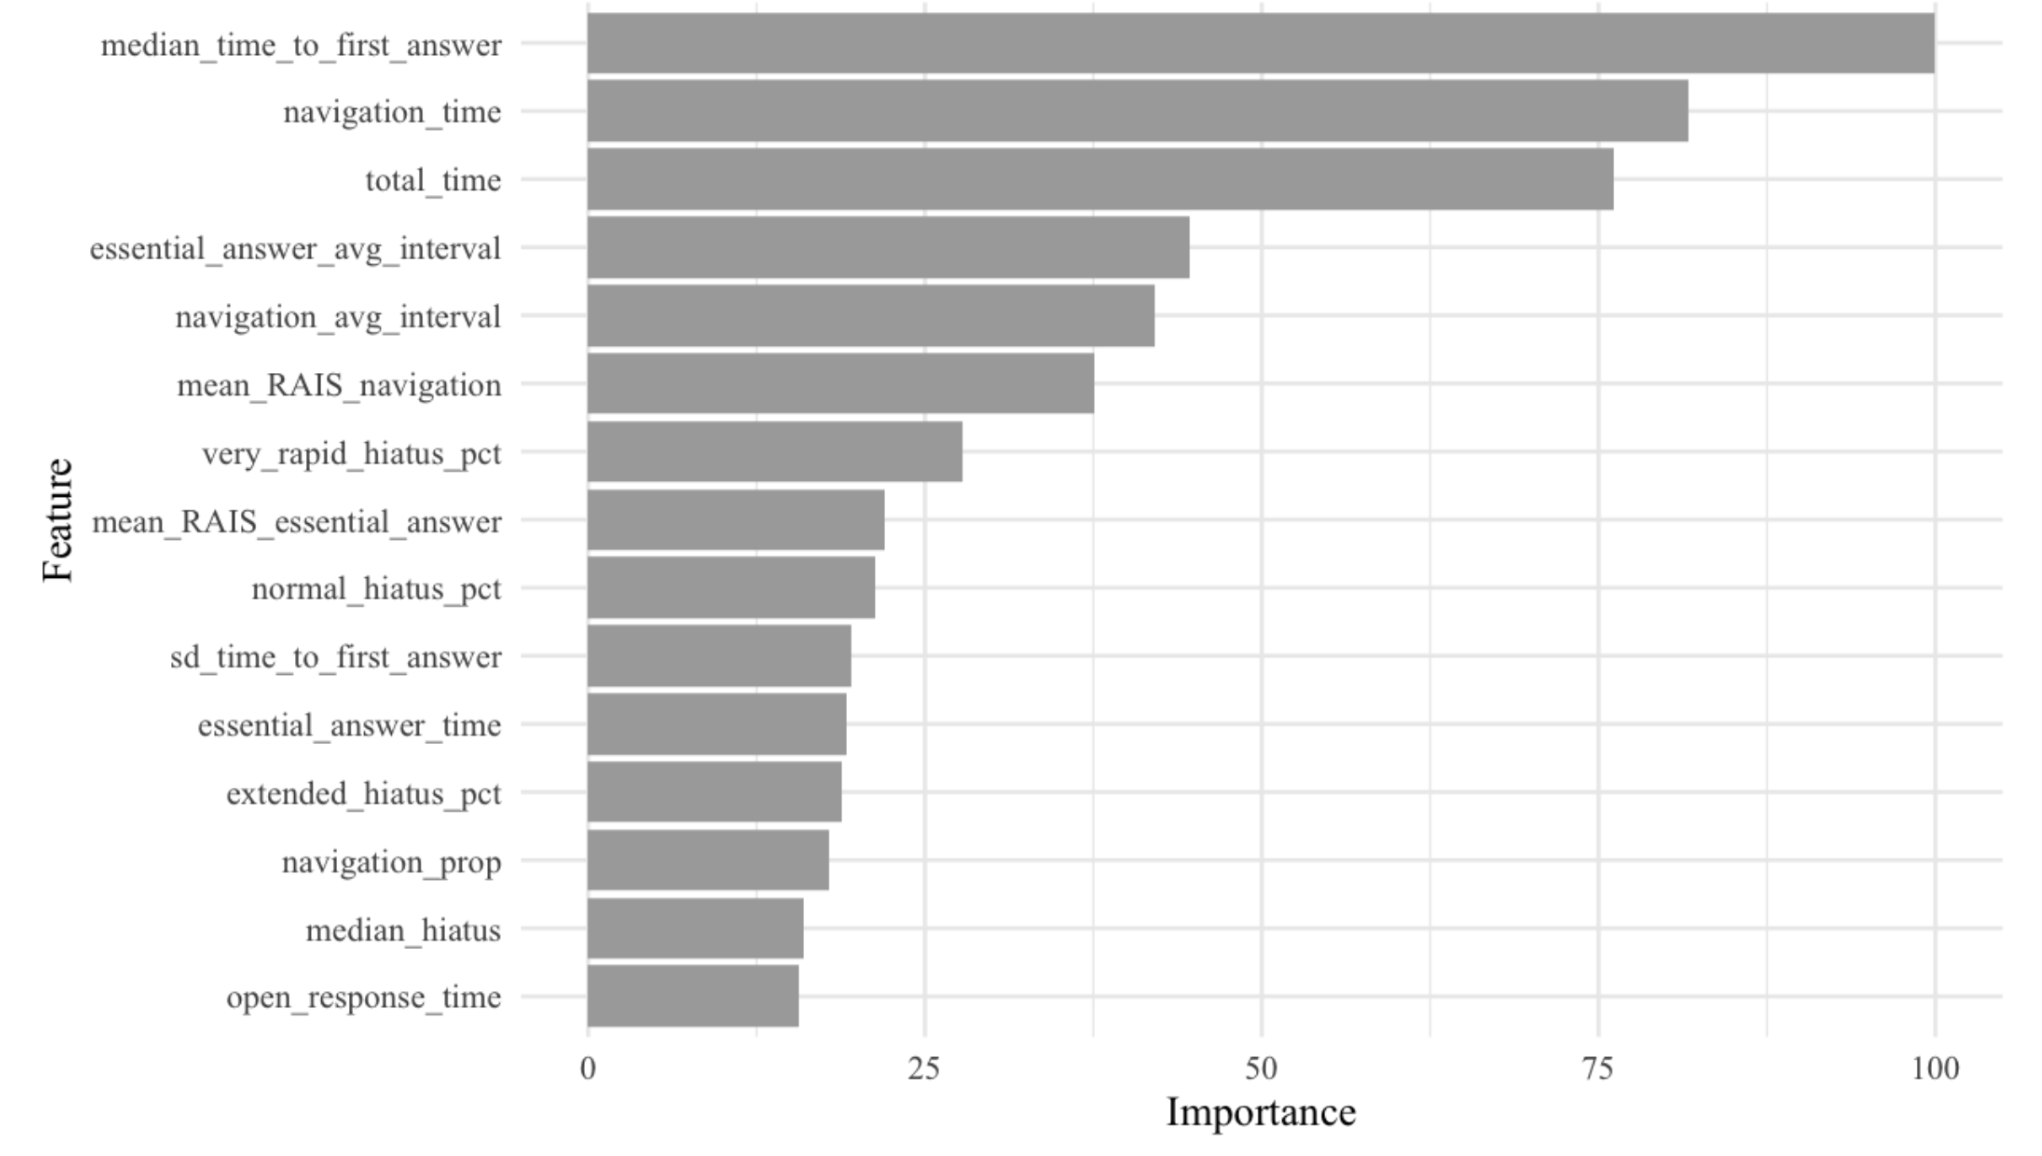
As shown in Figure 5, the feature importance analysis from the best-performing XGBoost model (with highest AUC) demonstrates that median time to first answer is the most influential feature, highlighting that the deliberative thinking process between viewing a question and beginning to answer serves as a critical efficiency marker. Other highly ranked features included navigation time (time spent moving between questions), and total time (overall test duration). Overall, we can see that among the top 15 features, most are related to navigation, hiatus, and essential answer actions, indicating how students move through the test, their rhythm and pacing of interactions, and their engagement with the actual test content contribute most significantly to predicting their efficiency. These findings align with our unsupervised learning results, particularly the identification of dimensions like “Navigation Intensity” and “Deliberate Pausing” in our PCA.
Our decision tree modeling (see Appendix B), which visualizes specific decision paths and identifies key threshold values that distinguish efficient from inefficient test-taking behaviors, complements the results from our XGBoost feature important analysis. Unlike feature importance rankings, which only indicate variables’ predictive power, this decision tree reveals specific conditional relationships between variables and their directional impact on efficiency. At the root node, total time serves as the primary splitting criterion, with both lower and higher values potentially leading to efficiency depending on subsequent behaviors. This immediately challenges the notion that faster test completion consistently yields greater efficiency.
5. DISCUSSION
In this study, we aimed to understand students’ distinctive interaction behaviors with the testing interface and their impact on test-taking efficiency. To achieve this, we applied unsupervised learning (i.e., PCA and GMM) and supervised learning (i.e., tree-based models) to NAEP 8th-grade Mathematics process data. Our findings highlight key behavioral dimensions that affect test taking efficiency and provide insights into optimizing CBT.
PCA revealed five major behavioral dimensions: Navigation Intensity, Problem-Solving Tool Use, UI Interaction, Deliberate Pausing, and Content Interaction Over UI. These dimensions captured distinct engagement patterns among students. GMM clustering further demonstrated the diversity of test-taking strategies, identifying 13 student clusters with varying efficiency levels. Notably, Navigation Intensity and Deliberate Pausing emerged as strong indicators of efficiency, aligning with previous research on test-taking strategies [19]. Our analysis found that disengagement and impulsive rushing—characterized by minimal pausing, high UI interaction, and low content engagement—significantly reduce efficiency. Conversely, high-efficiency clusters demonstrated a balance of navigation, deliberate pausing, and content-focused engagement rather than excessive reliance on UI interactions or problem-solving tools. The tree-based models further corroborated these findings, highlighting median time to first answer as the strongest predictor of efficiency. This affirms the significance of deliberative engagement; as such, supporting behaviors like structured pauses and reduced rapid navigation could improve test-taking performance.
While our supervised tree-based models suggest that features related to UI interaction and tool usage do not have important predictive powers (i.e., we may not able to label the students’ efficiency based on the UI interaction), our unsupervised learning discloses that these features distinguish clusters with higher percentages of efficient students from those without. The 60 percentage point efficiency gap between our highest and lowest performing clusters (Strategic Navigators at 73% vs. Impulsive Rushers at 13%) suggests that interface design choices can substantially impact students’ test-taking behavior and which can eventually hinder the interpretation of the test score. From this, we can interpret that reducing the extraneous cognitive load from UI complexity is still a crucial consideration for optimizing interface designs [8, 18, 17].
These findings have broader implications beyond traditional NAEP mathematics assessments. To enhance engagement and efficiency while taking the test, interfaces should minimize unnecessary UI elements that may distract students from content engagement [18], preventing “mouse skills” from masking their actual “math skills." Additionally, adaptive testing interfaces that recognize and respond to inefficient navigation patterns could offer real-time support to students struggling with disengagement or impulsive rushing. Assessment designers should also consider how structured pauses and deliberate engagement can be facilitated to help enhance students’ test-taking efficiency [2]. While our analysis is limited to the context of computer-based testing on NAEP, future validation across different computer-based tests across different subject areas would strengthen the practical applicability of our taxonomy.
5.1 Limitations and Future Work
This study has several limitations that should be considered when interpreting the findings. First, one major limitation is the lack of demographic data. As noted in the data description, the dataset does not include information on socio-economic status (SES), gender, or prior digital exposure, which may affect students’ interaction behaviors and efficiency in CBT. However, there is an opportunity to obtain these variables by contacting the NAEP through a formal request. Future research could explore these factors further if access to such data is granted. For instance, the role of SES in digital literacy and assessment performance warrants further investigation. The lack of digital literacy skills can exacerbate existing educational inequalities, disproportionately affecting students from lower socio-economic backgrounds who may have limited access to technology and digital learning resources.
Second, as another crucial limitation, the dataset does not include item-level accuracy information (i.e., information about whether students answered correctly or incorrectly on each item), and the efficiency metric itself is inherited from the competition design [20]. This raises concerns about construct validity [15]. For instance, high-performing students who solve problems quickly and correctly may be systematically labeled as inefficient, while students who spend time on problems without productive engagement may be labeled as efficient. Future research should integrate additional data sources, such as item-level accuracy and cognitive measures, to both develop efficiency measures that jointly consider time and correctness, and to further validate the behavioral cluster interpretations identified in this study.
Third, in terms of analytic method, this study solely focused on individual student behaviors, without considering item types, which may significantly impact interaction patterns. For example, actions such as “Lose Focus” or “Receive Focus” occur exclusively in “Fill in the Blank” item format, yet our analysis did not account for such item-specific behaviors. Future studies with access to a larger and more diverse set of item types should investigate how students’ behaviors vary by question format.
We hope, addressing these limitations will help advance research on computer-based testing and student interaction behaviors. Expanding datasets to include demographics, diverse item types, and performance-based efficiency metrics will allow for a more comprehensive analysis. Additionally, refining predictive models by incorporating more behavioral and cognitive factors can improve our understanding of effective computer-based test-taking strategies and inform adaptive assessment designs that better support student learning.
6. REFERENCES
- S. Araneda, D. Lee, J. Lewis, S. G. Sireci, J. A. Moon, B. Lehman, B. Arslan, and M. Keehner. Exploring relationships among test takers’ behaviors and performance using response process data. Education Sciences, 12(2):104, 2022.
- R. Bachhel and R. G. Thaman. Effective use of pause procedure to enhance student engagement and learning. Journal of Clinical and Diagnostic Research, 8(8):XM01, 2014.
- R. S. Baker, N. T. Heffernan, T. Patikorn, C. M. Forsyth, and I. R. Katz. Editorial acknowledgments and introduction to the special issue for the NAEP data mining competition. Journal of Educational Data Mining, 13(2):i–i, 2021.
- A. E. Beaton, R. L. Linn, and G. W. Bohrnstedt. Alternative approaches to setting performance standards for the national assessment of educational progress (NAEP). Technical report, American Psychological Association, 2012.
- Y. Bergner and A. A. Von Davier. Process data in NAEP: Past, present, and future. Journal of Educational and Behavioral Statistics, 44(6):706–732, 2019.
- N. Bosch. AutoML feature engineering for student modeling yields high accuracy, but limited interpretability. Journal of Educational Data Mining, 13(2):55–79, 2021.
- L. Breiman. Random forests. Machine Learning, 45(1):5–32, 2001.
- A. Darejeh, N. Marcusa, G. Mohammadi, and J. Sweller. A critical analysis of cognitive load measurement methods for evaluating the usability of different types of interfaces: guidelines and framework for Human-Computer Interaction. arXiv preprint arXiv:2402.11820, 2024.
- A. El-Hashash. Role of digital formative assessment in improving the assessment and monitoring of students’ learning and their significance during the COVID-19 pandemic. Open Journal of Educational Research, 2(1):9–12, 2022.
- T. M. Haladyna and S. M. Downing. Construct-irrelevant variance in high-stakes testing. Educational Measurement: Issues and Practice, 23(1):17–27, 2004.
- I. T. Jolliffe and J. Cadima. Principal component analysis: a review and recent developments. Philosophical Transactions of the Royal Society A, 374(2065), 2016.
- N. A. Levin. Process mining combined with expert feature engineering to predict efficient use of time on high-stakes assessments. Journal of Educational Data Mining, 13(2):1–15, 2021.
- F. Li, L. Cheng, X. Wang, L. Shen, Y. Ma, and A. Y. M. A. Islam. The causal relationship between digital literacy and students’ academic achievement: a meta-analysis. Humanities and Social Sciences Communications, 12(1):108, 2025.
- M. A. Lindner and S. Greiff. Process data in computer-based assessment: Challenges and opportunities in opening the black box. European Journal of Psychological Assessment, 39(4):241–251, 2023.
- S. Messick. Validity of psychological assessment: Validation of inferences from persons’ responses and performances as scientific inquiry into score meaning. American Psychologist, 50(9):741, 1995.
- National Center for Education Statistics. NAEP process data. National Assessment of Educational Progress, U.S. Department of Education, n.d. Accessed: May 5, 2026.
- S. Oviatt. Human-centered design meets cognitive load theory: designing interfaces that help people think. In Proceedings of the 14th ACM international conference on Multimedia, pages 871–880, 2006.
- S. Oviatt, A. Arthur, and J. Cohen. Quiet interfaces that help students think. In Proceedings of the 19th annual ACM symposium on User interface software and technology, pages 191–200, 2006.
- N. Patel, A. Sharma, T. Shah, and D. Lomas. Modeling NAEP test-taking behavior using educational process analysis. Journal of Educational Data Mining, 13(2):16–54, 2021.
- T. Patikorn and N. Heffernan. NAEP data mining competition 2019, 2019.
- L. Scrucca, M. Fop, B. T. Murphy, and A. E. Raftery. mclust 5: Clustering, classification and density estimation using Gaussian finite mixture models. The R Journal, 8(1):289, 2016.
- A. Skulmowski. Guidelines for choosing cognitive load measures in perceptually rich environments. Mind, Brain, and Education, 17(1):20–28, 2023.
- J.-F. Wang, T.-H. Wang, and C.-H. Huang. Investigating students’ answering behaviors in a computer-based mathematics algebra test: A cognitive-load perspective. Behavioral Sciences, 12(8):293, 2022.
- S. L. Wise. Rapid-guessing behavior: Its identification, interpretation, and implications. Educational Measurement: Issues and Practice, 36(4):52–61, 2017.
- F. Zehner, B. Eichmann, T. Deribo, S. Harrison, D. Bengs, N. Andersen, and C. Hahnel. Applying psychometric modeling to aid feature engineering in predictive log-data analytics: The NAEP EDM competition. Journal of Educational Data Mining, 13(2):80–107, 2021.
APPENDIX
A. DATASET VARIABLES
| Variable Name | Description | Values/Categories | Sample Size |
|---|---|---|---|
| Student ID | Unique identifier for each student | Numeric ID | N = 1232 |
| Block | Test block identifier | Block A, Block B | |
| Accession Number | A unique identification of a problem/item | Item IDs (e.g., “VH356862") | N = 24 |
| Item Type | The type of the item | MCSS (Multiple-choice single-selection question), GridMS (Grid-style multiple-selection question), MatchMS (Match multiple-selection question), ZonesMS (Multiple selection of pre-defined zones), FillInBlank (Single fill in the blank question), MultipleFillInBlank (Multiple fill in the blank question), CompositeCR (Composite constructed response question (e.g., open-ended)), BQMCSS (Background/Survey MCSS question) | N = 8 |
| Observable | Action taken by student | Enter Item, Next, Exit Item, Click Choice, Open Calculator, Move Calculator, Calculator Buffer, DropChoice, Eliminate Choice, Vertical Item Scroll, Receive Focus, Math Keypress, Lose Focus, Close Calculator, Click Progress Navigator, First Text Change, Yes, Leave Section, Scratchwork Mode On, Draw, Scratchwork Mode Off, Scratchwork Erase Mode On, Erase, Scratchwork Draw Mode On, Scratchwork Highlight Mode On, Highlight, Clear Answer, Change Theme, TextToSpeech, Open Equation Editor, Equation Editor Button, Clear Scratchwork, OK, Close Equation Editor, Back, Increase Zoom, Decrease Zoom, Hide Timer, Show Timer, Last Text Change, No, Horizontal Item Scroll | N = 42 |
| Extended Info | Additional metadata about the action | Various metadata strings. Metadata of the student action in a JSON format e.g. how much did the student scroll, what key she pressed on the calculator, what digit she typed as a response, etc. | Average 356 actions per student in the training set and 117 actions in the test set |
| Event Time | The timestamp of when the action was taken | Datetime format (e.g., “2017-02-10 14:44:54.167") | |
| Efficiency | Outcome variable indicating efficient completion of Block B* | TRUE/FALSE** |
* All predictor variables of both training and test sets of the data are from Block A interactions, while the outcome variable (i.e.,
EfficientlyCompletedBlockB) is derived from Block B performance.
** TRUE means “efficient" and FALSE means “inefficient". The efficiency is defined based on the usage of the time as 1) being able to
complete all problems in Block B, and 2) being able to allocate a reasonable amount of time to solve each problem. Detailed
information can be found here.
B. DECISION TREE
1GitHub Code: https://github.com/yo-lxmmm/math-or-mouse-skills
2Note that typically when using BIC for model selection, the lower BIC values indicate better models; however in the Mclust implementation in R, the reported BIC is calculated with the negative sign from the standard BIC formula is removed, therefore higher values indicate better models.
© 2026 Copyright is held by the author(s). This work is distributed under the Creative Commons Attribution-NonCommercial-NoDerivatives 4.0 International (CC BY-NC-ND 4.0) license.