ABSTRACT
The prevalence of online reading platforms has surged along with improvements to automatic speech recognition (ASR) systems. These platforms facilitate personalized reading instruction, but like all learning systems, work best when students find them engaging. The Educational Data Mining (EDM) community has made great efforts to detect student engagement, but these efforts have largely been confined to school and lab environments without intentionally including neurodiverse populations. In the present study, we evaluate engagement levels in children with attention deficit hyperactivity disorder (ADHD, n=55), autism (n=38), both autism and ADHD (n=38) and with no known clinical diagnoses (n=22) as they interact with a digital literacy learning system from their homes. Engagement was measured using parent report, and acoustic features were extracted from audio recordings of the students while they interacted with the Amira literacy learning system. Our results indicate that acoustic measures related to temporal features, pitch, and vocal quality are related to engagement levels across all clinical groups. We also identify key temporal features that vary across different clinical groups. These findings demonstrate the validity of using non-invasive acoustic features to measure engagement levels during reading comprehension tasks at home. However, interaction effects also highlight the importance of taking into account children’s clinical diagnosis when measuring engagement.
Keywords
1. INTRODUCTION
Digital reading platforms have emerged as a promising way to provide personalized literacy instruction to students, both at home and at school. These platforms guide the student through level-appropriate passages where they can read text out loud, receive real-time interventions, and respond to reading comprehension questions[69]. Compared to traditional instruction, Intelligent tutoring systems (ITSs) for reading can even produce larger learning gains [65, 70], even among students with learning differences that sometimes interfere with reading comprehension, such as Autism Spectrum Disorder (ASD) [39]. However, meta-reviews of literacy applications have demonstrated that they are most effective when (1) the systems are highly interactive and (2) children use them with higher intensity (at least 75 minutes per week) and duration (at least 3 months) [39, 69, 70]. This leads to a direct need to understand how engaged students are with a platform in order to provide effective instruction and keep them coming back for regular sessions.
Reading engagement is often defined as the student’s active involvement with reading [32], and it is sometimes distinguished from motivation by considering motivation as a mindset that is necessary in order to deeply engage with reading [2]. Although exact definitions of reading engagement vary, it is often described as including cognitive, affective, and behavioral dimensions [41]. Reading engagement is not only indicative of children’s enjoyment, but is also linked to improved reading abilities and reading comprehension [6, 31, 41, 63].
Despite an abundance of research on engagement measures, there is no standardized method for measuring student’s engagement with online reading platforms. Some conversational agent based literacy tools operationalize verbal engagement in terms of child response length [33] or semantic features including topic relevance and intelligibility [68]. However, these measures are proxies for the actual construct, which is likely to involve a range of cognitive, behavioral, and affective experiences [26]. Moreover, they do not account for key acoustic elements, including those that may be more indicative of a students’ affective experience with the reading activity [44].
In this study, we explore the use of acoustic features to detect reading engagement among neurodivergent students with different clinical diagnoses, including Autism and Attention Deficit Hyperactivity Disorder (ADHD). We examine the use of acoustic features as they can be easily extracted by voice-based reading software without the use of specialized equipment that may be difficult to acquire for use in either the home or classroom. We evaluate the interaction between clinical diagnosis and engagement levels by analyzing acoustic features that indicate voice quality, speaking rates, and prosody, and which have been associated with engagement in prior research [34, 44].
To our knowledge, this is one of the first studies to focus on understanding which acoustic features most effectively model engagement during digital reading instruction, and one of the first in the EDM community to consider how clinical diagnoses might affect those modeling efforts. Our results indicate that temporal acoustic features are robust indicators of engagement across groups in our study, but other acoustic features (e.g., variation of voiced segment length) are diagnosis-sensitive. With this work, we aim to contribute to a better understanding of how engagement manifests differently in diverse populations of learners while also putting forward tools to help detect these differences, provide personalized support, and ultimately improve outcomes.
| Clinical Group | Mean Age (SD) | Male | Female | Ethnicity | Activities |
|---|---|---|---|---|---|
|
ADHD |
8.527 (1.386) |
35 |
20 | Not Hispanic or Latino (48) |
305 |
| Hispanic or Latino (7) | |||||
|
ASD |
8.345 (1.632) |
14 |
15 | Not Hispanic or Latino (22) |
129 |
| Hispanic or Latino (7) | |||||
|
ASD+ADHD |
8.316 (0.904) |
22 |
16 | Not Hispanic or Latino (34) |
169 |
| Hispanic or Latino (4) | |||||
|
Not ASD or ADHD |
8.409 (1.054) |
11 |
11 | Not Hispanic or Latino (18) |
103 |
| Hispanic or Latino (4) | |||||
|
Overall |
8.417 (1.276) |
82 |
62 | Not Hispanic or Latino (122) |
709 |
| Hispanic or Latino (22) |
2. BACKGROUND AND RELATED WORK
Research on student engagement defines it across many dimensions, including behavioral, emotional, and cognitive domains [26]. Real-time models of student engagement have become a common way for researchers in the Educational Data Mining community to study engagement at scale, including both affective engagement and cognitive engagement. Such models have been trained on a variety of label types, including those produced from text-based video [76], video data [10, 36], speech [71, 44] physiological signals including skin conductance data [12, 77], posture data [56], and self-report [74, 18]; and from classroom observations [5, 50].
Much of this work has focused on affective engagement [13], although behavioral and cognitive engagement [30, 42] are also modeled. Such models have been particularly important for researchers studying affect dynamics [20, 51]. They have also been useful for making short-term and long-term predictions about student learning outcomes [27]. However, given the rich history of definitions involved with studying student engagement in the broader research community [26], the EDM community continues to explore novel ways to capture this construct.
2.1 Detecting Reading Engagement in Learning Systems at Home
One particularly difficult challenge in this space is appropriately creating high quality engagement labels for students who use learning software at home. Many sensors used to detect engagement can be highly invasive (e.g., video), while others are difficult to use in the home environment (e.g., posture sensors). Meanwhile, interaction-based detectors [50] rely on classroom observation or self-report data to provide the labels. Although these detectors can certainly be applied to students in the home environment, it is difficult to verify whether detectors trained on labels from a classroom environment would generalize to students’ home environments. Additionally, self-reports are susceptible to self-presentation effects and to differences in students’ ability to gauge their own level of participation [21, 28].
A few studies have sought to leverage measures that could be more easily collected in a home environment. For example, models based on student response times leverage item response theory to distinguish between engaged and disengaged students in online settings [7, 35]. These could be used in home environments, even if they might need to be renormed for different clinical populations. Another approach is to measure student talk time while engaging with an online tutor[17]. Some existing reading software measures verbal engagement based on the number of turns with a conversational agent or word counts [33]. Xu et al. [68] evaluated the nuances of children’s responses to comprehension conversations asked by conversational agents versus humans via five aspects of verbal engagement: lexical diversity, intelligibility, productivity, topic relevance, and accuracy [66, 64]. Similarly, Gorgun et al. leveraged linguistic features in online discussion posts to estimate engagement based on third-party manual coding [30]. Their scheme defined four attributes of cognitive engagement: interactive, constructive, active, and social.
In addition to semantic-based engagement features, some researchers have explored the use of acoustic features in the online setting. Litman et al. [44] evaluated prosodic cues of disengagement and uncertainty while students engaged with a physics tutor. Their research demonstrated that when students are disengaged, they respond significantly more slowly than engaged students. Disengaged students were also found to have lower maximum and mean pitch values than their engaged peers. Furthermore, disengaged students demonstrated more steady pitch values as well as lower levels of energy. Our study builds upon these findings, with the intention of exploring whether they apply to non-neurotypical learners.
2.2 Reading Engagement in Individuals with ASD and ADHD
As our ability to detect engagement in online settings has advanced, there have been increasing calls for better understanding for a more diverse range of learners [52], and subsequent research has shown that additional demographic information can improve models. For example, Karumbaiah et al. [38], shows that some behavioral engagement measures (i.e., help-seeking) are better understood when school-level demographics are taken into account. Likewise, other research has shown that we can improve our models of mindwandering by accounting for neurodivergence [67].
Accounting for clinical diagnoses in engagement research is particularly important since certain conditions are characterized by developmental challenges that begin to emerge during early childhood and impact multiple life domains (e.g. school, home) across the lifespan [49]. These increasingly prevalent conditions are characterized by factors that could interfere with our measurement of student engagement [14]. For example, individuals with Autism Spectrum Disorder (ASD) face persistent challenges in social communication, as well as restricted or repetitive patterns of behaviors, interests, and activities [4]. Attention-deficit/hyperactivity disorder (ADHD) is a neurodevelopmental condition diagnosed in about 1 in 11 (10.5%) of U.S. school-aged children [15] and is distinguished by persistent patterns of inattention and/or hyperactivity-impulsivity. While autism and ADHD are distinct neurodevelopmental conditions, they frequently co-occur. 50-70% of people with ASD meet diagnostic criteria for ADHD [58] and 12.5% of individuals with ADHD meet diagnostic criteria for ASD [73]. This co-occurrence (colloquially referred to as AuDHD) could result in additional nuances in learning behavior that would further complicate accurate measurement of engagement in this population.
Although ASD and ADHD often co-occur with disabilities
that directly impair reading skills (e.g. dyslexia; [11]),
various clinical features specific to ASD and ADHD can also
contribute to challenges with reading engagement and
comprehension for children with either condition. Specifically,
impairments in social communication, word recognition, and
oral language may compromise many autistic children’s reading
comprehension skills [57, 46, 40]. Furthermore, some early
autistic readers exhibit a striking discrepancy between
their reading comprehension and word recognition skills
such that their reading comprehension skills lag behind
their growing proficiency in word recognition [16]. Reading
comprehension may also pose difficulty for children with ADHD.
Working memory impairments that are characteristic of
ADHD can constrain reading comprehension and limit
children’s ability to recall central ideas from text directly after
reading it [47]. Additionally, on average, children with ASD
and/or ADHD may struggle to maintain sustained attention on
tasks they are not interested in or motivated to complete. This
suggests that children with ASD and/or ADHD may exhibit
reduced engagement when reading texts they did not choose [37]
or that is not related to their interests [22]. Thus, several
clinical characteristics associated with ASD and ADHD may
exert a powerful influence on reading engagement and
comprehension. With the rising use of digital literacy platforms
aimed at supporting children’s reading skills, there is a critical
need to accurately measure how children with ASD and/or
ADHD engage with and comprehend the texts they read on
these platforms.
3. PRESENT STUDY
3.1 Digital Literacy Platform
Amira [1] is an online, AI-powered reading platform that delivers real-time, adaptive literacy instruction. The virtual tutor,named Amira, listens to students as they read aloud, identifies reading miscues or skill gaps, and provides brief, real-time instructional supports (micro-interventions) aligned to the Science of Reading and tailored to the student’s ability level and performance history. During comprehension dialogue activities, Amira prompts students with questions designed to assess and deepen skills that are aligned to grade-level Reading Comprehension standards. For students in grades 3 and above—where the cognitive and language demands are appropriate—Amira may initiate a comprehension dialogue micro-intervention rather than using the traditional multiple-choice format. These dialogues use open-ended prompts to probe the student’s ability to demonstrate the skill, capturing explanation, reflection, or elaboration. Dialogues are modeled after authentic classroom questioning. The student responds either orally or by typing a response, and Amira uses advanced speech recognition and natural language processing (NLP) to capture and compare student responses against a detailed pre-defined rubric.
Each conversation can extend up to two turns of dialogue. The dialogue follows the structure of an opening prompt from the tutor, student response, a follow-up tutor prompt, student response, and final tutor response. A response timer is activated after the initial prompt is delivered, and students are given 10 seconds to begin their response to that turn. If no response is detected within this timeframe, the system will automatically deliver scaffolded support (a hint and a re-prompting of the same question). If any response attempt is detected, the student has 60 seconds in total to respond to the prompt on each turn. There is a visual timer present during the interaction to convey this per-turn time limit. The follow-up prompt is intended to scaffold the student towards further addressing rubric criteria that they did not adequately cover in their initial answer.
All response data—including ASR transcripts, timing, accuracy of the response based on the skills being taught, and behavioral markers such as hesitation or repetition—is logged for subsequent analysis, enabling researchers to investigate both dialogue engagement and comprehension skill performance within a dialogic reading context. For this study, we focus solely on the audio recordings and transcribed student responses from the comprehension dialogues described above.
3.2 Methods
3.2.1 Participants and Data Collection
Participants who consented to be contacted for research studies were recruited via the Center for Autism Research (CAR) at the Children’s Hospital of Philadelphia (CHOP). CHOP’s Electronic Health Records (EHR) database. 1000 emails per week were sent out to CHOP patients based on certain selection criteria, including (a) diagnosis of autism spectrum and/or attention deficit/hyperactivity spectrum disorder or not, (b) age 5-12 years, and (c) in the “learning to read” phase according to parent report. 144 children aged 5-12 years with a diagnosis of autism (N=29), ADHD (N=55), autism + ADHD (N=38), or no diagnoses of autism or ADHD (N=22) consented to participate in a 7-week at-home reading intervention pilot study. Once enrolled, participants were instructed to read four to five stories per week on Amira , or for at least 30 minutes. Caregivers completed surveys providing basic demographic information and feedback on their child’s experience with Amira. Full demographic details for participants can be seen in Table 1. This study was overseen by the Institutional Review Boards at CHOP and MDRC.
3.2.2 Acoustic Features and their Extraction
| Domain | Features |
|---|---|
| Temporal | Loudness Peaks Per Sec; Voiced segment length (s: mean, std. dev.); Unvoiced segment length (s: mean, std. dev.) |
| Energy | Harmonic-to-Noise ratio (mean, std. dev.) |
| Frequency | Fundamental Frequency (F0: mean, std. dev., 20th, 50th, 80th percentiles); F0 mean rising slope; F0 mean falling slope; jitter (mean, std. dev.) |
| Spectral | Alpha ratio, voiced (mean, std. dev.); Alpha ratio, unvoiced (mean); Hammarberg index, voiced (mean, std. dev.); Hammarberg index, unvoiced (mean, std. dev.); Spectral flux, voiced (mean, std. dev.); Spectral flux, unvoiced (mean); Spectral slope 0–500 Hz (mean, std. dev.); Spectral slope 500–1500 Hz (mean, std. dev.) |
For each of the comprehension activity turns, we extract acoustic features based on the extended Geneva Minimalistic Acoustic Parameter set (eGeMAPS) [23] using the OpenSMILE toolkit[25]. eGeMAPS is considered a high quality acoustic feature set for use in emotion recognition tasks [19], which are closely related to the engagement identification question. eGeMAPS consists of 25 low-level acoustic features comprising four key categories related to these tasks: prosody, temporal, pitch, and spectral features. Acoustic features are extracted at regular intervals (e.g, every 10 ms) from speech samples and the resulting feature time series is mapped to fixed-dimensional feature vectors by applying one or more statistical functions (e.g., mean, standard deviation, percentiles), resulting in 88 features1 for each student response turn. For frequency values, we focus solely on the fundamental frequency \(F_0\) which has been used in prior studies as a measure of distinguishing pitch values between neurodivergent and neurotypical students [53]. This results in a subset of 49 acoustic features that we use for our analysis as seen in Table 2.
Prosodic features attempt to characterize the expressive qualities of speech including voice quality, rhythm, and intonation that convey emotion and emphasis; examples include jitter, shimmer, and harmonic noise ratio measures.
Frequency features attempt to characterize how high or low the voice sounds and how it varies over time, capturing both the fundamental frequency (\(F_0\), perceived as pitch) and the resonant frequencies of the vocal tract (formants). As mentioned above, we only analyze fundamental frequency values in this work. These features were crucial in the work of Litman et al. [44] which showed that pitch was statistically significant for discriminating between engaged and disengaged students.
Temporal features attempt to characterize speech timing, including speaking rate and pause frequency. We consider the rate of speech, number of pauses based on loudness values, and variations in voiced and unvoiced segment lengths, which have been used in prior work discriminating between student engagement levels [44].
Spectral features are features that correspond to the spectral shape, such as slope, which are frequently used for affect recognition [23, 61]. These also include the first four Mel-Frequency Cepstral Coefficients (MFCCs), which have a documented association with valence and level of interest [24].
For further details regarding feature extraction (e.g., frame step,
window size, MFCC filterbank/DCT parameters, functionals
applied to each acoustic feature), consult [19] and [23].
3.2.3 Parent Reported Engagement (PRE) Labels
| Clinical Group | Not | Somewhat | Very |
|---|---|---|---|
| Engaged | Engaged | Engaged | |
| ADHD | 1 | 17 | 26 |
| ASD | 0 | 8 | 13 |
| ASD+ADHD | 1 | 12 | 8 |
| Not ASD or ADHD | 0 | 4 | 8 |
Following seven weeks of the at-home intervention, parents were given a survey to gather information about their child’s experience with the literacy learning system. This survey included a specific question about how engaged their child was while interacting with the tutor with three possible values: Not Engaged, Somewhat Engaged, and Very Engaged. This measure, which we will refer to as the parent-reported engagement (PRE) label, represents a relatively basic measure of engagement, as it does not ask parents to distinguish between the various ways in which engagement might manifest. However, it represents a valuable perspective on engagement from caregivers who are most familiar with the participants’ unique focus styles and avoids concerns about the reliability of children’s self-report data [21, 28].
PRE was provided by the parents of 139 participants, with 98 of those participants having audio recordings available for comprehension conversations. Labels were highly skewed towards the Very Engaged and Somewhat Engaged values with only 4 participants reported as Not Engaged during the sessions, only two of whom had audio recordings. As such, any patterns observed involving the Not Engaged group should be considered exploratory. The full distribution of clinical diagnosis based on engagement level can be seen in Table 3. We exclude any students who have fewer than two audio recordings present in the data. We apply the parent-reported engagement (PRE) level as a measure of overall engagement propensity to all comprehension activities with audio recording for the student. This is not intended to indicate turn-level engagement, but instead enable us to identify what acoustic features are correlated with children’s general engagement statement.
3.2.4 Data Preprocessing
We conducted a series of preprocessing steps. In order to ensure that each participant had enough acoustic data for analysis, we first selected for students who had participated in at least two comprehension activities. We then aggregated all of the comprehension conversation turns for that student and aligned them with the appropriate audio file. Acoustic features were extracted using the OpenSMILE [25] toolkit for each of the student conversational turns. We collected system-generated transcriptions of student responses, which were processed through a simple word count function to generate verbal response counts for each turn. We then align the transcribed student response data, audio files, and the demographic and engagement reports from the parent surveys2.
3.2.5 Measuring the Effect of Diagnosis x Engagement
To examine effects of clinical diagnosis and PRE levels on acoustic features while accounting for the fact that we have multiple audio recordings for each child, we employed population average models using generalized estimating equations (GEE). GEE models are well-suited for correlated data and provide robust inference without requiring explicit modeling of subject-specific random effects [43, 59, 75]. We also explored the use of mixed-effect models; however, they could not be applied across all the desired acoustic features due to limited within-child variability.
For each acoustic feature mentioned above, we fit a Gaussian GEE of the form:
where i represents children and j represents individual acoustic observations. Individual acoustic observations are represented by a vector of acoustic features from OpenSMILE that were extracted from a single turn in the comprehension dialogue. These models included clinical diagnosis, engagement, and the interaction of diagnosis and engagement as categorical predictors, with child age (mean-centered) and sex (parent-reported assigned sex at birth) as covariates. They were fit using the python statsmodels package [60] with the correlation structure set to exchangeable to account for the within-child correlation from the repeated observations [43]. Given the broad range of values for different acoustic features, we normalized the values using StandardScaler from scikit-learn [55]. We also use the statsmodels package to account for possible false-discovery rates (FDR) for diagnosis, engagement, and interaction effects with the Benjamini-Hochberg false discovery rate procedure [8] with adjusted p-values set using the methodology defined by Yekutieli and Benjamini [72].
4. RESULTS
| Feature Category | Diagnosis | Eng. | Diagnosis \(\times \) Eng. |
|---|---|---|---|
| Energy | 0 | 3 | 3 |
| Frequency | 0 | 6 | 8 |
| Spectral | 0 | 14 | 27 |
| Temporal | 0 | 2 | 5 |
| Total | 0 | 25 | 33 |
We examine the results of fitting a GEE model across the 49 acoustic features in Table 2 as well as the verbal response count of the student responses. In Table 4, we present the acoustic features that are the most impacted by engagement, diagnosis or the combination of diagnosis and engagement. The parent-reported level of engagement acts as an independent predictor of acoustic features across all the categories. There were no statistically significant diagnosis-related effects present in the dataset. The interaction effects of diagnosis and parent-reported engagement are distributed across all of the feature categories.
4.1 Verbal Response Count
| Predictor | FDR-adjusted p-value |
|---|---|
| Diagnosis | 0.0627 |
| Engagement | 0.2420 |
| Diagnosis \(\times \) Engagement | 0.2998 |
| Age | 0.1256 |
| Sex | 0.3986 |
In alignment with prior work in verbal engagement, we created a GEE model for the normalized verbal response count. This is taken as the count of words from the transcribed student response for a single turn. The results are displayed in Table 5. Our findings demonstrate that there was no statistically significant impact of engagement, diagnosis, or the interaction of the two on this metric. This suggests that this feature is not dependent on any of these categories.
4.2 Effect of Age and Sex on Results
We account for variations in age and sex in our results by adding them as intercepts to the GEE model. The results that we report for all engagement, diagnosis, and their interaction are those that did not have a statistically significant influence from these variables. Of the 49 acoustic features evaluated, only one had a statistically significant association age: the standard deviation of jitter. Mean child age had a positive coefficient of 0.101, indicating that as children get older than the mean age (in our case 8.4 years old), their variability in jitter levels increased as well. Child sex (as reported by parents in the demographic survey) did not have a statistically significant association with any of the acoustic features tested.
4.3 Engagement Effects
The GEE model shows that PRE levels have an effect on three energy-related features (i.e., shimmer, mean Harmonic-to-Noise Ratio and standard deviation of the Harmonic-to-Noise Ratio). PRE also impacts a number of frequency features (e.g., those related to the pitch based on \(F_0\) semitone values and jitter, and changes in consecutive \(F_0\) frames) and spectral shape features (e.g., Alpha Ratio, Hammarberg Index, and Spectral Slope values). In addition, PRE affects both the mean values of voiced segment length as well as loudness peaks per second - both of which are associated with speaking rates. These findings are consistent with prior work evaluating fluctuations in acoustic features related to arousal, engagement, and emotion [3, 7, 24, 44]. The majority of the contrast effects for the model appear between the Not Engaged and Very Engaged groups, however, we do see a meaningful difference between shimmer values for the Somewhat Engaged and Very Engaged groups. Students in the Somewhat Engaged groups (regardless of clinical diagnosis) exhibited higher mean values of shimmer than those in the Very Engaged group.
4.4 Diagnosis Effects
The GEE analysis of our data did not result in any statistically significant effects for diagnosis as an independent predictor.
These findings are surprising given a large body of existing
research that demonstrates noticeable differences in prosody,
pitch, and voice quality for individuals with autism spectrum
disorder vs. neurotypical peers [9, 48, 53, 54]. It is possible
that no differences were detected in this study due to high
variability in the speech characteristics of individuals with a
given diagnosis or the fact that this sample was collected in a
highly constrained (and non-social) context. There are still
context-dependent diagnostic differences within the dataset that
vary based on the child’s parent-reported engagement level.
4.5 Diagnosis x Engagement Effects
| Feature Type | Feature | ADHD:NE | ASD:NE | ASD:SE | ASD+ADHD:NE |
|---|---|---|---|---|---|
|
Spectral | alphaRatioUV sma3nz (mean) | \(-0.5758\) \((0.1514)^{*}\) | — | — | \(0.4108\) \((0.1876)^{*}\) |
| hammarbergIndexUV sma3nz (mean) | \(0.8934\) \((0.1482)^{*}\) | — | — | \(-0.6737\) \((0.1893)^{*}\) | |
| hammarbergIndexV sma3nz (std dev Norm) | \(-0.1400\) \((0.0629)^{*}\) | \(^\dagger \) | — | — | |
| mfcc1V sma3nz (std dev Norm) | \(-0.2257\) \((0.0614)^{*}\) | \(^\dagger \) | \(-0.1860\) \((0.0932)^{*}\) | — | |
| mfcc2 mean | \(0.4623\) \((0.1637)^{*}\) | — | — | \(-0.4865\) \((0.1950)^{*}\) | |
| mfcc3 mean | \(-0.8495\) \((0.1296)^{*}\) | — | — | \(0.8784\) \((0.1643)^{*}\) | |
| mfcc4 mean | \(0.7354\) \((0.1316)^{*}\) | — | \(0.8278\) \((0.3660)^{*}\) | \(-0.5800\) \((0.1899)^{*}\) | |
| spectralFlux sma3 (std dev Norm) | \(0.4964\) \((0.1335)^{*}\) | — | — | \(-0.4418\) \((0.1846)^{*}\) | |
| slopeV0_500 sma3nz (std dev Norm) | \(-0.0945\) \((0.0404)^{*}\) | — | — | — | |
| slopeV500_1500 sma3nz (std dev Norm) | \(0.0923\) \((0.0463)^{*}\) | \(^\dagger \) | — | — | |
|
Frequency | F0semitone mean Rising Slope | \(-0.2054\) \((0.0756)^{*}\) | — | — | — |
| jitter Local Mean | \(0.2886\) \((0.0955)^{*}\) | — | — | — | |
|
Temporal | Unvoiced Segment Length (mean) | \(0.5296\) \((0.0669)^{*}\) | — | — | \(-0.4114\) \((0.1307)^{*}\) |
| Unvoiced Segment Length (std dev) | \(0.3700\) \((0.1083)^{*}\) | — | — | \(-0.3406\) \((0.1305)^{*}\) | |
| Voiced Segment Length (std dev) | \(-0.4769\) \((0.0996)^{*}\) | \(^\dagger \) | — | \(0.4366\) \((0.1078)^{*}\) |
As shown in Table 4, thirty-three acoustic features exhibited significant interactions between clinical diagnosis and PRE, indicating that diagnostic differences in vocal production depended on PRE. Multiple acoustic categories showed interaction effects, including three associated with energy, eight associated with frequency, twenty-seven involved with spectral shape, and five involved with temporal values. Of these features, 18 of them demonstrated an interaction effect without the presence of a statistically significant effect from one of the other predictors. We report the full set of the interaction effects in Table 6. Notably, features related to pitch distribution, spectral variability, and voice quality showed the strongest evidence of context-dependent diagnostic effects, underscoring the importance of considering engagement state when interpreting acoustic markers of clinical diagnosis in educational interactions. The contrast effects referencing Not Engaged in the term should be interpreted as exploratory since there were only 2 students in the analyzed data with audio recordings at this engagement propensity level. Coefficients and patterns reported for the Somewhat Engaged level are representative of a more substantial number of participants and observations in the dataset.
4.5.1 Energy
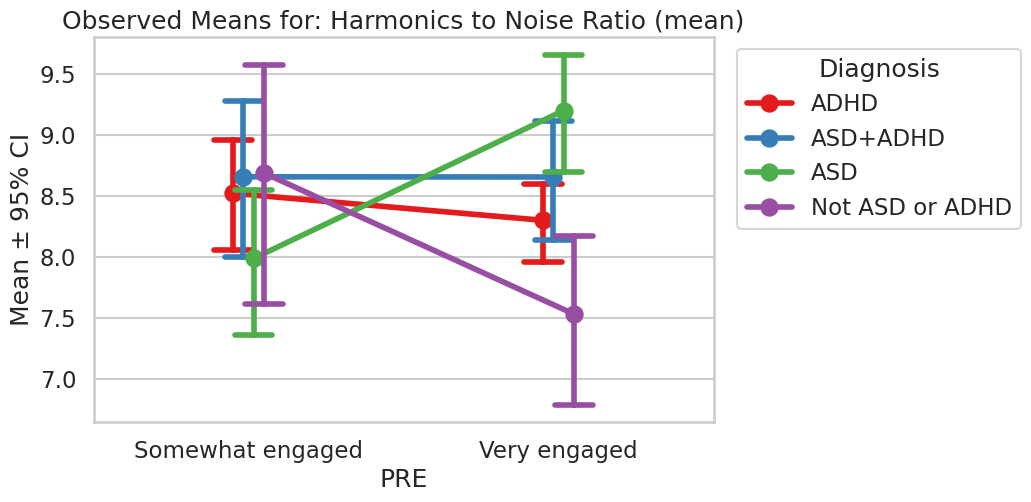
All three of the features in the energy category demonstrated interaction effects: the mean Harmonics-to-Noise (HNR) ratio and the standard deviation for the shimmer values. However, none of the individual contrast effects between groups registered as statistically significant. There are still some trends that are present in the dataset that should be mentioned for future exploration. Autistic children who were more engaged exhibited higher values of HNR whereas the neurotypical group had the opposite pattern. As seen in Figure 3, For HNR, the ADHD and ASD + ADHD groups more closely resemble the pattern exhibited by neurotypical children, with both showing lower values when Very Engaged vs. Somewhat Engaged. When children in the ADHD and ASD+ADHD groups are rated as Not Engaged, the HNR values are dramatically lower than for the mid-level of engagement, but there is high variability in these groups. This finding is harder to interpret given that there are a very limited number of samples in the dataset with the Not Engaged label. From a practical perspective, when HNR is higher it is indicative of clearer phonation [3] — which means that children with ASD are pronouncing words more clearly when more engaged whilst the other groups are actually reducing their clarity.
We also see opposing patterns between the neurotypical and ASD groups for the shimmer feature. The standard deviation for shimmer is lower for more engaged neurotypical children, whereas it is higher for more engaged ASD children. The more-engaged ADHD group shows a slight increase in shimmer values. Higher shimmer values mean that there is more intensity variability, which is frequently associated with high arousal emotions and higher levels of stress [3].
4.5.2 Frequency
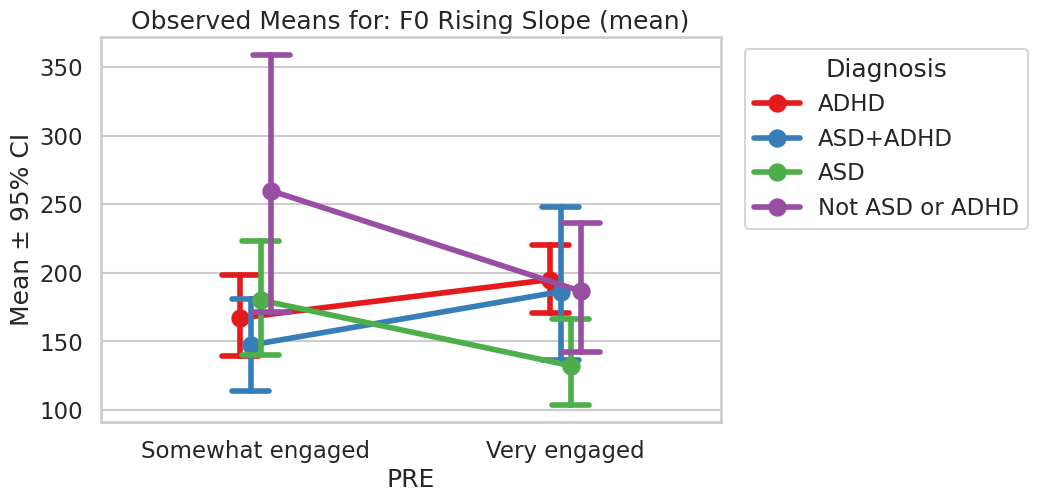
Variations in the frequency characteristics of speech are highly indicative of individual’s arousal levels and engagement [3, 23, 44]. In Figure 4, we can see the difference in mean values for the rising slope for \(F_0\) across different clinical diagnoses and engagement values. The neurotypical group exhibits a higher range of values than all of the neurodivergent groups when rated as Somewhat Engaged. These values increase between the Somewhat and Very Engaged groups for individuals with ADHD or ASD+ADHD, but they decrease for neurotypical participants. Essentially, this is indicating that when individuals with ADHD are more engaged they raise their pitch more quickly, whereas the neurotypical students will drop the rate of pitch change when more engaged.
We also notice a stark contrast between the trends of mean values for jitter between the participants with ASD when compared to all other children. Jitter values are higher for Very Engaged ASD children than the Somewhat Engaged group. The pattern is flipped for neurotypical, ADHD, and ASD+ADHD children. Jitter indicates pitch fluctuations in speech and higher values are typically associated with more tremulous or nervous speech [45]. This variation could indicate that individuals with ASD tremble more when they are highly engaged with content than their peers.
For both of these values, the only contrast effect that was statistically significant was for the Not Engaged group with ADHD when compared to the Very Engaged-Neurotypical group. However, given the extremely small sample size of the Not Engaged group, this result should be verified with a larger dataset.
4.5.3 Spectral
Interaction effects are most prevalent for the spectral or vocal shape related features. There are statistically significant effects for the unvoiced Alpha Ratio, voiced and unvoiced Hammarberg Index, MFCC values, spectral Flux and spectral slope values. As seen in Table 9, there are not any statistically significant contrast effects for any of the clinical diagnosis in the Very Engaged group. This means that across the clinical diagnosis, when children were Very Engaged, the spectral shape-related acoustic features appear in a uniform manner in the dataset. On the other hand, there are meaningful contrasts between different clinical diagnosis and the Not Engaged and Somewhat Engaged groups.
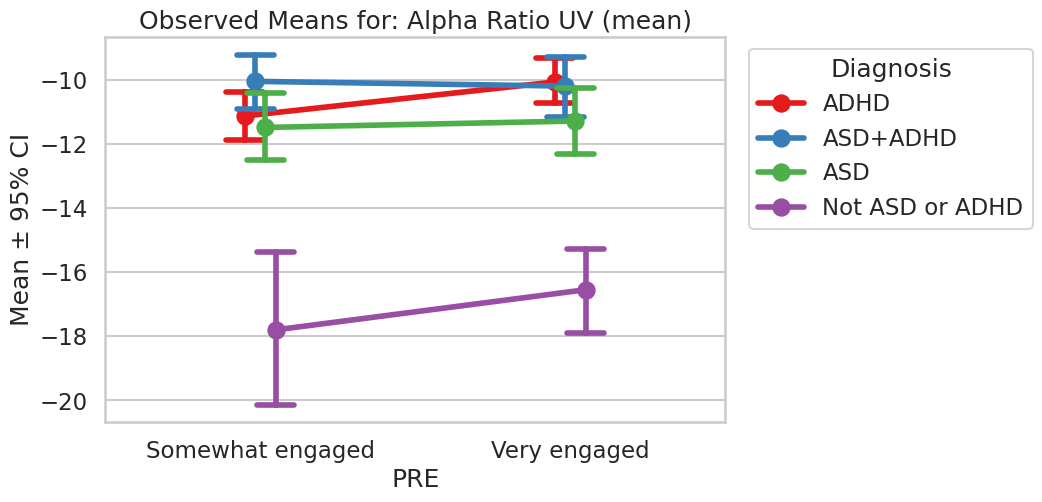
In our limited set of Not Engaged participants, we see a number of contrasting acoustic features from the Not ASD or ADHD:Very Engaged reference group. As demonstrated in Figure 4, the ASD+ADHD group had higher values for unvoiced Alpha Ratios than the reference, whereas the ASD group had substantially lower ones. A low Alpha ratio is usually associated with a softer voice. The coefficients for the unoviced Hammarberg Index mirror these results; high Hammarberg indices are associated with a softer voice, whereas lower values would be indicative of a sharper one [62]. This could be indicative of a trend where individuals with ADHD speak in a much softer tone when disengaged, as opposed to disengaged individuals with ASD+ADHD who are talking in sharper tones. Generally speaking, the mean values for the Alpha Ratio of the Not ASD or ADHD groups are considerably lower than they are for all other groups in the study.
We do see significant contrast effects in the Somewhat Engaged groups for some of the MFCC values. This includes lower values for MFCC1V for ADHD children and higher values for MFCC4 for Autistic Students. MFCC1V values are usually associated with variations in spectral tilt, with higher values indicating larger amounts of variation. Instead, for the ADHD children this is saying that there is a limited amount of variation in the spectral tilt when they are Somewhat Engaged.
4.5.4 Temporal
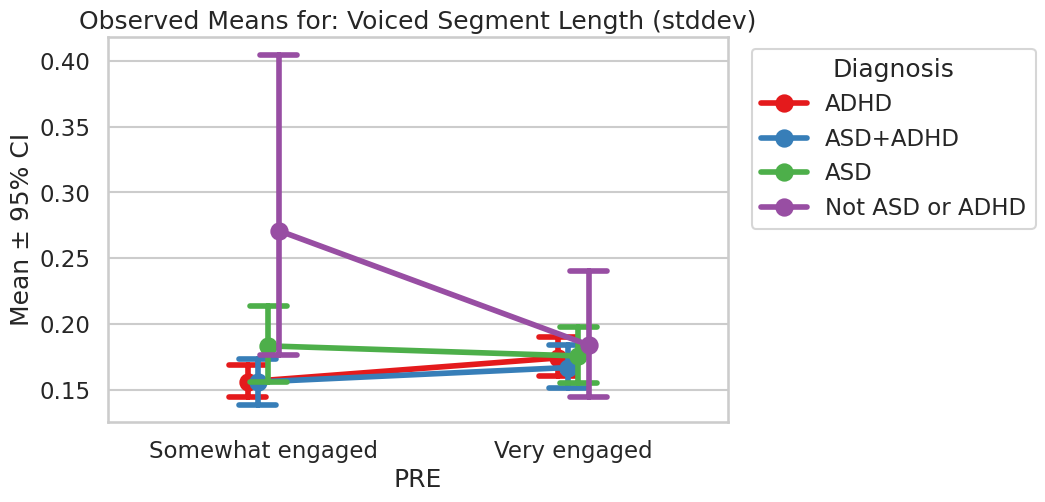
All of the temporal features had a statistically significant interaction effect, but only three of them had one without the presence of an Engagement effect. This includes the standard deviation of the voiced segment length as well as the mean and standard deviations of the unvoiced segment length. Lower standard deviations of voiced segment length mean that the speaker is talking with a more regular cadence, usually associated with a confident manner of speaking, whereas higher values can be indicative of hesitant speech [29]. In figure 1, we can see that the neurotypical group shows a much larger decrease in this value between the Very Engaged and Somewhat Engaged participants when compared to the neurodivergent groups. This suggests that neurotypical children will sound more confident when they have higher engagement levels, but this perceived confidence shift may not be reflected in the speech of their neurodivergent peers.
5. DISCUSSION
5.1 Implications for Automatic Detection of Reading Engagement
In highlighting the effects of parent-reported engagement, diagnosis, and their interaction on acoustic features, our ultimate goal is to better inform future models of reading engagement for diverse learner groups. Our results highlight the fact that acoustic features may be a more equitable signal than verbal response count for measuring reading engagement in the home setting. We recommend the use of acoustic features that demonstrate robust effects related to engagement propensity while taking into account interactions between clinical diagnosis and engagement levels. This includes Hammarberg index values, Alpha ratios, shimmer, as well as loudness peaks per second and mean values of voiced segment length. However, all of these values were associated with a statistically significant interaction effect between the diagnosis and PRE. Special consideration should be given when using acoustic features to predict engagement levels for children with ASD. In our data, we notice high variability for a number of acoustic features within this group. This may make it especially difficult to accurately predict engagement levels since there may not be a consistent observable speech pattern.
These findings are intended to be used to create adaptive at-home literacy learning systems. The differences presented in acoustic measures for individuals with ASD or ADHD are not indicative of a reading comprehension deficit. Nor should they be used as a diagnostic tool. Instead, these should be interpreted as evidence that we need to develop more complex acoustic-feature based predictive models that can account for variations in the presentation of speech-related engagement signals. With effective real-time engagement predictions, it is possible to implement interventions that keep students engaged with reading materials at home, and in turns lead to more opportunities for improving their reading comprehension skills.
5.2 Limitations and Future Directions
The detectors presented here are comparable in performance to a range of others in previous research, but would still benefit from further refinement, particularly from efforts that could expand our data collection efforts. It is important to note that this a sensitivity study on the collected audio data, and we are not evaluating the impact of a particular reading intervention on features related to reading engagement. This is a logical next step in future research studies - leveraging these features as a non-invasive measure of the effect of particular reading interventions on student reading engagement in different subgroups.
Like many studies, this analysis would have benefited from the use of a larger data set. This is particularly challenging because the majority of available speech datasets that might serve as points of comparison–especially those used to identify acoustic features related to engagement–are composed of adult speech samples from extemporaneous speech. In addition to raw frequency differences between adult and child acoustic data, children often exhibit different speech behaviors in extemporaneous speech, and our samples were further constrained by the activities students were asked to perform as part of a task related to learning to reading.
In addition to benefiting generally from a larger sample, we would also benefit from diversifying our sample. Importantly, our current dataset is representative of children with several possible clinical conditions, which allowed us to present findings related to neurodiversity that have been understudied in the EDM community. However, it would still benefit from a more robust sampling of ethnic, socioeconomic, and English language learner status as variation within those diagnoses, as those factors are known to affect students’ language patterns.
Future work should also look for ways to improve the granularity of the engagement labels, as the PRE labels were derived from parental evaluations of students’ experience with the learning system in its entirety. However, even the most engaged child will not be completely engaged during every lesson, or every turn of that lesson. Ideally, in future experiments we will complement this measure with finer-grained labels, allowing us to develop a more nuanced understanding how students who are highly engaged overall might vary over the course of several weeks while also developing a more nuanced understanding of the acoustic indicators of this engagement. Additionally, we acknowledge that our dataset contained a very small number of students in the not engaged group. Ideally, in a larger sample we would have a less imbalanced set of engagement levels. Such efforts would also substantially improve our predictive modeling of real-time engagement.
Finally, we aim to expand our approach to comprehension conversation data. During a single comprehension activity, the microphone is open for a fixed period of time where the student responds to - at most - two conversational turns. This substantially limits the amount of data that can be collected, as students may be cut off before they are able to fully participate with the task. There may be strategic reasons for the learning system to continue such practices, but it would be good to consider ways in which we might better understand how this constraint affects student engagement, particularly as we seek to use more fine-grained levels than those employed in this study.
Still, the course-grained PRE labels deployed here–in addition to serving as an important step towards better understanding home usage–might also help us to better understand when apparent disengagement at the micro-level may be incidental. For example, they likely indicate a students’ overall propensity to re-engage with the learning system, which could be used to help filter more fine-grained, moment-to-moment patterns in order to better understand which students need greater support.
6. CONCLUSION
In this paper, we have explored the use of acoustic features to measure reading engagement during online learning sessions across a diverse learner population. Acoustic features provide a non-invasive manner of capturing critical data related to student behavior and affect while they are working with a digital literacy platform at home. We present the nuances of modeling reading engagement for children with ADHD, ASD, or both based on the unique characteristics of these conditions. Our study includes audio and transcription data collected from 144 children over the course of several weeks who engaged in passage reading and reading comprehension tasks while at home.
Specifically, we use parental reports of engagement (PRE) with the system and clinical diagnosis to create generalized estimating equations (GEEs) for engagement-related acoustic features. We compare the effect of clinical diagnosis, parent report of engagement, child age and sex on a set of 49 acoustic features across 98 students from our dataset. We confirmed the results of prior work demonstrating that certain acoustic features related to frequency, temporal, spectral, and energy characteristics of speech are consistently influenced by engagement levels [44]. However, we discovered that all of the features are also impacted by the interaction between clinical diagnosis and engagement level. This suggests a critical need to develop more robust measures for measuring reading engagement that can account for the unique characteristics associated with different neurodevelopmental conditions. In future work, we hope to collect more refined turn-level engagement annotations that can be used to develop acoustic feature-driven models of reading engagement based on these findings. Furthermore, by integrating these measures of reading engagement into digital literacy systems we can create personalized adaptive learning interventions to increase individual students’ reading comprehension gains.
7. ACKNOWLEDGMENTS
The research reported here was supported by the Institute of Education Sciences, U.S. Department of Education, through Grant R305C240040. The opinions expressed are those of the authors and do not represent views of the Institute or the U.S. Department of Education. This work was made possible by our collaborators at Digital Promise, the Amira Learning team, the Children’s Hospital of Philadelphia, and MDRC. The authors would also like to express our gratitude to the families who participated in our study and contributed to this line of research.
APPENDIX
A. PER-FEATURE GEE RESULTS
Table 7 includes all acoustic features organized by high level
category as well as the results of fitting the GEE model for that
feature.
| Feature | Diagnosis | Engagement | Diagnosis \(\times \) Engagement |
|---|---|---|---|
| Temporal features
| |||
| loudnessPeaksPerSec | 0.3927 | 0.0000\(^{*}\) | 0.0000\(^{*}\) |
| Voiced segment length (mean) | 0.9649 | 0.0094\(^{*}\) | 0.0000\(^{*}\) |
| Voiced segment length (std. dev.) | 0.9758 | 0.4877 | 0.0000\(^{*}\) |
| Unvoiced segment length (mean) | 0.3782 | 0.3930 | 0.0000\(^{*}\) |
| Unvoiced segment length (std. dev.) | 0.2547 | 0.8751 | 0.0001\(^{*}\) |
| Energy features
| |||
| Harmonic-to-noise ratio (mean) | 0.4363 | 0.0000\(^{*}\) | 0.0000\(^{*}\) |
| Harmonic-to-noise ratio (std. dev.) | 0.3927 | 0.0276\(^{*}\) | 0.0142\(^{*}\) |
| Shimmer (std. dev.) | 0.2547 | 0.0000\(^{*}\) | 0.0000\(^{*}\) |
| Frequency features
| |||
| F0 mean | 0.2547 | 0.0000\(^{*}\) | 0.0000\(^{*}\) |
| F0 standard deviation | 0.2547 | 0.0367\(^{*}\) | 0.0000\(^{*}\) |
| F0 20th percentile | 0.2547 | 0.0000\(^{*}\) | 0.0000\(^{*}\) |
| F0 50th percentile | 0.2547 | 0.0000\(^{*}\) | 0.0000\(^{*}\) |
| F0 80th percentile | 0.2547 | 0.0000\(^{*}\) | 0.0000\(^{*}\) |
| F0 mean rising slope | 0.2547 | 0.0000\(^{*}\) | 0.0000\(^{*}\) |
| F0 mean falling slope | 0.2547 | 0.0000\(^{*}\) | 0.0000\(^{*}\) |
| Jitter (mean) | 0.2547 | 0.0038\(^{*}\) | 0.0000\(^{*}\) |
| Jitter (std. dev.) | 0.2547 | 0.1076 | 0.0000\(^{*}\) |
| Spectral features
| |||
| Alpha ratio, voiced (mean) | 0.2547 | 0.0000\(^{*}\) | 0.0000\(^{*}\) |
| Alpha ratio, voiced (std. dev.) | 0.2547 | 0.0000\(^{*}\) | 0.0000\(^{*}\) |
| Alpha ratio, unvoiced (mean) | 0.2547 | 0.4877 | 0.0000\(^{*}\) |
| Hammarberg index, voiced (mean) | 0.2547 | 0.0000\(^{*}\) | 0.0000\(^{*}\) |
| Hammarberg index, voiced (std. dev.) | 0.2547 | 0.0000\(^{*}\) | 0.0000\(^{*}\) |
| Hammarberg index, unvoiced (mean) | 0.0053\(^{*}\) | 0.0000\(^{*}\) | 0.0000\(^{*}\) |
| Spectral flux, voiced (mean) | 0.2547 | 0.0000\(^{*}\) | 0.0000\(^{*}\) |
| Spectral flux, voiced (std. dev.) | 0.2547 | 0.0000\(^{*}\) | 0.0000\(^{*}\) |
| Spectral flux, unvoiced (mean) | 0.2547 | 0.4877 | 0.0000\(^{*}\) |
| Spectral slope 0–500 Hz (mean) | 0.2547 | 0.0000\(^{*}\) | 0.0000\(^{*}\) |
| Spectral slope 0–500 Hz (std. dev.) | 0.2547 | 0.0000\(^{*}\) | 0.0000\(^{*}\) |
| Spectral slope 500–1500 Hz (mean) | 0.2547 | 0.0000\(^{*}\) | 0.0000\(^{*}\) |
| Spectral slope 500–1500 Hz (std. dev.) | 0.2547 | 0.0000\(^{*}\) | 0.0000\(^{*}\) |
REFERENCES
- Amira Tutor, 2026.
- P. Afflerbach and C. Harrison. What Is Engagement, How Is It Different From Motivation, and How Can I Promote It? Journal of Adolescent & Adult Literacy, 61(2):217–220, 2017. _eprint: https://ila.onlinelibrary.wiley.com/doi/pdf/10.1002/jaal.679.
- F. S. Alamri, A. Rashad Mirdad, T. Saba, M. Amjad Raza, and U. Siddique. Investigating the Impact of Combined Spectral and Prosodic Features on Speech Emotion Recognition. IEEE Access, 14:5719–5732, 2026.
- A. P. Association. Diagnostic and statistical manual of mental disorders. American Psychiatric Publishing, Inc., Washington, DC, 5th ed., text rev. edition, 2022.
- R. S. Baker, J. L. Ocumpaugh, and J. M. A. L. Andres. BROMP quantitative field observations: A review. In R. Feldman, editor, Learning Science: Theory, Research, and Practice, pages 127–156. McGraw-Hill, New York, NY, 2020.
- A. T. Barber and S. L. Klauda. How Reading Motivation and Engagement Enable Reading Achievement: Policy Implications. Policy Insights from the Behavioral and Brain Sciences, 7(1):27–34, 2020. _eprint: https://doi.org/10.1177/2372732219893385.
- J. E. Beck. Engagement tracing: using response times to model student disengagement. In Proceedings of the 2005 conference on Artificial Intelligence in Education: Supporting Learning through Intelligent and Socially Informed Technology, pages 88–95, NLD, May 2005. IOS Press.
- Y. Benjamini and Y. Hochberg. Controlling the false discovery rate: A practical and powerful approach to multiple testing. Journal of the Royal Statistical Society, Series B (Methodological), 57(1):289–300, 1995.
- Y. S. Bonneh, Y. Levanon, O. Dean-Pardo, L. Lossos, and Y. Adini. Abnormal speech spectrum and increased pitch variability in young autistic children. Frontiers in Human Neuroscience, 4:237, 2011.
- N. Bosch, S. D’Mello, R. Baker, J. Ocumpaugh, V. Shute, M. Ventura, L. Wang, and W. Zhao. Automatic Detection of Learning-Centered Affective States in the Wild. In Proceedings of the 20th International Conference on Intelligent User Interfaces, pages 379–388, Atlanta Georgia USA, Mar. 2015. ACM.
- K. Brimo, L. Dinkler, C. Gillberg, P. Lichtenstein, S. Lundström, and J. Åsberg Johnels. The co-occurrence of neurodevelopmental problems in dyslexia. Dyslexia (Chichester, England), 27(3):277–293, Aug. 2021.
- M. Bustos-López, N. Cruz-Ramírez, A. Guerra-Hernández, L. N. Sánchez-Morales, N. A. Cruz-Ramos, and G. Alor-Hernández. Wearables for Engagement Detection in Learning Environments: A Review. Biosensors, 12(7):509, July 2022.
- R. A. Calvo and S. D’Mello. Affect Detection: An Interdisciplinary Review of Models, Methods, and Their Applications. IEEE Transactions on Affective Computing, 1(1):18–37, Jan. 2010.
- CDC. Data and Statistics on Autism Spectrum Disorder, May 2025.
- M. L. Danielson, A. H. Claussen, R. H. Bitsko, S. M. Katz, K. Newsome, S. J. Blumberg, M. D. Kogan, and R. Ghandour. ADHD Prevalence Among U.S. Children and Adolescents in 2022: Diagnosis, Severity, Co-Occurring Disorders, and Treatment. Journal of Clinical Child and Adolescent Psychology: The Official Journal for the Society of Clinical Child and Adolescent Psychology, American Psychological Association, Division 53, 53(3):343–360, 2024.
- M. M. Davidson and S. Ellis Weismer. Characterization and prediction of early reading abilities in children on the autism spectrum. Journal of Autism and Developmental Disorders, 44(4):828–845, Apr. 2014.
- D. Demszky, R. Wang, S. Geraghty, and C. Yu. Does Feedback on Talk Time Increase Student Engagement? Evidence from a Randomized Controlled Trial on a Math Tutoring Platform. In Proceedings of the 14th Learning Analytics and Knowledge Conference, pages 632–644, Kyoto Japan, Mar. 2024. ACM.
- G. Dietz, Z. Pease, B. McNally, and E. Foss. Giggle gauge: a self-report instrument for evaluating children’s engagement with technology. In Proceedings of the Interaction Design and Children Conference, IDC ’20, pages 614–623, New York, NY, USA, June 2020. Association for Computing Machinery.
- C. Doğdu, T. Kessler, D. Schneider, M. Shadaydeh, and S. R. Schweinberger. A Comparison of Machine Learning Algorithms and Feature Sets for Automatic Vocal Emotion Recognition in Speech. Sensors (Basel, Switzerland), 22(19):7561, Oct. 2022.
- S. D’Mello and A. Graesser. Dynamics of affective states during complex learning. Learning and Instruction, 22(2):145–157, Apr. 2012.
- S. D’Mello, B. Lehman, R. Pekrun, and A. Graesser. Confusion can be beneficial for learning. Learning and Instruction, 29:153–170, Feb. 2014.
- F. El Zein, M. Solis, R. Lang, and M. K. Kim. Embedding perseverative interest of a child with autism in text may result in improved reading comprehension: A pilot study. Developmental Neurorehabilitation, 19(3):141–145, June 2016.
- F. Eyben, K. R. Scherer, B. W. Schuller, J. Sundberg, E. André, C. Busso, L. Y. Devillers, J. Epps, P. Laukka, S. S. Narayanan, and K. P. Truong. The Geneva Minimalistic Acoustic Parameter Set (GeMAPS) for Voice Research and Affective Computing. IEEE Transactions on Affective Computing, 7(2):190–202, Apr. 2016.
- F. Eyben, F. Weninger, and B. Schuller. Affect recognition in real-life acoustic conditions — a new perspective on feature selection. In Interspeech 2013, pages 2044–2048. ISCA, Aug. 2013.
- F. Eyben, M. Wöllmer, and B. Schuller. Opensmile: the munich versatile and fast open-source audio feature extractor. In Proceedings of the 18th ACM international conference on Multimedia, MM ’10, pages 1459–1462, New York, NY, USA, Oct. 2010. Association for Computing Machinery.
- J. A. Fredricks, P. C. Blumenfeld, and A. H. Paris. School Engagement: Potential of the Concept, State of the Evidence. Review of Educational Research, 74(1):59–109, 2004.
- S. Freeman, S. L. Eddy, M. McDonough, M. K. Smith, N. Okoroafor, H. Jordt, and M. P. Wenderoth. Active learning increases student performance in science, engineering, and mathematics. Proceedings of the National Academy of Sciences, 111(23):8410–8415, June 2014.
- K. A. Fuller, N. S. Karunaratne, S. Naidu, B. Exintaris, J. L. Short, M. D. Wolcott, S. Singleton, and P. J. White. Development of a self-report instrument for measuring in-class student engagement reveals that pretending to engage is a significant unrecognized problem. PLOS ONE, 13(10):e0205828, Oct. 2018.
- I. Gliser, C. Mills, N. Bosch, S. Smith, D. Smilek, and J. D. Wammes. The Sound of Inattention: Predicting Mind Wandering with Automatically Derived Features of Instructor Speech. Artificial Intelligence in Education, 12163:204–215, June 2020.
- Guher Gorgun, Seyma Nur Yildirim-Erbasli, and C. D. Epp. Predicting Cognitive Engagement in Online Course Discussion Forums. July 2022.
- J. T. Guthrie, A. Wigfield, et al. Engagement and motivation in reading. New York, 2000.
- J. T. Guthrie, A. Wigfield, and W. You. Instructional Contexts for Engagement and Achievement in Reading. In S. L. Christenson, A. L. Reschly, and C. Wylie, editors, Handbook of Research on Student Engagement, pages 601–634. Springer US, Boston, MA, 2012.
- K. He, A. Gastón-Panthaki, D. Zhuo, J. Munsey, M. Zhang, and M. Warschauer. StoryPal: Supporting Young Children’s Dialogic Reading with Large Language Models. In Proceedings of the 24th Interaction Design and Children, pages 494–511, Reykjavik Iceland, June 2025. ACM.
- A. James, Y. Chua, T. Maszczyk, A. Moreno-Núñez, R. Bull, K. Lee, and J. Dauwels. Automated Classification of Classroom Climate by Audio Analysis. pages 41–49. Sept. 2019.
- B. W. Jeff Johns. A Dynamic Mixture Model to Detect Student Motivation and Proficiency.
- S. Kai, L. Paquette, R. S. Baker, N. Bosch, S. D’Mello, V. Shute, and M. Ventura. A Comparison of Video-based and Interaction-based Affect Detectors in Physics Playground.
- M. Kakoulidou, F. Le Cornu Knight, R. Filippi, and J. Hurry. The Effects of Choice on the Reading Comprehension and Enjoyment of Children with Severe Inattention and no Attentional Difficulties. Research on Child and Adolescent Psychopathology, 49(11):1403–1417, Nov. 2021.
- S. Karumbaiah, J. Ocumpaugh, and R. Baker. The Influence of School Demographics on the Relationship Between Students’ Help-Seeking Behavior and Performance and Motivational Measures. June 2019.
- K. Khowaja and S. S. Salim. A systematic review of strategies and computer-based intervention (CBI) for reading comprehension of children with autism. Research in Autism Spectrum Disorders, 7(9):1111–1121, Sept. 2013.
- S. Y. Kim, M. Rispoli, R. A. Mason, C. Lory, E. Gregori, C. A. Roberts, D. Whitford, and D. Wang. The Effects of Using Adapted Science eBooks Within Shared Reading on Comprehension and Task Engagement of Students with Autism Spectrum Disorder. Journal of Autism and Developmental Disorders, 55(12):4185–4196, Dec. 2025.
- Y. Lee, B. G. Jang, and K. C. Smith. A Systematic Review of Reading Engagement Research: What Do We Mean, What Do We Know, and Where Do We Need to Go? Reading Psychology, 42(5):540–576, 2021. _eprint: https://doi.org/10.1080/02702711.2021.1888359.
- S. Li, S. P. Lajoie, J. Zheng, H. Wu, and H. Cheng. Automated detection of cognitive engagement to inform the art of staying engaged in problem-solving. Computers & Education, 163, 2021.
- K.-Y. LIANG and S. L. ZEGER. Longitudinal data analysis using generalized linear models. Biometrika, 73(1):13–22, Apr. 1986.
- D. Litman, H. Friedberg, and K. Forbes-Riley. Prosodic cues to disengagement and uncertainty in physics tutorial dialogues. In Interspeech 2012, pages 755–758. ISCA, Sept. 2012.
- J. K. MacCallum, Y. Zhang, and J. J. Jiang. Acoustic analysis of the tremulous voice: assessing the utility of the correlation dimension and perturbation parameters. Journal of communication disorders, 43(1):35, 2010.
- N. S. McIntyre, E. J. Solari, J. E. Gonzales, M. Solomon, L. E. Lerro, S. Novotny, T. M. Oswald, and P. C. Mundy. The Scope and Nature of Reading Comprehension Impairments in School-Aged Children with Higher-Functioning Autism Spectrum Disorder. Journal of Autism and Developmental Disorders, 47(9):2838–2860, Sept. 2017.
- A. C. Miller, J. M. Keenan, R. S. Betjemann, E. G. Willcutt, B. F. Pennington, and R. K. Olson. Reading comprehension in children with ADHD: cognitive underpinnings of the centrality deficit. Journal of Abnormal Child Psychology, 41(3):473–483, Apr. 2013.
- A. Mohanta and V. Kumar Mittal. Autism Speech Analysis using Acoustic Features. In D. M. Sharma and P. Bhattacharya, editors, Proceedings of the 16th International Conference on Natural Language Processing, pages 85–94, International Institute of Information Technology, Hyderabad, India, Dec. 2019. NLP Association of India.
- K. P. Nowell, K. E. Bodner, M. D. Mohrland, and S. M. Kanne. Neurodevelopmental disorders. In Handbook of rehabilitation psychology, 3rd ed, pages 357–370. American Psychological Association, Washington, DC, US, 2019.
- J. Ocumpaugh, R. S. Baker, and M. M. T. Rodrigo. Baker Rodrigo Ocumpaugh Monitoring Protocol (BROMP) 2.0 Technical and Training Manual.
- J. Ocumpaugh, N. Nasiar, A. F. Zambrano, A. Goslen, J. Vandenberg, J. Esiason, J. Rowe, and S. Hutt. Refocusing the lens through which we view affect dynamics: The Skills, Difficulty, Value, Efficacy and Time Model. In Proceedings of the 15th International Learning Analytics and Knowledge Conference, pages 192–203, Dublin Ireland, Mar. 2025. ACM.
- L. Paquette, Z. Li, R. Baker, J. Ocumpaugh, and A. Andres. Who’s learning? Using demographics in EDM research.
- J. Parish-Morris, M. Liberman, N. Ryant, C. Cieri, L. Bateman, E. Ferguson, and R. Schultz. Exploring Autism Spectrum Disorders Using HLT. In K. Hollingshead and L. Ungar, editors, Proceedings of the Third Workshop on Computational Linguistics and Clinical Psychology, pages 74–84, San Diego, CA, USA, June 2016. Association for Computational Linguistics.
- R. Paul, L. D. Shriberg, J. McSweeny, D. Cicchetti, A. Klin, and F. Volkmar. Brief report: relations between prosodic performance and communication and socialization ratings in high functioning speakers with autism spectrum disorders. Journal of Autism and Developmental Disorders, 35(6):861–869, Dec. 2005.
- F. Pedregosa, G. Varoquaux, A. Gramfort, V. Michel, B. Thirion, O. Grisel, M. Blondel, P. Prettenhofer, R. Weiss, V. Dubourg, et al. Scikit-learn: Machine learning in python. Journal of machine learning research, 12(Oct):2825–2830, 2011.
- A. Ramakrishnan, E. Ottmar, J. LoCasale-Crouch, and J. Whitehill. Toward Automated Classroom Observation: Predicting Positive and Negative Climate. In 2019 14th IEEE International Conference on Automatic Face & Gesture Recognition (FG 2019), pages 1–8, May 2019.
- J. Ricketts, C. R. G. Jones, F. Happé, and T. Charman. Reading comprehension in autism spectrum disorders: the role of oral language and social functioning. Journal of Autism and Developmental Disorders, 43(4):807–816, Apr. 2013.
- Y. Rong, C.-J. Yang, Y. Jin, and Y. Wang. Prevalence of attention-deficit/hyperactivity disorder in individuals with autism spectrum disorder: A meta-analysis. Research in Autism Spectrum Disorders, 83:101759, May 2021.
- A. Rotnitzky and N. P. Jewell. Hypothesis Testing of Regression Parameters in Semiparametric Generalized Linear Models for Cluster Correlated Data. Biometrika, 77(3):485–497, 1990.
- S. Seabold and J. Perktold. statsmodels: Econometric and statistical modeling with python. In 9th Python in Science Conference, 2010.
- L. Tamarit, M. Goudbeek, and K. Scherer. Spectral Slope Measurements in Emotionally Expressive Speech. 2008.
- B. Tracey, D. Volfson, J. Glass, R. Haulcy, M. Kostrzebski, J. Adams, T. Kangarloo, A. Brodtmann, E. R. Dorsey, and A. Vogel. Towards interpretable speech biomarkers: exploring MFCCs. Scientific Reports, 13:22787, Dec. 2023.
- N. J. Unrau and M. Quirk. Reading Motivation and Reading Engagement: Clarifying Commingled Conceptions. Reading Psychology, 35(3):260–284, 2014. _eprint: https://doi.org/10.1080/02702711.2012.684426.
- C. Vukelich. The development of listening comprehension through storytime. Language Arts, 53(8):889–891, 1976.
- M. Watanabe, M. Imundo, K. Christhilf, T. Arner, and D. S. Mcnamara. Building Reading Comprehension and Knowledge with iSTART: An ITS to Provide Formative Feedback in Reading Instruction at Scale. In Proceedings of the Eleventh ACM Conference on Learning @ Scale, pages 510–513, Atlanta GA USA, July 2024. ACM.
- M. F. Westerveld and J. M. A. Roberts. The Oral Narrative Comprehension and Production Abilities of Verbal Preschoolers on the Autism Spectrum. Language, Speech, and Hearing Services in Schools, 48(4):260–272, Oct. 2017.
- A. Y. Wong, R. L. Bryck, R. S. Baker, S. Hutt, and C. Mills. Using a Webcam Based Eye-tracker to Understand Students’ Thought Patterns and Reading Behaviors in Neurodivergent Classrooms. In LAK23: 13th International Learning Analytics and Knowledge Conference, LAK2023, pages 453–463, New York, NY, USA, Mar. 2023. Association for Computing Machinery.
- Y. Xu, D. Wang, P. Collins, H. Lee, and M. Warschauer. Same benefits, different communication patterns: Comparing Children’s reading with a conversational agent vs. a human partner. Computers & Education, 161:104059, Feb. 2021.
- Y. Xu and M. Warschauer. A content analysis of voice-based apps on the market for early literacy development. In Proceedings of the Interaction Design and Children Conference, pages 361–371, London United Kingdom, June 2020. ACM.
- Z. Xu, K. K. Wijekumar, G. Ramirez, X. Hu, and R. Irey. The effectiveness of intelligent tutoring systems on K-12 students’ reading comprehension: A meta-analysis. British Journal of Educational Technology, 50(6):3119–3137, 2019. _eprint: https://bera-journals.onlinelibrary.wiley.com/doi/pdf/10.1111/bjet.12758.
- V. P. Yache, L. Moradbakhti, I. Neuner, and T. Veselinovic. Predicting affective engagement and mental strain from prosodic speech features. Frontiers in Psychiatry, 16:1656292, Sept. 2025.
- D. Yekutieli and Y. Benjamini. Resampling-based false discovery rate controlling multiple test procedures for correlated test statistics. Journal of Statistical Planning and Inference, 82(1):171–196, Dec. 1999.
- B. Zablotsky, M. D. Bramlett, and S. J. Blumberg. The Co-Occurrence of Autism Spectrum Disorder in Children With ADHD. Journal of Attention Disorders, 24(1):94–103, Jan. 2020.
- A. F. Zambrano, N. Nasiar, J. Ocumpaugh, A. Goslen, J. Zhang, J. Rowe, J. Esiason, J. Vandenberg, and S. Hutt. Says Who? How different ground truth measures of emotion impact student affective modeling. pages 211–223, 2024.
- S. L. Zeger and K.-Y. Liang. Longitudinal Data Analysis for Discrete and Continuous Outcomes. Biometrics, 42(1):121–130, 1986.
- Z. Zeng, S. Chaturvedi, and S. Bhat. Learner affect through the looking glass: Characterization and detection of confusion in online courses. 2017.
- J. Zhang, K. Wang, and Y. Zhang. Physiological Characterization of Student Engagement in the Naturalistic Classroom: A Mixed-Methods Approach. Mind, Brain, and Education, 15(4):322–343, 2021. _eprint: https://onlinelibrary.wiley.com/doi/pdf/10.1111/mbe.12300.
1Not all statistical functions are applied to all low-level acoustic features.
2The resulting dataset will be released for future work following the completion of the requisite anonymization process.
© 2026 Copyright is held by the author(s). This work is distributed under the Creative Commons Attribution-NonCommercial-NoDerivatives 4.0 International (CC BY-NC-ND 4.0) license.