ABSTRACT
Student retention remains a significant challenge in higher education, with early academic failure frequently serving as an initial indicator of attrition. Yet many models focus on binary outcomes that can mask the severity of academic struggle for some students. Thus, this ongoing research focuses on students who experienced multiple failures (i.e., receiving two or more D or F grades) in their first semester. We are exploring two research questions: 1) how early can we meaningfully identify students at risk of experiencing multiple failures, and 2) what behavioral indicators might signal that a student is more likely to experience multiple failures. Using longitudinal LMS data from the Unizin Data Platform for 5,094 first-year students at a large public university, we applied machine learning to 352 temporal features to identify at-risk students. Preliminary models achieved a peak recall of 0.68, identifying critical intervention windows at Week 5 and Week 11. These findings suggest that while early behavioral markers exist, mid-semester disengagement may represent a critical point for "just-in-time" intervention.
Keywords
1. INTRODUCTION
The transition to college can be a challenging time for students, both on a personal and institutional level [25, 10]. These challenges can act as barriers to student success, with student retention remaining a persistent challenge for higher education institutions. It represents a critical goal for all stakeholders due to both the economic and social benefits for individuals [12] and the financial and academic stability it signals for institutions [21, 20]. Despite years of effort, retention rates have remained relatively stagnant [8], with recent data indicating that approximately 35% of US students fail to graduate from their program [6]. First-year students are particularly vulnerable to attrition with roughly 18% of students failing to return for their second year [19].
Importantly, students’ experiences of transition and persistence, as well as their choices about remaining in higher education, are shaped by differences in prior preparation, available support networks, and broader structural inequities [25, 3]. Understanding when and how these transition and persistence challenges emerge has therefore become as important as measuring whether students ultimately persist. Institutions are increasingly seeking ways to identify actionable moments during the semester when timely support can alter a student’s trajectory, rather than relying solely on retrospective indicators, such as final grades or withdrawal status. To address these needs, institutions have turned to Learning Analytics and ’Big Data’ to identify behavioral patterns that place students at risk. Early efforts in this space proved that data from Learning Management Systems (LMS), such as login frequency and resource engagement, could serve as a viable ’early warning system’ [15]. More recent work has used machine learning techniques to assess how administrative, demographic, and behavioral data can be used to accurately identify and predict students’ level of success or failure [4, 5]. Furthermore, there is a growing shift toward progressive modeling that leverages the temporal nature of student behavior to identify academic struggle as it unfolds, rather than after the fact [27, 17].
However, a gap remains in understanding how academic difficulty can accumulate to place students on a path toward attrition. Prior work has considered failure and attrition as binary constructs, distinguishing only between students who succeed and those who do not. While analytically convenient, this framing can obscure meaningful variation in how academic struggle unfolds, particularly for students who encounter repeated setbacks within a single term. Experiencing multiple course failures may represent a qualitatively different moment in a student’s trajectory [16], one that signals compounding academic and motivational challenges rather than an isolated difficulty. This study investigates this indicator at scale, considering the relationship between students’ LMS usage across courses and their risk of experiencing ’multiple failures’, here defined as receiving two or more D or F grades in their first semester.
2. RELATED WORK
Early work using LMS behavioral trace data demonstrated their importance in predicting academic risk. For example, volume metrics, such as frequency and duration of logins, were found to be significant predictors of performance, accounting for as much as 31% of the variability in final grades [18]. Subsequent work using richer datasets demonstrated that combining interaction logs with grade data and other non-LMS enrollment data could reliably be used for early outcome prediction (in some cases as soon as the 8th day of instruction) [23] and successfully used for automated intervention [1]. As data availability has increased, this work has expanded beyond descriptive analytics to include machine learning approaches that integrate demographic, administrative, and behavioral data sources in an effort to improve predictive accuracy [2, 14, 13]. These more complex datasets have allowed us to better model academic risk as a dynamic process rather than a static outcome. However, analyzing LMS behavior at an institutional level has historically been hindered by fragmented data systems that often lacked uniformity both within and between institutions. In response to this, the Unizin Consortium was developed as a collaborative effort among research universities to create a shared, standardized data infrastructure to support the analysis of student engagement at-scale [28].
Despite the substantial progress that has been made in identifying students at risk of dropout or course failure, most studies operationalize academic risk using binary outcome measures or focus on failures that occur within individual courses or programs. Such approaches provide useful indicators of eventual outcomes but may obscure differences in how academic difficulties emerge and accumulate across a student’s broader educational experience. Specifically, experiencing multiple course failures in a single academic term represents one such profile. For first-year students in particular, this pattern can trigger institutional probationary policies, financial aid consequences, and reduced opportunities for academic recovery, creating a precarious academic position early in their college careers [26, 22, 7]. Despite the institutional significance, relatively little research has examined how behavioral signals associated with multiple concurrent failures develop over time.
The present study thus extends prior learning analytics work by shifting the analytic focus from predicting whether failure occurs to understanding when and how clusters of academic difficulty become detectable. Recent increases in the availability of large-scale, institutionally integrated educational data have made it possible to examine these patterns with greater temporal and contextual resolution than was previously feasible. Leveraging longitudinal LMS engagement data drawn from the Unizin Data Platform, which links behavioral and administrative records within an authentic undergraduate environment, we (1) model multiple-course failure as a distinct outcome, and (2) examine the temporal emergence of behavioral indicators that may support earlier, more targeted intervention. Guided by this perspective, we consider two research questions:
RQ1: How well can we predict that students will experience multiple failures in their first semester of college?
RQ2: How early can we make meaningful predictions about students’ failure rate?
By using behavioral data related to students’ LMS engagement, we aim to identify the factors that most meaningfully predict student failure with the long-term goal of providing more timely and equitable institutional intervention.
3. METHODOLOGY
Data for this study were collected from the Unizin Data Platform, which is a repository of LMS records from the 16 university members of Unizin [28]. We initially queried the database to select all students who were first enrolled in their program in Fall 2022 at a large public Midwestern university. The initial sample comprised 8,382 students. To ensure the analysis focused on a consistent first-year undergraduate cohort, a multi-step data cleaning process was applied. First, we excluded students with interaction records prior to the start of the semester to remove continuing or transfer students. Second, students with fewer than 3 graded courses were excluded as a proxy for full-time status. Additionally, we removed students enrolled in graduate-level coursework. The final analytic sample consisted of 5,094 students. Due to student privacy concerns, the original dataset used in this study is not publicly available. However, a synthetic dataset that mirrors the original data structure and the complete analysis pipeline are available on the Open Science Framework [24].
For this analysis, we defined ’failure’ as a grade below a C-, based on institutional guidelines. Using this definition, we categorized students into three groups based on their Fall 2022 performance: (1) Multiple Failure (N=160), comprising students with two or more Ds or Fs; (2) Single Failure (N=321), serving as a comparative failure group for students with exactly one D or F; and (3) Non-Failure (N=4613), representing students who met all course requirements. Descriptive results indicate that students who experience multiple instances of failure in their first semester exhibit significantly lower term-to-term persistence, with only 50% continuing past their first year, compared to 92% for non-failure students. This highlights the need to understand what behaviors may be most associated with these failure experiences, so that we can better intervene before these students leave.
3.1 Feature Engineering
Features were extracted from the Unizin Data Platform to capture granular behavioral patterns. The study period covered a 16 week semester, resulting in a total of 240 base features (15 per week).
3.1.1 Base Feature Identification
We identified core behavioral metrics to serve as proxies for student engagement and self-regulation.
- Temporal Interaction Patterns: To assess possible temporal interaction effects, we categorized all LMS events into four distinct time-of-day bins (12:00 AM – 6:00 AM, 6:00 AM – 12:00 PM, 12:00 PM – 6:00 PM, and 6:00 PM – 12:00 AM).
- Self-Regulation Proxies: Engagement with the LMS "To-Do" list and calendar features was used to represent planning and organizational behavior. This aligns with prior research that shows that learners with higher self-regulation skills engage in greater planning behaviors than their peers [11].
- Volume and Intensity: We captured the duration of active sessions, the frequency of specific actions, and the number of distinct 30-minute study sessions.
- Performance Indicators: Unizin compares assignment submission timestamps to due dates to calculate submission latency, and these calculations were used to create an average weekly submission metric.
3.1.2 Feature Engineering and Aggregation
To simulate real-time predictive capabilities, raw event data were aggregated at the weekly level. To account for different dimensions of student effort, we engineered three specific types of derived features:
- Time-Binned Counts & Proportions: For each time-of-day bin, we calculated both the raw count of interactions and the proportion of the week’s total activity that occurred within that bin.
- Proportional Engagement: We calculated the proportion of total weekly To-Do list activity relative to overall To-Do list engagement to normalize planning behavior.
- Cumulative Features: To capture longitudinal trends, we created cumulative versions of count and duration metrics. For interaction counts, the four time-binned features were first summed to create a single "Total Interactions" metric for the week, which was then iteratively added to create a single "Cumulative Total Interactions" feature. All other non-proportional metrics (e.g., Student Activity Scores, Sessions) were aggregated individually. This process resulted in an additional 112 cumulative features, yielding a final dataset of 352 potential features.
To ensure the ecological validity of our predictive models, we implemented temporal constraints on the feature sets. At any given point in the semester (Week k), the model was restricted to a "snapshot" of the student’s history up to that point. The total number of features available to the model at Week k is calculated as follows:
In this calculation, 15 represents the base features generated each week (e.g., interaction counts, time-binned proportions), and 7 represents the longitudinal cumulative features (e.g., running totals of interactions). This approach ensures that the model never "sees" into the future and instead relies only on information that would be available to an instructor or institution in a real-time environment.
To prepare the dataset for modeling, we performed feature selection and normalization independently for each weekly model iteration. Specifically, we removed features that were strongly correlated (r>.90) to address potential multicollinearity, scaled features using a standardized scaler, and applied the Synthetic Minority Over-sampling Technique (SMOTE) [9] to the training folds to address class imbalances.
3.2 Modeling Approach
The dataset was split at the student level into 80% training data (N = 4075) and 20% testing data (N = 1019). We created 5 different randomized training and testing splits and applied a 5-fold cross-validation procedure using a Randomized Search (k=5) to each of the training datasets to tune model parameters and obtain reliable performance estimates. We utilized Random Forest and XGBoost classifiers due to their ability to handle non-linear relationships and high-dimensional data. Given that the Multiple Failure group represents a relatively small proportion of the population (3.1%), we addressed the severe class imbalance by optimizing our models for Recall (sensitivity). Recall reflects the proportion of truly "at-risk" students that the model successfully identifies. In this context, low recall would mean students experiencing multiple failures are overlooked by the system, preventing institutions from offering potential support during critical periods. Because prior research has shown that early academic setbacks can compound and contribute to attrition, missing these students (false negatives) represents the most consequential form of error.
4. CURRENT PROGRESS
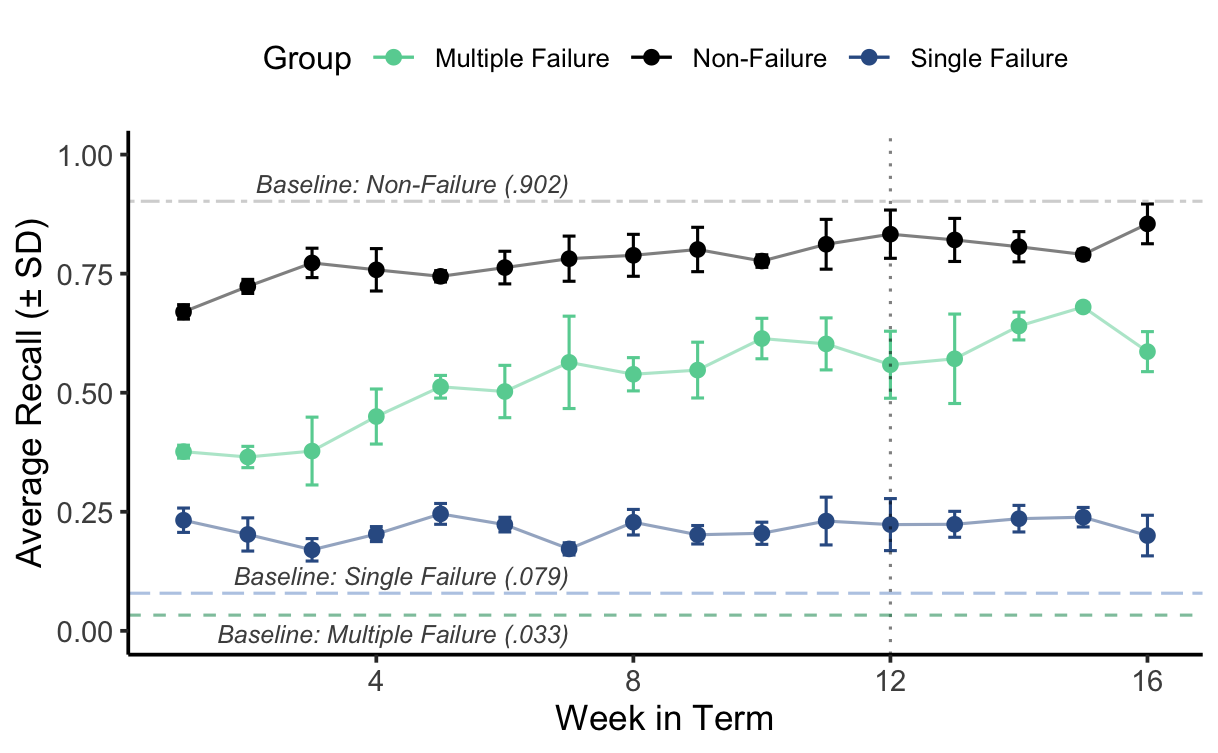
Model performance indicates that meaningful detection becomes possible relatively early in the term. By Week 5, recall for the Multiple Failure group exceeded 50%, suggesting that behavioral differences associated with later academic difficulty are already observable within the first month of coursework. Performance continued to improve as more temporal data became available, reaching a peak recall of .68 by Week 15 (Figure 1).
To interpret which behaviors contributed most strongly to model predictions, we examined the SHAPley Additive Explanations (SHAP) values (Figure 2).
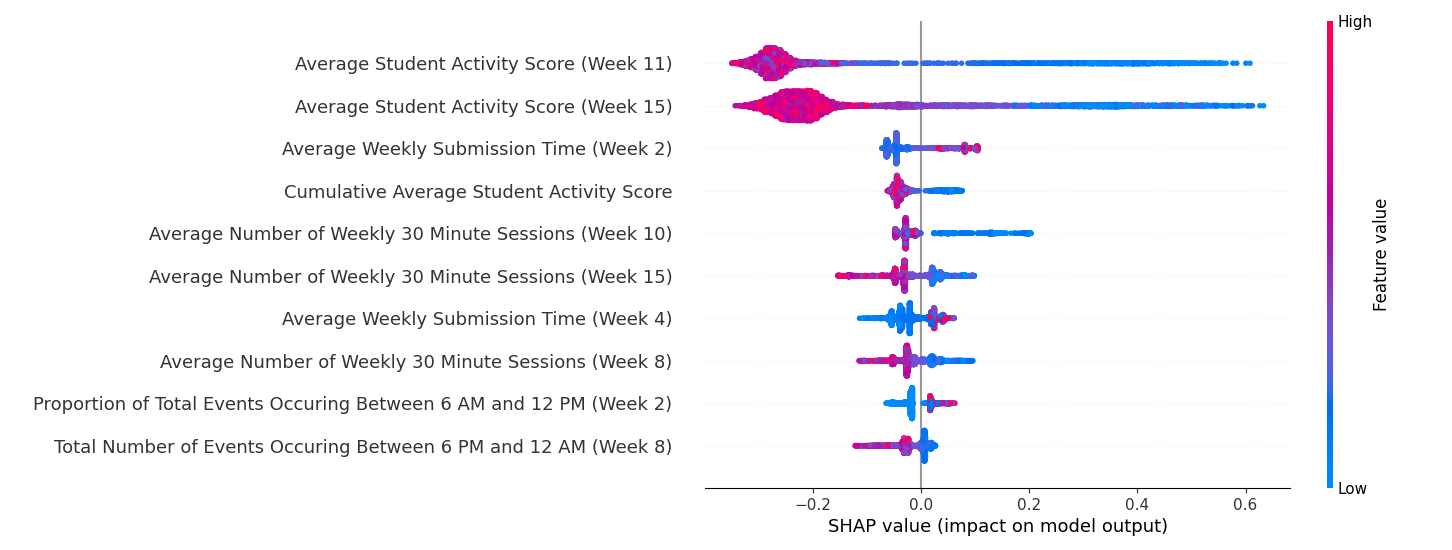
This analysis revealed two critical windows for intervention. First, features related to late submissions in the first month remained among the strongest predictors of multiple failure even at the end of the semester. This indicates that a pattern of procrastination established in the first few weeks of college is a persistent indicator of risk. Second, interaction behavior during Weeks 8-11 emerged as highly influential. This period immediately follows midterm exams, and suggests that this drop in interaction may reflect academic disengagement following disappointing midterm results. This window may thus be an important window for increased support, especially for students already showing signs of academic difficulty.
Our analysis also revealed that not all instances of academic difficulty reflect the same underlying process. While students in the Multiple Failure group exhibit more generalized patterns of disengagement that became increasingly detectable over time, Single Failure students were frequently misclassified as Non-Failure. This suggests that failing a single course may be an idiosyncratic, localized, or course-specific challenge tied to the demands of a particular course rather than a broad behavioral shift.
5. CONTRIBUTION AND FUTURE WORK
This research offers both theoretical and practical contributions to the Educational Data Mining and Learning Sciences communities. From a learning science perspective, this work offers theoretical insights into how academic disengagement unfolds at an institutional level. Additionally, the use of the Unizin Data Platform ensures that the methodology applied to this work is scalable and provides a blueprint for standardized institution-level learning analytics. This type of cross-institutional work will be key for determining whether observed behavioral patterns can generalize to other settings.
With an eye towards generalizability, future research will look to replicate these findings across different first-year cohorts to solidify the timing of key behavioral windows. We would also like to explore additional analyses using explainable AI and deep learning methods to improve model performance and ensure that we are accurately identifying the behavioral patterns that are most predictive of repeated failure. In addition, we will be carrying out a longitudinal analysis to assess how behavioral signatures evolve over time, particularly for students in the Multiple Failure group. Assessing how behaviors change over time for students who persisted despite experiencing significant early academic setbacks could provide insights into the types of behaviors that allowed them to persist. Lastly, we plan to integrate disciplinary data to determine if certain majors or gateway courses exhibit unique engagement signatures and explore how course difficulty influences learning behavior.
The ultimate goal of this research is to support the development of proactive early warning systems. Identifying ’Multiple Failure’ trajectories allows institutions to deploy limited advising resources to the struggling students most likely to drop out. By focusing on ’just-in-time’ intervention, we can better identify the students who are struggling the most as they transition to college and provide them with the support they need before academic probation or permanent withdrawal occurs.
6. REFERENCES
- K. E. Arnold and M. D. Pistilli. Course signals at purdue: Using learning analytics to increase student success. In Proceedings of the 2nd International Conference on Learning Analytics and Knowledge (LAK ’12), pages 267–270, New York, NY, USA, 2012. Association for Computing Machinery.
- L. Aulck, D. Nambi, and N. Velagapudi. Mining university registrar records to predict first-year undergraduate attrition. In Proceedings of The 12th International Conference on Educational Data Mining, EDM 2019, pages 9–18, Montreal, Canada, 2019. International Educational Data Mining Society.
- B. O. Barefoot*. Higher education’s revolving door: confronting the problem of student drop out in us colleges and universities. Open Learning: The Journal of Open, Distance and e-Learning, 19(1):9–18, 2004.
- C. Beaulac and J. S. Rosenthal. Predicting university students’ academic success and major using random forests. Research in Higher Education, 60(7):1048–1064, 2019.
- J. Berens, K. Schneider, S. Gortz, S. Oster, and J. Burghoff. Early detection of students at risk - predicting student dropouts using administrative student data from german universities and machine learning methods. Journal of Educational Data Mining, 11(3):1–41, 2019.
- B. Berg, B. Randolph, M. Holsapple, and D. Shapiro. Yearly progress and completion. Technical report, National Student Clearinghouse Research Center, Herndon, VA, December 2025.
- N. A. Bowman and N. Jang. What is the purpose of academic probation? its substantial negative effects on four-year graduation. Research in Higher Education, 63(8):1285–1311, 2022.
- G. D. Caruth. Student engagement, retention, and motivation: Assessing academic success in today’s college students. Participatory Educational Research, 5(1):17–30, 2018.
- N. V. Chawla, K. W. Bowyer, L. O. Hall, and W. P. Kegelmeyer. Smote: synthetic minority over-sampling technique. Journal of artificial intelligence research, 16:321–357, 2002.
- R. Deil-Amen and R. L. Turley. A review of the transition to college literature in sociology. Teachers College Record, 109(10):2324–2366, 2007.
- F. S. Kia, S. D. Teasley, M. Hatala, S. A. Karabenick, and M. Kay. How patterns of students dashboard use are related to their achievement and self-regulatory engagement. In Proceedings of the Tenth International Conference on Learning Analytics & Knowledge (LAK ’20), pages 340–349, Frankfurt, Germany, 2020. Association for Computing Machinery.
- G. D. Kuh, J. Kinzie, J. H. Schuh, and E. J. Whitt. Student success in college: Creating conditions that matter. John Wiley & Sons, Hoboken, New Jersey, 2011.
- Y. C. Liew, K. Y. Lim, T. Y. Lim, C. J. Tan, K. K. Chai, and X. Deng. The effect of data transformation techniques on machine learning performance: A case study on student dropout prediction. In 2024 IEEE 5th International Conference on Pattern Recognition and Machine Learning (PRML), pages 1–7, Chongqing, China, 2024. IEEE.
- O. H. T. Lu, A. Y. Q. Huang, J. C. H. Huang, A. J. Q. Lin, and S. J. H. Yang. Applying learning analytics for the early prediction of students’ academic performance in blended learning. Journal of Educational Technology & Society, 21(2):220–232, 2018.
- L. P. Macfadyen and S. Dawson. Mining lms data to develop an “early warning system” for educators: A proof of concept. Computers & Education, 54(2):588–599, 2010.
- A. J. Martin and H. W. Marsh. Fear of failure: Friend or foe? Australian Psychologist, 38(1):31–38, 2003.
- M. V. Martins, L. Baptista, J. Machado, and V. Realinho. Multi-class phased prediction of academic performance and dropout in higher education. Applied Sciences, 13(8):1–15, 2023.
- L. V. Morris, C. Finnegan, and S.-S. Wu. Tracking student behavior, persistence, and achievement in online courses. The Internet and Higher Education, 8(3):221–231, 2005.
- National Center for Education Statistics. Undergraduate retention and graduation rates. Condition of Education. U.S. Department of Education, Institute of Education Sciences, 2022. Accessed: 2026-02-10.
- P. O’Keeffe. A sense of belonging: Improving student retention. College Student Journal, 47(4):605–613, 2013.
- P. S. Pruett and B. Absher. Factors influencing retention of developmental education students in community colleges. Delta Kappa Gamma Bulletin, 81(4):32–40, 2015.
- L. Schudde and J. Scott-Clayton. Pell grants as performance-based scholarships? an examination of satisfactory academic progress requirements in the nation’s community colleges. Research in Higher Education, 57(8):943–967, 2016.
- V. C. Smith, A. Lange, and D. R. Huston. Predictive modeling to forecast student outcomes and drive effective interventions in online community college courses. Online Learning, 16(3):51–61, June 2012.
- C. Steadman.
Predicting
failure
trajectories
using
longitudinal
lms
behaviors.
https://osf.io/ua2q8/overview, 2026. Accessed: 2026-06-22. - P. T. Terenzini, L. I. Rendon, M. Lee Upcraft, S. B. Millar, K. W. Allison, P. L. Gregg, and R. Jalomo. The transition to college: Diverse students, diverse stories. Research in higher education, 35(1):57–73, 1994.
- V. Tinto. Completing College: Rethinking Institutional Action. University of Chicago Press, Chicago, IL, 2012.
- R. Trakunphutthirak and V. C. S. Lee. Application of educational data mining approach for student academic performance prediction using progressive temporal data. Journal of Educational Computing Research, 60(3):742–776, 2022.
- Unizin Consortium. Unizin Data Platform. Unizin Product Information, 2024. Accessed: 2026-02-10.
© 2026 Copyright is held by the author(s). This work is distributed under the Creative Commons Attribution-NonCommercial-NoDerivatives 4.0 International (CC BY-NC-ND 4.0) license.