ABSTRACT
In this paper, I present a validated crosswalk of large administrative datasets, created using LLM co-design, which enables cross-dataset institutional analytics and causal inference. Specifically, I document the creation of a replicable crosswalk pipeline to link national public datasets on school demographics and Advanced Placement (AP) offerings. Using the resulting detailed panel on AP access at U.S. schools, I quantify changes in AP access over time by student demographics. I then use quasi-experimental methods to investigate the effects of two large-scale curricular interventions of the last decade: new AP courses in computer science and precalculus. I find that both courses have had large effects in increasing access and participation in AP math and computer science, with largest effects for underrepresented groups including Black and low-income students and the schools that serve them. In line with open science principles, I plan to make the crosswalk, construction code, and detailed national dataset public to enable future research.
Keywords
INTRODUCTION
Rigorous secondary math and computer science education play a key role in supporting both the global economy and individuals' success [14, 16]. However, in the U.S. and other countries, challenges persist in ensuring broad STEM participation and success, including disparities in course access and participation by race, socioeconomic status, and gender [23].
A key provider of advanced secondary STEM learning is the nationwide Advanced Placement (AP) program, which serves three million students annually. Students take courses at their high schools and then a standardized end-of-year exam administered by the College Board, with qualifying scores earning students advanced standing or credit at many colleges. Historically, AP calculus and CS participation have mirrored broader disparities. In response to these challenges, the College Board has introduced two new, introductory-level AP courses in recent years: CS Principles in 2016-17 and Precalculus in 2023-24 [11, 25]. Each was designed to attract a broader group of students and has launched at scale, with about 1.5 million combined exams to date.
A difficulty in evaluating the effects of these courses and other interventions to increase STEM participation lies in limited national data availability [6]. The College Board has stopped releasing statistics on AP participation, access, and success disaggregated by race and subject [18]. Meanwhile, the last federal data release disaggregating access and participation in AP, calculus, and other advanced courses by subgroup predates the launch of AP Precalculus [23].
In this project, I present a novel LLM-assisted pipeline for joining College Board and federal data from public sources to present a comprehensive look at AP availability in the U.S. by school and subgroup. Validating against administrative data from two states, I show that my crosswalk is more comprehensive, current, and reproducible than the leading existing one. I also join in school-by-subgroup outcome data from Massachusetts, which provides rich publicly available data. In line with open science practices [2], I plan to publicly release the combined data, crosswalk, and generating code, enabling other researchers to study questions related to advanced course access.
Using quasi-experimental causal methods, an emerging area of interest in EDM [3], I evaluate the effects of the two national-level AP curriculum interventions. Nationally, at the institutional level, I find that AP CS Principles and Precalculus had substantial effects on increasing AP math and CS availability, especially for schools serving more Black or low-income students. Additionally, offering CS Principles built a pathway to later offering the more advanced AP CS course. In Massachusetts, I find that both courses substantially increased AP STEM participation, exam passing, and college-preparatory curriculum completion, especially among Black, Hispanic, and socioeconomically disadvantaged students. These results replicate my previous CS Principles results and extend them to the national level, richer outcomes, and a new subject area [13].
I anticipate this project contributing to the EDM community by providing a rich source of open data, a model for AI-assisted dataset construction that enables at-scale institutional analytics using public administrative data, and causal evidence on a national curriculum intervention that is currently improving CS learning outcomes at scale.
data pipeline construction with ai assistance
In this section, I describe the process of using LLM assistance to link large-scale administrative datasets, specifically the Common Core of Data and the College Board AP Ledger.
I begin with annual school demographics and directory data for all public schools that ever enroll Grade 9-12 students between 2007-08 and 2024-25 from the federal Common Core of Data (CCD) [22]. The dataset includes 39,609 schools that enroll a total of 270 million Grade 9-12 students.
From the College Board (CB) AP Course Ledger [7], I obtain comprehensive yearly records of audited AP course offerings at 23,435 U.S. schools, including private schools, between 2007-08 and 2025-26. I also obtain CB codes for an additional 26,229 institutions, which I code as never having AP.
Next, using LLM assistance, I construct a CCD-to-CB crosswalk to match schools across the two datasets using school names, addresses, and GPS coordinates, which are included in each data source. For efficiency and reproducibility, the LLM is not used directly to assess each match’s quality, as in previous work [19]. Rather, Claude Code (Opus 4.6) co-designs, documents, and implements a fuzzy matching logic algorithm. The approach is designed to capture schools that change names, move addresses, or change CCD codes over time, which can cause one dataset’s records to differ from the others.
First, the matching algorithm normalizes school addresses and names (for example, resolving “Middle” vs. “Junior High”), including historical information. Next, it constructs an address index and assesses candidate CCD-to-CB matches using two primary strategies. One strategy considers a CCD and CB school pair to match if they share a normalized address and name similarity, defined by Jaccard and SequenceMatcher, exceeds a threshold. The second strategy defines a match of a pair within a shared geographic block if the combined similarity of name and address, considering both string similarity and geographic distance, exceeds a threshold [21]. Finally, it resolves conflicts where multiple CCD schools share a single CB code by classifying them as “false positives”, in which case a worse-matching school loses its assignment; “horizontal composites”, involving a sub-school at the same address; and “vertical composites”, where a new CCD school takes over enrollment from a previous one for subsequent years.
Matching approaches, thresholds, and implementation details are adjusted through iterative discussion of the 494 schools in Massachusetts until all disagreements with manually verified matchings are resolved. For example, validating against external sources, I identify both correct and incorrect matches among school pairs that share an address but not a name across datasets. To distinguish these cases, Claude designs and constructs a “recent rename bridge” that checks a historical list of names and CB codes to resolve the discrepancy [4]. The AI-assisted process enables rapid construction of a nontrivial matching algorithm that handles a broad variety of special cases and works at national scale, while requiring researcher inspection of only a small sample of each case type. The resulting crosswalk code runs on a MacBook Pro in about two hours. By contrast, the best previous publicly available crosswalk relies in part on a less precise name and ZIP-based matching, and in part on manual searches by Mechanical Turk workers [10, 20]. My crosswalk code is also fully replicable: future researchers can easily recreate all matches and extend to additional data, such as future years, without needing crowdsourced labor, model inference, or state-specific datasets.
My national crosswalk matches 27,866 CCD codes to CB codes, encompassing 97% of total Grade 9-12 enrollment. Comparing my matches to the pre-existing Davenport crosswalk, which provides CB codes for 20,625 of the CCD schools, I find 18,930 cases in which my crosswalk agrees, 914 cases in which Davenport codes do not appear in College Board data (i.e., defunct or mistaken codes), and 781 other cases where my crosswalk disagrees with or excludes a Davenport match. Importantly, my crosswalk introduces matches for 8,817 previously unmatched schools.
I validate the crosswalk by comparison to administrative data available from two states. In Colorado, among 512 schools that are in the CCD universe and have a non-defunct CB code in administrative data, my crosswalk has 481 correct and 6 incorrect matches, while Davenport has 431 correct and 5 incorrect [8, 15]. In Illinois, among 848 schools in the CCD universe with an administrative CEEB code, I have 793 correct and 7 incorrect matches, while Davenport has 697 correct and 11 incorrect. Overall, my crosswalk matches 94% of schools in these two states, with 99% of matches correct. The results sat an LLM-assisted crosswalk can enable dataset linkage with higher efficiency, accuracy, and coverage than human-implemented approaches.
patterns of ap availability
The crosswalk enables construction of a detailed panel dataset of AP availability at U.S. schools by year and subject joined with demographic information, which I use to characterize patterns of AP availability over time. While I focus on in-person math and computer science courses, other researchers could use the same dataset to investigate other subjects or virtual course-taking.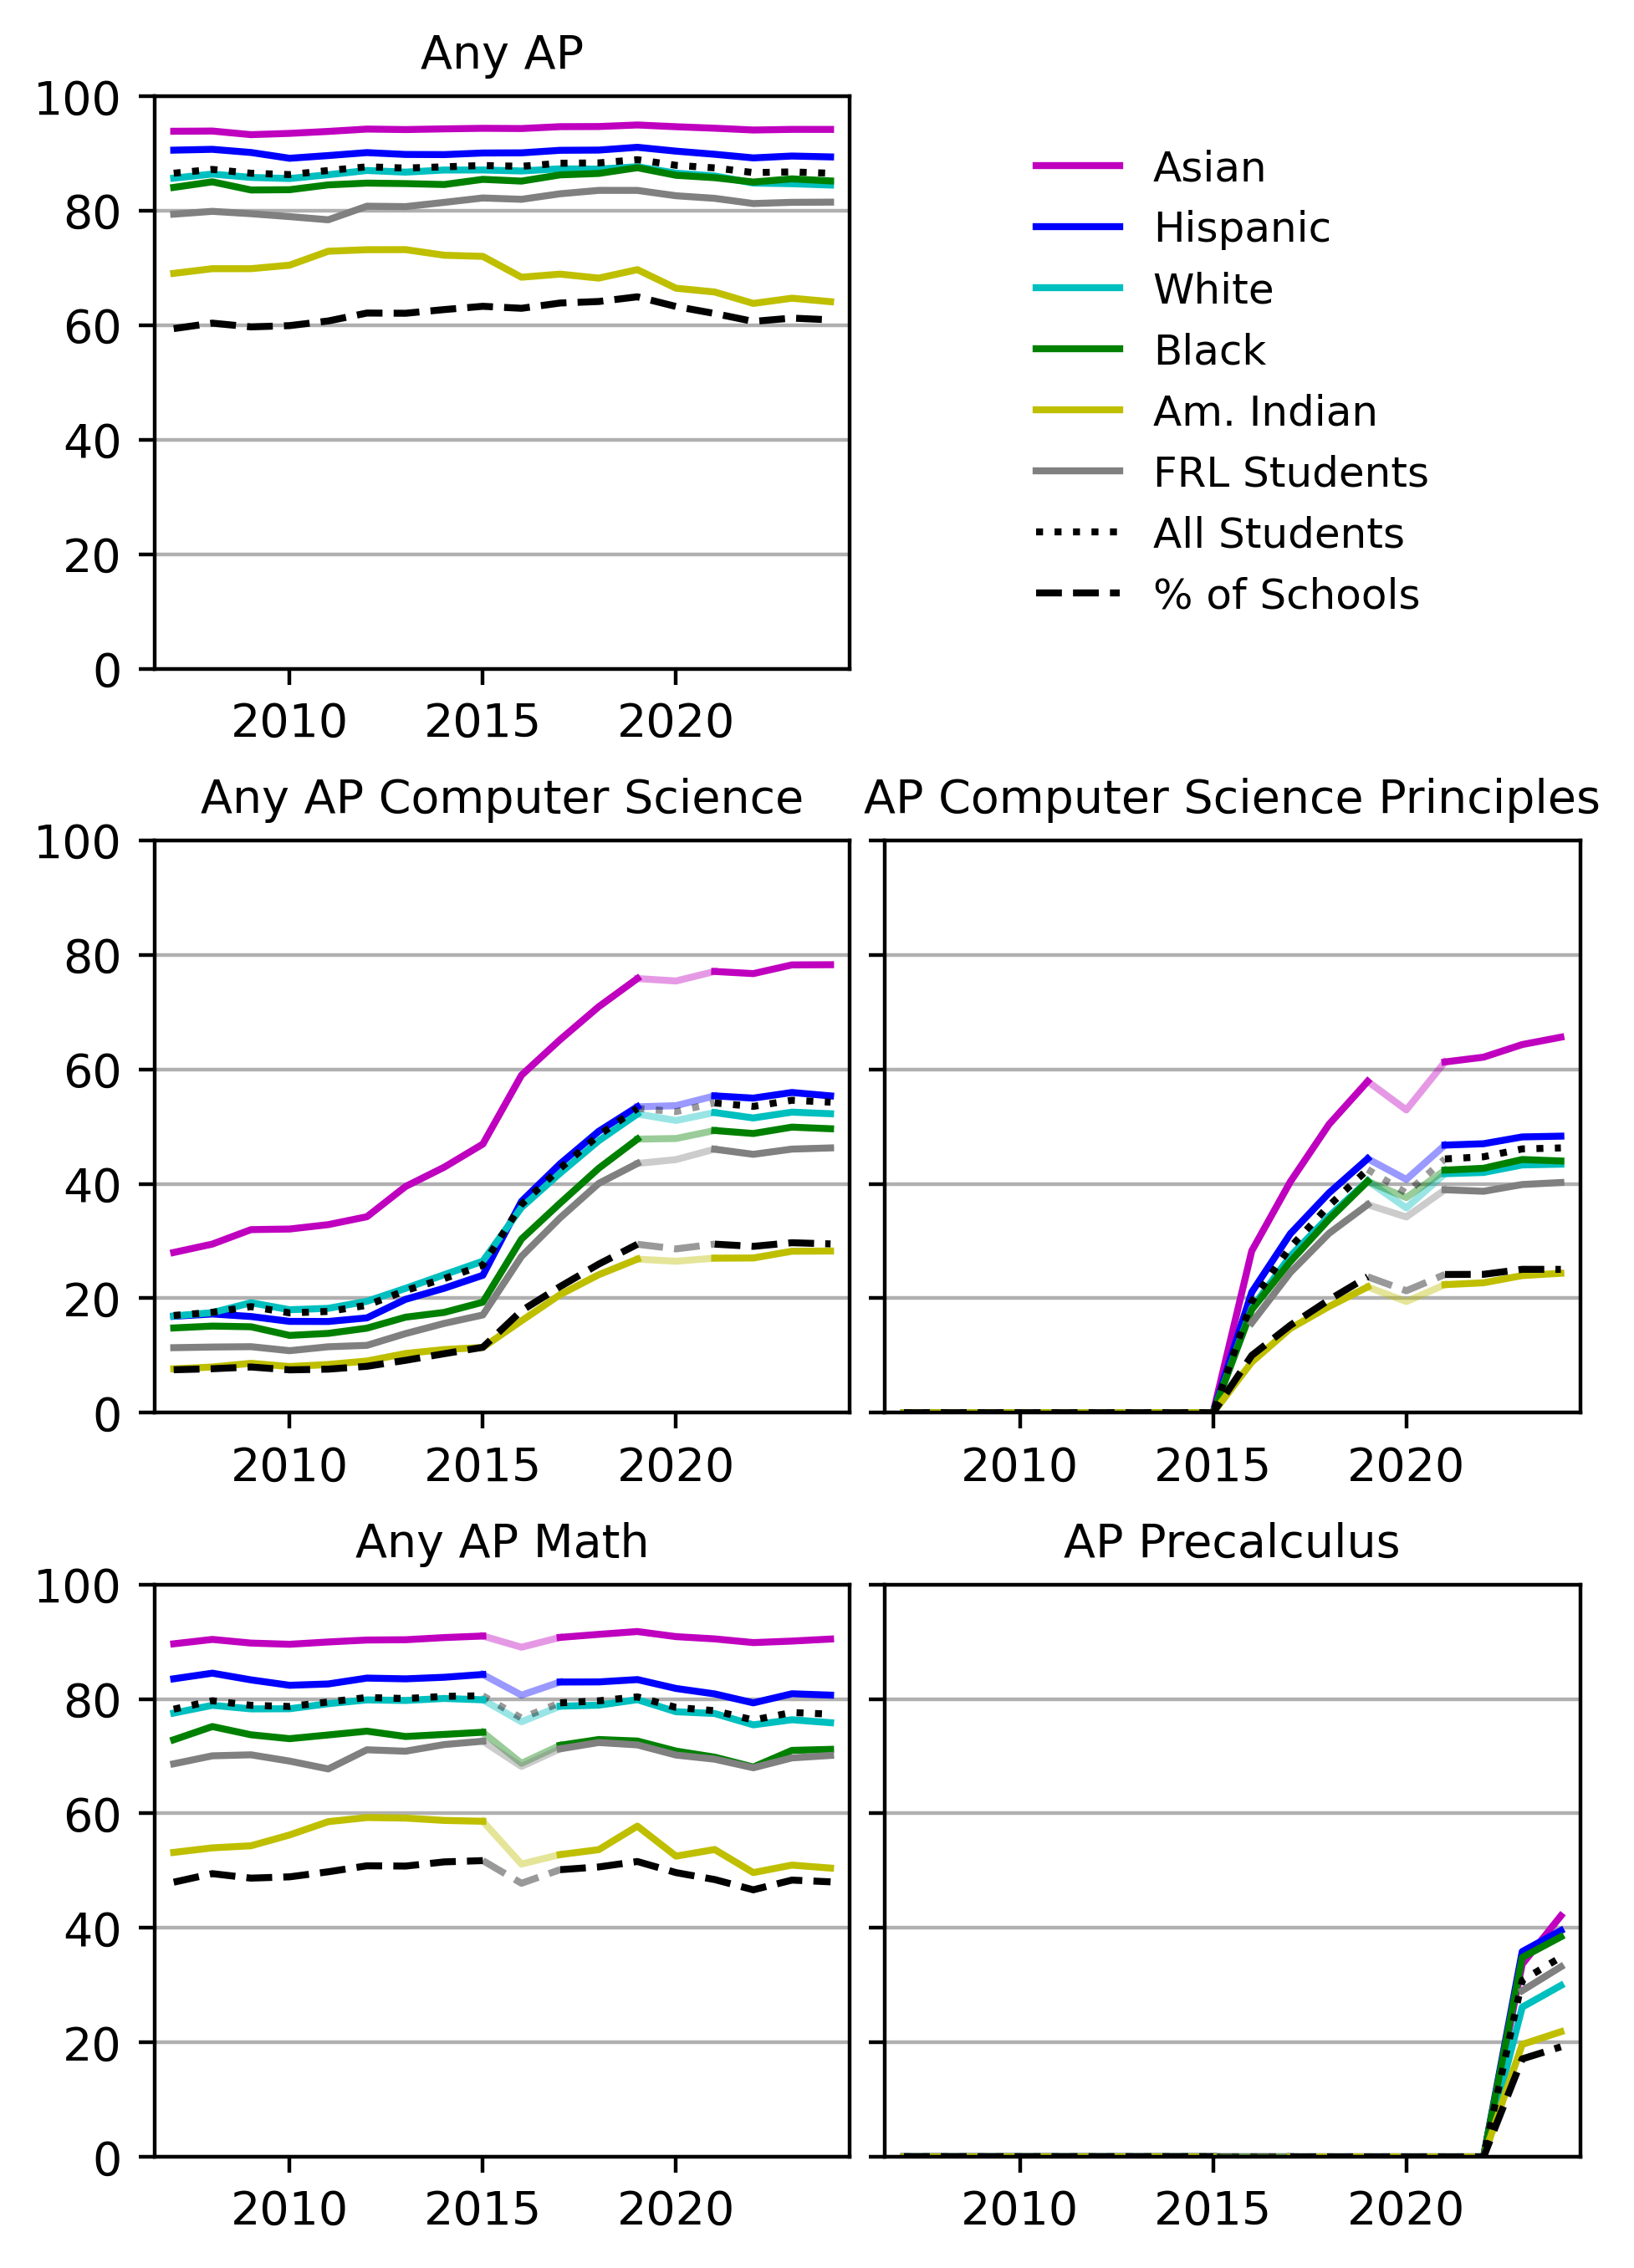
I filter the CCD data to 23,487 regular high schools that serve Grades 10-12, merging vertical composites and excluding horizontal sub-schools as well as alternative, special-education, vocational, and virtual schools. These schools enroll a total of 252 million Grade 9-12 students between 2007-08 and 2024-25. Using the crosswalk, which assigns a CB code to 86% of these schools covering 98% of the students, I join school demographic information from CCD with AP records. This allows me to calculate the portion of students nationally who have access to AP by subgroup or school characteristic, subject, and year.
Figure 1 shows patterns of access to CS and math AP over time. While overall AP and AP math access have remained flat over time, access to Precalculus, CS Principles, and CS in general have all grown dramatically. Across all subjects, Asian students have much higher AP access than average and Hispanic students somewhat higher. Meanwhile, poor, Black, and especially American Indian students are less likely to have AP access – except in Precalculus, which disproportionately reaches Black students. Additional results show that AP offerings are higher at larger, urban, and suburban schools. I also find that most of the schools that adopted AP math or CS in recent years used one of the two new courses as their “gateway” course.
effects of new courses on ap availability
Methods
I demonstrate the applicability of the joined national dataset to policy analysis by examining the effects of schools beginning to offer AP CS Principles or Precalculus. At the national level, I estimate the effects of the new courses on AP offerings across the curriculum. I use a quasi-experimental design that compares changes at treated schools (i.e., schools that take up one of the two new courses) to changes at similar untreated control schools. My primary method is synthetic difference-in-differences (SDID), which weights units and pre-treatment time periods to eliminate bias due to unobservable latent factors [1]. Because SDID requires a balanced panel, I narrow the sample to the 15,799 schools that report Grade 9-12 enrollment in each year between 2007-08 and 2024-25, for a total of 231 million. I verify model fit using event studies and find similar results when varying specifications, e.g. including covariates, using a shorter panel, or using CSDID estimators on the unbalanced panel [5].
Results
Table 1 shows that both new courses have a substantial effect in opening the door to AP STEM access. Effects are larger for higher-poverty, smaller, and rural schools. Effects are particularly large for CS Principles, which triples the portion of schools offering any AP CS relative to later-treated schools’ baseline. Additionally, offering CS Principles increases the chance of a school offering AP CS A, the pre-existing and more advanced, Java-focused AP course. Event study evidence shows that this growth comes primarily in the year after CS Principles is first offered, suggesting that CS Principles prepares schools to later build an extended CS pathway. By contrast, Precalculus has minimal impact on Calculus, neither substituting for nor expanding its offerings. However, it has greater effects on expanding AP math access at schools with more Black students.
AP CS Principles | AP Precalculus | |||
|---|---|---|---|---|
Outcome | Effect | Baseline | Effect | Baseline |
Any AP | 0.06*** | 0.93 | 0.05*** | 0.97 |
(0.01) | (0.01) | |||
Any AP Math or CS | 0.10*** | 0.84 | 0.10*** | 0.90 |
(0.01) | (0.01) | |||
Any AP CS | 0.50*** | 0.26 | 0.05*** | 0.59 |
(0.02) | (0.01) | |||
AP CS A | 0.13*** | 0.26 | 0.02*** | 0.39 |
(0.00) | (0.00) | |||
Any AP Math | 0.03*** | 0.84 | 0.12*** | 0.88 |
(0.01) | (0.01) | |||
Any AP Calculus | 0.03*** | 0.82 | 0.02*** | 0.84 |
(0.00) | (0.01) | |||
Schools | 15,799 | 15,799 | ||
Treated | 6,374 | 4,254 | ||
Notes: Estimated effects of offering new AP STEM courses on AP availability using a national balanced panel, 2007-08 to 2025-26. Baseline columns show the mean value among later-treated schools in the year before first treatment: 2015–16 for CS Principles, 2022–23 for Precalculus. Clustered bootstrap SEs in parentheses. *** p<0.01 | ||||
effects on student outcomes
Methods and Data
Next, I estimate the effect of a school offering the new courses on student outcomes. I extend my data linkage pipeline by further incorporating rich school-level outcome data made publicly available by the Massachusetts Department of Elementary and Secondary Education (DESE) for 2007-08 to 2024-25 [17]. Matching is enabled by state-level school identifiers provided in CCD. Outcomes include by-subject AP exam participation and (partially suppressed) performance records, as well as completion rates of MassCore, a set of college-ready course requirements used for University of Massachusetts admission [24]. All outcomes are disaggregated by school, year, subject, and student subgroup. Critically, these outcomes are college-proximate: passing AP scores and MassCore completion are direct links to college admissions and credit earning.
I use a similar methodology to the national pipeline, using a balanced sample of 283 schools that appear in DESE data and have Grade 9-12 enrollment in each year.
Results
Preliminary results (Table 2) show the new courses substantially increase AP participation, each causing an annual increase of over 20 exams in the relevant subject area. Subgroup-specific results show that effects are particularly large relative to baseline for Black, Hispanic, and High Needs (e.g., low-income or English Learner) students, as well as female students for CS Principles. For these subgroups, CS Principles more than quintuples CS participation over time relative to baseline, and Precalculus expands math participation by over 70%.
Neither course clearly expands or substitutes for participation in the corresponding more advanced course. However, both courses have some positive effects on exam passing: Precalculus increases AP Calculus passing, suggesting that the course increases students’ mathematical preparation. Meanwhile, CS Principles triples a school’s probability of having at least 10 passing scores on AP CS exams, relative to a baseline of 13%. Additionally, AP CS Principles has a large and increasing effect on growing AP participation across the curriculum, while Precalculus seems to instead partially substitute for non-STEM AP courses. Both courses also seem to increase MassCore completion, although these results are not always robust against alternative specifications (e.g., shorter panels). I plan to investigate patterns of heterogeneity and alternative estimation methods, as well as techniques for handling suppressed data.
AP CS Principles | AP Precalculus | |||||
|---|---|---|---|---|---|---|
Outcome | Exam | Base | 10+ | Exam | Base | 10+ |
All AP | 51.7*** | 365 | -0.00 | 18.9* | 390 | -0.02 |
(15.2) | (0.02) | (10.3) | (0.02) | |||
All AP CS | 21.4*** | 7 | 0.25*** | -2.9 | 24 | 0.06 |
(2.1) | (0.03) | (2.6) | (0.04) | |||
AP CS A | 0.1 | 7 | 0.04* | -0.1 | 7 | 0.01 |
(0.8) | (0.02) | (0.7) | (0.03) | |||
All AP Math | 5.0* | 64 | 0.02 | 26.8*** | 55 | 0.21*** |
(2.9) | (0.03) | (3.6) | (0.06) | |||
All AP Calculus | 3.3 | 37 | 0.01 | -2.5* | 29 | 0.10** |
(2.2) | (0.03) | (1.4) | (0.04) | |||
MassCore Finishers | 16.2** | 179 | 24.0*** | 187 | ||
(6.3) | (8.5) | |||||
Schools | 283 | 283 | ||||
Treated | 184 | 88 | ||||
Notes: Estimated effects of offering new AP STEM courses on student outcomes using a Massachusetts balanced panel, 2007-08 to 2025-26. MassCore starts in 2008-09 and uses a smaller subsample of 266 schools which have reported values in all years. The measure of exam passing is binary - i.e., at least 10 students earned a 3, 4, or 5 – to avoid small-count data suppressions. Baseline columns show the mean value among later-treated schools in the year before first treatment: 2015–16 for CS Principles, 2022–23 for Precalculus. Clustered bootstrap SEs in parentheses. | ||||||
conclusions
In this paper, I demonstrate a process for using LLMs to build replicable, validated linkage pipelines across large, public administrative educational datasets. A similar process would allow discovery of connections across additional education domains [12].
Using the pipeline, I construct a novel dataset covering AP offerings at nearly all U.S. regular public high schools from 2007-08 to the present. I use this dataset, as well as rich student outcome data from Massachusetts, to examine the effects of two new courses: AP CS Principles and AP Precalculus. Using causal methods, I show that both courses have had large effects in expanding and broadening AP math and CS access and participation, helping build a diverse STEM pipeline for the future.
The results also suggest the power of a new opportunity in shifting school culture towards advanced learning in CS and other subjects. CS Principles was explicitly designed to broaden participation in computing as a large NSF-funded initiative including teacher training, extensive partner-led curriculum development, and a creative project component in assessment [9]. My results suggest that when schools introduce it, they do more than register students for the course: they build a pipeline to offering more advanced CS learning opportunities in the future, bring in previously underrepresented groups, grow AP participation across the curriculum, shift to becoming schools with high AP CS pass counts, and encourage completion of a college-ready curriculum.
AP Precalculus may yet achieve similar effects. I hope that the crosswalk, AI-assisted methodology, and compiled contextualized, granular administrative data that I share through this project will help researchers in studying the effects of this policy and other large-scale educational interventions.
ACKNOWLEDGMENTS
REFERENCES
- Arkhangelsky, D., Athey, S., Hirshberg, D. A., Imbens, G. W., and Wager, S. 2021. Synthetic difference-in-differences. Amer. Econ. Rev. 111, 12, 4088–4118. DOI=https://doi.org/10.1257/aer.20190159.
- Baker, R. S., Hutt, S., Brooks, C. A., Srivastava, N., and Mills, C. 2024. Open science and educational data mining: Which practices matter most? In Proceedings of the 17th International Conference on Educational Data Mining, 279–287. International Educational Data Mining Society.
- Botelho, A. F., Closser, A., Sales, A., Heffernan, N., and Vanacore, K. 2024. Causal inference in educational data mining. In Proceedings of the 17th International Conference on Educational Data Mining (EDM 2024 Tutorial).
- Brevard College. 2020. CEEB Lookup Master List. https://brevard.edu/wp-content/uploads/2020/08/ceeb-lookup-masterlist.pdf.
- Callaway, B. and Sant’Anna, P. H. C. 2021. Difference-in-differences with multiple time periods. J. Econometrics 225, 2, 200–230. DOI=https://doi.org/10.1016/j.jeconom.2020.12.001.
- Chatterji, R., Campbell, N., and Quirk, A. 2021. Closing Advanced Coursework Equity Gaps for All Students. Center for American Progress.
- College Board. 2025. AP Course Ledger. https://apcourseaudit.inflexion.org/ledger/ (accessed 2025).
- Colorado Department of Higher Education (CDHE). 2026. i3 Lookup Field Values — High School. https://highered.colorado.gov/Data/More/LookupTables.aspx?type=highschool (accessed 2026-03-04).
- Cuny, J. 2012. The CS10K project: Mobilizing the community to transform high school computing. ACM Inroads 3, 2, 32–36.
- Davenport, M. 2025. CEEB-NCES crosswalk. Presented at the 2025 NCAIR Conference. https://nc-air.org/2025-ncair-conference-presentations/.
- Ewing, M., Wyatt, J., Iarrapino, M., and Jacklin, A. 2025. AP Precalculus: Who Participated and What We Learned in Launch Year. College Board Research.
- Figlio, D., Karbownik, K., and Salvanes, K. 2017. The promise of administrative data in education research. Educ. Finance Policy 12, 2, 129–136. DOI=https://doi.org/10.1162/EDFP_a_00229.
- Ganelin, D. and Dee, T. S. 2025. New Advanced Placement course designed to broaden access promotes participation and demographic diversity in computer science education. Proc. Natl. Acad. Sci. 122, 17, e2422298122. DOI=https://doi.org/10.1073/pnas.2422298122.
- Goodman, J. 2019. The labor of division: Returns to compulsory high school math coursework. J. Labor Econ. 37, 4, 1141–1182. DOI=https://doi.org/10.1086/703135.
- Illinois Board of Higher Education (IBHE). 2022. ACT Code to RCDTS Code Crossref. https://www.ibhe.org/iheis.html (accessed 2026-03-04).
- Liu, J., Conrad, C., and Blazar, D. 2024. Computer science for all? The impact of high school computer science courses on college majors and earnings. EdWorkingPaper No. 24-904. Annenberg Institute at Brown University. DOI=https://doi.org/10.26300/z517-fw07.
- Massachusetts Department of Elementary and Secondary Education (DESE). 2025. Statewide Reports. https://profiles.doe.mass.edu/statereport/ (accessed 2025).
- Najarro, I. and Pendharkar, E. 2022. The case of the missing data on AP students. Education Week (Jul. 29, 2022).
- Narayan, A., Chami, I., Orr, L., and Ré, C. 2022. Can foundation models wrangle your data? Proc. VLDB Endow. 16, 4, 738–746. DOI=https://doi.org/10.14778/3574245.3574258.
- Office of Data Analytics, University of Colorado Boulder. 2023. CEEB-NCES Crosswalk. GitHub. https://github.com/UCBoulder/ceeb_nces_crosswalk.
- Shah, N. et al. 2025. Efficient record linkage in the age of large language models: The critical role of blocking. Algorithms 18, 11, 723. DOI=https://doi.org/10.3390/a18110723.
- U.S. Department of Education, National Center for Education Statistics. 2025. Common Core of Data (CCD), 2007–08 through 2024–25. https://nces.ed.gov/ccd/.
- U.S. Department of Education, Office for Civil Rights. 2024. 2021–22 Civil Rights Data Collection: A First Look.
- Voices for Academic Equity. 2024. All Over the Map: Massachusetts High School Graduation Requirements. MassCore Data Brief, Fall 2024.
- Wyatt, J., Feng, J., and Ewing, M. 2020. AP Computer Science Principles and the STEM and Computer Science Pipelines. College Board Research.
© 2026 Copyright is held by the author(s). This work is distributed under the Creative Commons Attribution-NonCommercial-NoDerivatives 4.0 International (CC BY-NC-ND 4.0) license.