ABSTRACT
This research explores the use of heat maps derived from eye- tracking data to identify cognitive strategies in mental rotation tasks. Traditional methods like eye-tracking metrics and interviews have limitations in capturing the full spectrum of strategy use. We propose heat maps as a novel methodology to bridge the gap between behavioral outputs and cognitive processes. Our preliminary findings demonstrate distinct heat map signatures for holistic and piecemeal strategies, validated through interview data. This work contributes to spatial cognition research by providing a more comprehensive framework for strategy classification and has implications for STEM education and cognitive assessment.
Keywords
INTRODUCTION
Cognitive strategies in mental rotation tasks have predominantly been studied using eye-tracking and interviews, which together capture attentional dynamics and subjective insights. Eye-tracking, pioneered by Just and Carpenter (1985) [1], distinguishes holistic strategies (faster, more integrated processing) from analytic ones (slower, more detailed processing), while interviews [2] reveal conscious preferences. Despite their utility, eye-tracking's fixation-based metrics overlook aggregated spatial gaze patterns, and interviews risk missing implicit strategies [3] [4].
Empirical research has largely relied on self-reports and statistical analyses of eye movements. While retrospective self-reports offer insights into participants' strategies, Hegarty (2010) [5] highlights that many individuals are unaware of the exact strategies they employ, providing post-hoc explanations that fail to reflect their actual mental processes. Furthermore, self-reports cannot capture the dynamic nature of strategy use, particularly in tasks involving multiple questions where accurate recall becomes challenging.
The eye-tracking literature has predominantly focused on statistical metrics, such as fixation count and duration [5], first fixation duration, saccade count and amplitude [4], strategy ratio [3] [6], gaze transitions, and scanpath analysis [1]. However, mental rotation's complex spatial demands and multistep processes suggest these measures may provide a limited view of underlying cognitive processes, potentially oversimplifying the nuanced strategies involved.
Mental rotation's visual-spatial demands align with methods that emphasize spatial attention distribution. Heat maps, visual aggregations of gaze density, could directly reveal strategy- specific attentional foci, as hypothesized by Just and Carpenter (1985) [1] and supported by scanpath studies [3]. In eye-tracking research, heat maps provide qualitative visualization of gaze distribution across areas of interest [7] [8]. Wooding (2002) [9] notes that fixation map analysis answers "Where in the image did people tend to look?" and offers an objective way to quantify eye- movement patterns, degree of coverage, and comparison between individual or group traces. Despite these advantages, heat maps remain confined to describing behavioral outputs rather than explaining cognitive processes, limiting their ability to illuminate why behaviors occur. Despite their utility, heat maps remain confined to describing behavioral outputs (error locations, interaction timelines) rather than explaining cognitive processes. Educational applications fail to connect error clusters to metacognitive struggles, gaming uses overlook decision-making heuristics behind spatial activity, and AI implementations prioritize machine attention over human cognition [5]. This disconnect limits their ability to illuminate why behaviors occur, whether from conceptual misunderstandings, strategy selection, or cognitive load, leaving their potential as tools for probing reasoning and problem-solving underexplored.
This study leverages heat maps to bridge the gap between mental rotation's spatial demands and traditional gaze metrics, offering a novel approach to decode strategy execution through spatially grounded attentional signatures. Such insights could pioneer new methodologies for studying cognition across domains where visual-spatial processing is central, from STEM education to clinical assessments of spatial reasoning deficits.
proposed contributions
Our overall aim is to develop a novel methodology that can definitively identify and examine different cognitive strategies employed during Mental Rotation Tasks (MRT). For this purpose, we propose to leverage heat map analysis as a visual data approach to investigate strategy use in MRT, addressing a significant gap in current literature where no studies have utilized such visual data to explore strategy differences. The heat map methodology would help us to analyze the spatial patterns of visual attention distribution and reveal strategy-specific attentional signatures as individuals transition through different cognitive processes during mental rotation. We will then evaluate the relationship between identified strategies and various interindividual and intraindividual differences in MRT performance. In future work, we will use this methodology to investigate the effectiveness, superiority, and flexibility of different strategies, contributing to the ongoing strategy debate where key questions remain unresolved. The visual data-based approach would be further utilized to examine how strategy use adapts to different task conditions and to unpack the intricacies involved in the mental rotation process.
Strategy investigation using heat maps
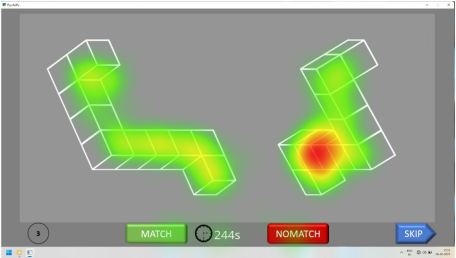
Our prior work [10] demonstrated that heat maps of gaze data can distinguish holistic and piecemeal strategies during mental rotation. Heat maps generated from participants employing a holistic strategy often displayed a pronounced focal point on one figure. This single dominant region of attention, marked by a concentrated area of high activation (red spot), suggests a primary attentional investment in mentally manipulating that specific stimulus. The intensity of focus within this region, signifies longer fixations, could imply that the actual mental rotation may be happening during that time while the eye remains stationary in that area.
Furthermore, the heat maps from the participants employing holistic strategy demonstrates the presence of a complimentary attentional distribution between the two figures. This tendency could be because of an attempt to create a mental representation of the whole object by absorbing information from both orientations. In other words, the whole object that the participant needs to have in mind to be able to rotate is being created from both orientations and not only either of the two.
For piecemeal heatmaps at least two distinct focal points were observed, indicating that as expected in piecemeal strategy, the figure was likely broken up into more than one part. More importantly, these focal points on each orientation are almost mirror images of each other (as opposed to the complementary relationship we saw in holistic). This suggests attention to equivalent points in the two representations, most likely to rotate those parts independent of the whole figure. This would be expected only in piecemeal rotations where the main object is broken in more than one parts and the parts are rotated individually.
In addition to the holistic and piecemeal strategies we also found evidence for other strategies from the heat map analysis. Although we haven’t included it in our preliminary analysis of strategy identification and heat map classification guidelines it is valuable to discuss the other strategies as well in order to reveal the potential of heat map to be used to study cognitive processes in MRT.
On the basis of the observed signatures from the preliminary analysis we were able to develop a set of heat map classification guideline:
- Holistic strategy heat map signature:
- Uneven distribution of attention between two figures, often appearing as a single dominant focus area in one figure.
- Complementary attentional distributions between both figures.
- Piecemeal strategy heat map signature:
- At least 2 disjoint focal points - indicating that the figure was broken up in at least two parts.
- Attention to equivalent points in the two figures, making heat maps appear as mirror images rather than complementary.
Theoretical contributions
By linking heat map patterns to established cognitive theories [11] [12], this research bridges the gap between behavioral visualization and cognitive process modeling. Key theoretical advances include:
- Strategy Taxonomy: A classification system for mental rotation strategies, validated through heat map signatures.
- Cognitive Load Dynamics: A model connecting temporal heat map shifts to metacognitive adaptation.
- Generalizability: Demonstrating how heat map-derived insights can be applied to other visual-spatial tasks in STEM education.
Methods and PRELIMINARY RESULTS
References and Citations
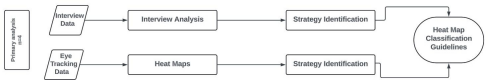
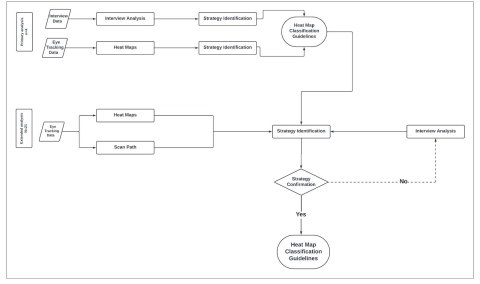
This study uses data collected as part of a larger study on spatial thinking and multimodal analytics [13]. The questions were modeled after the Peter and Battista library (2008) [14]. For the purpose of the initial analysis we have considered a subset of the main study and we have used 10 questions and 4 participants for our analysis. We have only considered those questions for which the participants got their responses correct, as we surmised that analyzing incorrect responses could lead to misleading patterns of strategy use. The methodology adopted for the analysis is shown in Figure 1.
Interview Analysis
The interview data were analyzed independently by two coders, achieving an inter-rater reliability greater than 90%. Any discrepancies were resolved by a third rater and a coding scheme based on previous research by Hegarty (2018) [15], was developed to identify holistic and piecemeal rotation strategies. For holistic rotation, we looked for keywords such as "rotate," "flip," "tilt," and "turn," and considered descriptions indicating that the participant mentally rotated the entire image while remaining stationary. Piecemeal rotation was identified through participants describing the process of breaking the image into parts to perform the rotation, without relying on a specific set of keywords. The interview analysis process is explained through Figure 2.
Although other strategies like local turn and cube counting were also identified, this analysis focused exclusively on holistic and piecemeal strategies. Only interviews explicitly stating the use of either holistic or piecemeal strategies were included in the analysis, ensuring a clear distinction between the two primary approaches.

Heat Map Analysis
Tobii X3 sensor at a sampling rate of 120 Hz integrated with iMotions was used to collect the eye-tracking data. The data were analyzed using the I-VT (Interval Velocity Threshold) filter. The I-VT filter identifies fixations and saccades based on velocity thresholds, allowing for precise analysis of gaze patterns. Heat maps were then generated from the eye-tracking data, utilizing fixation counts to visualize areas of interest. For static images, combining gaze positions over the observation period results in an informative static heat map. This approach can also be extended to dynamic stimuli, offering a summary of attention distribution across the visual scene [7].
Heat maps were then generated on our static stimuli with “red areas suggesting a high number of gaze points (and therefore an increased level of interest), and yellow and green areas showing fewer gaze points (and therefore a less engaged visual system. Areas without coloring were likely not attended to at all” (IMotions eye tracking manual). The heat maps were then examined to see if any pattern emerged for holistic or piecemeal, as coded during the interviews.
Initial Results
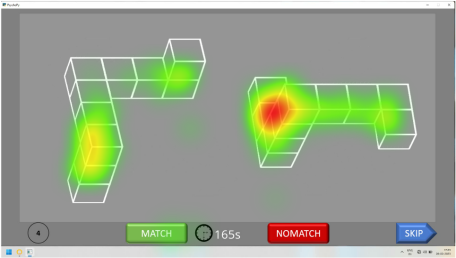
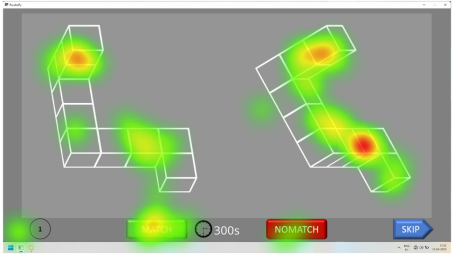
From the initial dataset (4 participants, 10 items each), we analyzed 30 items where participants recalled their strategies, discarding 10 with incorrect responses to avoid misleading patterns. The final 20 item-participant combinations yielded 10 holistic, 9 piecemeal, and 1 counting strategy through interview analysis. Examination of corresponding heat maps revealed distinctive patterns: Heat maps generated from participants employing a holistic strategy displayed a pronounced focus in one figure. This is often evident as a single red area, most commonly not disjointed but may be of irregular shape (Fig 5), often on only one of the two figures (Fig 3 and 4) with some exceptions such as Fig 5 where we might get more than one such area between the two figures. More generally, the total attention between the two figures (all colors) often seem to be lopsided with one figure getting more attention than the other, as in Fig 4. Interestingly, however, we see that the areas of similar levels of attention (same color) between the two figures, mostly yellow and green (Fig 3 and 4) but also when red as in Fig 5, do not appear in corresponding parts of the figure. In fact, the areas seem to be complementary to each other. For example, in Fig 4, the middle two blocks seem to be covered more in the right side representation, whereas the two extreme parts of three and two blocks were in focus on the left. Similarly, in Fig 3 note the locations of the high attention areas in red in the both representations together make up the complete object. They appear on non-corresponding parts of the representations.
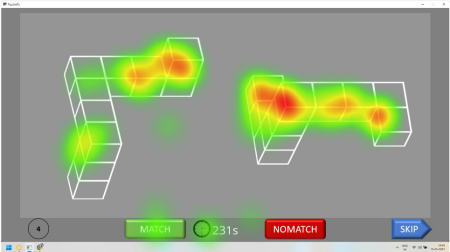
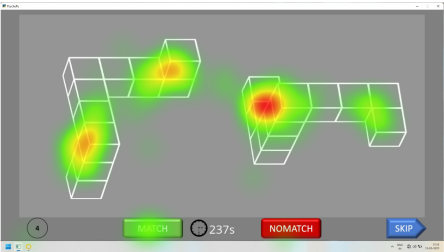
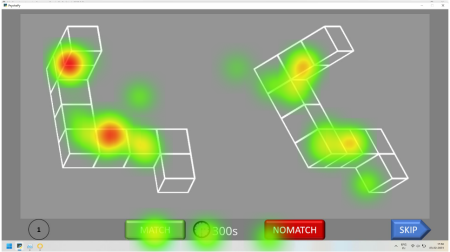
The heatmaps that were coded as piecemeal through the interviews reveal starkly different patterns. Most importantly, unlike the holistic heatmaps where we saw lopsided attention distribution between the two figures, the attention seems to be evenly distributed (Fig 7 and 8 but also Fig 6). Furthermore, the pattern in one figure seems to be a mirror-image of the other figure (Figs 6-8). Both of these are in stark contrast to what we observe for holistic items.
This analysis confirmed 8 holistic and 7 piecemeal strategies based on heat map characteristics, demonstrating alignment between participants' reported strategies and their visual attention patterns.
Current Work
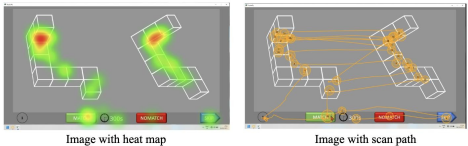
Although promising, heat maps have certain limitations, as they only offer a density-based visualization of time-varying trajectory data. Raschke, Blascheck & Burch, 2014 [16] mentioned that while heat maps effectively highlight areas where participants focused more frequently, they do not provide information about the order in which areas of interest (AOIs) or points of interest (POIs) were visited and are classified as time-aggregated diagrams. They also recommended that in contrast, scan paths provide insight into time-varying behavior by depicting individual movement patterns through line-based trajectories. Scanpaths are represented as sequences of connected dots, illustrating raw gaze points (x, y, t), or a selected subset of points that meet the criteria for being classified as fixations - periods of relative stability in eye movement [17]. While heatmaps provide insights into visual attention over an aggregated time period, scan paths offer information on how visual attention is distributed and moves throughout the time frame. To address the limitations of heat maps as time-aggregated visualizations, we analyzed scan paths to gain insights into time-varying behavior. This added confidence to our heat map findings. An example is shown in Figure 9.
We have extended our analysis to the larger dataset [13] and analysed 100 items from 21 participants to validate our heat map classification guidelines. The methodology for this analysis is shown in Figure 10. This analysis revealed more nuanced findings, including the importance of "precision" in piecemeal strategy use and "uneven distribution" in holistic strategy use. We are preparing these findings for publication.
We also plan to investigate the effect of other variables viz. time pressure and domain expertise (Architecture and Design) on strategy use with our heat map classification guidelines. This will help validate the guidelines and also reveal how these variables influence strategy selection in mental rotation tasks.
Advice sought
For this doctoral consortium, we would like advice regarding the following topics:
- How can we enhance the validity and reliability of heat map-based strategy classification?
- How might this methodology generalize to other visuospatial tasks or populations (e.g., architecture or design students) and enable scalability?
- What machine learning frameworks could automate strategy detection while preserving interpretability for educational applications?
REFERENCES
- Just, M. A., and Carpenter, P. A. 1985. Cognitive coordinate systems: accounts of mental rotation and individual differences in spatial ability. Psychological review, 92(2), 137.
- Kozhevnikov, M., Hegarty, M., & Mayer, R. E. (2002). Revising the Visualizer-Verbalizer Dimension: Evidence for Two Types of Visualizers. Cognition and Instruction, 20(1), 47–77.
- Nazareth, A., Killick, R., Dick, A. S., & Pruden, S. M. (2019). Strategy selection versus flexibility: Using eye- trackers to investigate strategy use during mental rotation. Journal of Experimental Psychology: Learning, Memory, and Cognition, 45(2), 232.
- Moen, K. C., Beck, M. R., Saltzmann, S. M., Cowan, T. M., Burleigh, L. M., Butler, L. G., & Greening, S. G. (2020). Strengthening spatial reasoning: Elucidating the attentional and neural mechanisms associated with mental rotation skill development. Cognitive research: principles and implications, 5, 1-23.
- Khooshabeh, P. and Hegarty, M. (March 2010). Representations of shape during mental rotation. In AAAI Spring symposium: Cognitive shape processing, 15-20
- Zhang, G., Zhu, Z., Zhu, S., Liang, R., & Sun, G. (2022). Towards a better understanding of the role of visualization in online learning: A review. Visual Informatics, 6(4), 22-33
- Kurzhals, K., and Weiskopf, D. (2013). Space-time visual analytics of eye-tracking data for dynamic stimuli. IEEE Transactions on Visualization and Computer Graphics, 19(12), 2129-2138.
- Musabini, A., and Chetitah, M. (September 2020). Heatmap- based method for estimating drivers’ cognitive distraction. In 2020 IEEE 19th International Conference on Cognitive Informatics & Cognitive Computing (ICCI* CC),179-186.
- Wooding, D. S. (2002, March). Fixation maps: quantifying eye-movement traces. In Proceedings of the 2002 symposium on Eye tracking research & applications, 31-36.
- Khanikar, K. and Mitra, R. (2024). Investigating strategy in a mental rotation task using eye-tracking heat map analysis, In IADIS International Conference Cognition and Exploratory Learning in Digital Age, 175-182.
- Hegarty, M. and Waller, D. (2004). A dissociation between mental rotation and perspective-taking spatial abilities. Intelligence, 32(2), 175-191.
- Shepard, R. N. and Metzler, J. (1971). Mental rotation of three-dimensional objects. Science, 171(3972), 701-703
- T. S., A., Ranganath, S., Khanikar, K. et al. (2025). A Multisensor Dataset of South Asian Post-Graduate Students Working on Mental Rotation Tasks. Sci Data 12, 563. https://doi.org/10.1038/s41597-025-04865-5
- Peters, M. & Battista, C. (2008). Applications of mental rotation figures of the shepard and metzler type and description of a mental rotation stimulus library. Brain and Cognition 66, 260–264.
- Hegarty, M. (2018). Ability and sex differences in spatial thinking: What does the mental rotation test really measure?. Psychon Bull Rev 25, 1212–1219. https://doi.org/10.3758/s13423-017-1347-z
- Raschke, M., Blascheck, T., & Burch, M. (2014). Visual analysis of eye tracking data. Handbook of human centric visualization, 391-409.
- Duchowski, A. T., Price, M. M., Meyer, M., & Orero, P. (March 2012). Aggregate gaze visualization with real-time heatmaps. In Proceedings of the symposium on eye tracking research and applications, 13-20.
© 2025 Copyright is held by the author(s). This work is distributed under the Creative Commons Attribution-NonCommercial-NoDerivatives 4.0 International (CC BY-NC-ND 4.0) license.