ABSTRACT
Prompting students to generate constructed responses as they read provides a window into the processes and strategies that they use to make sense of complex text. In this study, Markov models examined the extent to which (1) patterns of strategies and (2) strategy combinations could be used to inform computational models of students’ text comprehension. Random Walk models further revealed how consistency in strategy use over time was related to comprehension performance. High school (n = 257) and college students (n = 153) produced constructed responses at predetermined points while reading a scientific text. Each constructed response was scored for the presence of three common comprehension strategies (i.e., paraphrasing, bridging, elaborating), such that each constructed response could then be categorized as one of eight combination types. Markov chains revealed that more and less successful comprehenders leveraged different comprehension strategies, such that skilled comprehenders were more likely to use combinations of strategies while reading the text, particularly paraphrasing and making connections between ideas within the text (i.e., bridging). Random Walk analysis further demonstrated that successful comprehenders employed strategies more consistently. The results demonstrate the utility of Markov and Random Walk models in profiling learners' strategy use based on their constructed responses.
Keywords
INTRODUCTION
Reading is a fundamental life skill, whether one is trying to read a novel, a science textbook in a university course, a technical document for work, or an instruction manual for assembling furniture. However, many students struggle to comprehend texts. For example, 30% of U.S. students perform below basic proficiency in reading comprehension [24]. Several factors contribute to successful comprehension. To understand texts, particularly texts with complicated syntax or unfamiliar topics, readers engage in a variety of processes and strategies, including paraphrasing, bridging, and elaborating. When students paraphrase, they put the text in their own words. By contrast, bridging and elaborating require the generation of inferences that contain information that is not explicit in the text. Bridging refers to connecting ideas and information from different parts of the text. Bridging has been shown to be one of the most effective strategies for reading comprehension, particularly if the bridges connect more distant areas of text [18]. Elaborating is expanding on what one has learned from the text with one’s prior knowledge about the topic.
Using bridging and elaborative inferences strategies has been found to improve comprehension on standardized reading tests [14]. More skilled readers are more likely to engage in more complex comprehension strategies, such as bridging and elaboration, that help them comprehend the text, while less skilled readers are more likely to rely on paraphrasing [7]. One way to encourage students to engage in such strategies is to ask them to self-explain a text as they read. Self-explanation prompts help students think deeper about the text, which facilitates strategy use and improves comprehension [25].
The strategies participants use while reading are typically examined via constructed response protocols (CRs). In CRs, students report their processes during a learning task. One method of obtaining CRs is asking participants to self-explain a text at specific points, and to type out these explanations. Prior work has shown that expert raters can reliably identify different comprehension strategies within CRs [17] and recent advances in natural language processing (NLP) have allowed researchers to develop and refine algorithms that can match these human judgments [4, 15]. Thus, mining readers’ CRs can serve as a powerful tool to generate high quality learner models based on students’ differing strategy use. The current study uses hand-coded CRs to examine participants’ dynamic strategy use.
Several intelligent tutoring systems (ITSs) have been developed to enhance students’ use of effective reading strategies. For example, iSTART [21] provides students with self-explanation reading training using a combination of instruction and practice via lesson videos, mini-games and reading practice. Training students on effective self-explanation reading strategies has been demonstrated to improve students’ text comprehension [20]. ITSs such as iSTART rely on the automated identification of different reading strategies in CRs to drive feedback to students on their self-explanations or other reading behaviors. The feedback may re-direct students to lessons on strategy use or provide recommendations of other strategies to leverage while reading. In order to better train students to modify their strategy use in ways that enhance reading comprehension, it is beneficial to understand the different ways students use strategies to engage with texts.
Past research more commonly examines paraphrasing, bridging, and elaboration strategies as independent variables or outcomes and measures strategy use in terms of their overall frequency of use [15, 23]. However, some types of strategy combinations may be more effective in promoting reading comprehension than using any one strategy in isolation. One possibility is that paraphrasing, by creating a more complete understanding of the most recently read text, facilitates the use of further strategies such as bridging and elaboration. The current study therefore examines combinations of strategy use within CRs, rather than overall frequencies of paraphrasing, bridging, and elaborating. Additionally, traditional analyses of CRs rely on an overall proportion or score across an entire text. This approach ignores the moment-to-moment changes in processing that occur as properties of texts change across sentences and paragraphs [22].
Our Approach
The current study aims to use two approaches that are more common in other areas to examine dynamic patterns in strategy use: Markov Chains and Random Walk analyses. These analyses are intended to reveal systematic differences in the ways that more and less successful comprehenders engage with texts. That is, the combinations and patterns of strategy use in students’ CRs will vary in relation to their performance on a text comprehension assessment. More specifically, we predict that readers who more successfully comprehend a text will be marked by more frequent use of effective comprehension strategies, such as bridging and elaboration, and in particular, the use of combinations of strategies, such as para-bridging (i.e., combining paraphrasing and bridging within one CR). This prediction naturally stems from successful readers knowing how to use more strategies and use them in various contexts. Successful readers will also show a tendency towards certain types of switches, rather than randomly switching between strategies. Less successful comprehenders will be more likely to use strategies in isolation, especially paraphrasing, and will show less consistency in their strategy use patterns.
Markov chains are used to simulate processes with patterns that can be imprecisely predicted through probabilities [10]. In such processes, the probability of a given outcome depends on the previous outcome. For this study, the outcomes are different types of strategies, and the probability of using a strategy in a self-explanation depends on the strategy that was used in the previous self-explanation. The probabilities are determined based upon previously collected data and then displayed in a Markov chain visualization. Markov chains have been used in studies of mastery of ending letter sounds [12], and student knowledge and learning have been modeled using hidden Markov models in Bayesian Knowledge Tracing [6, 26, 29]. By contrast, Markov chains have not been widely explored as a method of studying comprehension processes in CRs. Cohesive features that help text comprehension, such as cues about causality, time, and space, are not always uniformly distributed within text; readers need to be sensitive to these features and adjust their strategy use accordingly to successfully comprehend a text [22]. Successful comprehenders are likely to be strategic in their uses of comprehension processes, meaning they match their strategy use to the text [8]. Their strategy use is likely to be more structured, with consistent patterns in the types of switches that occur between strategies. Using Markov chains provides a learning analytic technique with strong potential to reveal students’ flexibility in comprehension strategy use, as well as how those dynamic processes differ as a function of text comprehension performance.
To show the consistency of pattern use over time for individual participants, the current study uses random walk models, which are a type of sequential pattern analysis tool. They provide a spatial representation of an individual’s path taken over time [2]. Such representations have commonly been used in the field of ecology, such as modeling animal migration patterns [3]. The movements of red deer are modeled on a graph with an x- and y-axis; every movement of the deer is plotted as a movement on the graph. Random walks have been used for a variety of other purposes, including decision making [9] and numerical cognition [5]. Using CRs allows us to code participants’ strategy use and in turn, random walk models afford examining the consistency of students’ strategy use over time.
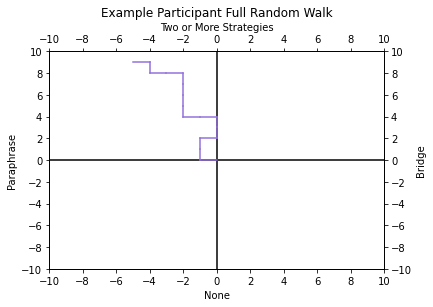
Participants’ random walks all start at (0, 0) on a graph. Four types of strategy use are defined as four different directions on the graph. Each CR counts as one step of the walk and moves one unit in a direction, based on the strategy used. The end point of each student’s walk is plotted on a graph. Participants with more consistent strategy use have end points farther from the origin, while participants who frequently switch their strategy use have end points closer to the origin. Students who have more structured strategy use are likely to have some consistencies in the types of strategies they use, such as relying on paraphrasing and bridging. Inconsistent strategy use could indicate participants are not creating thoughtful explanations or using strategic choices for text comprehension. Their random walks may display multiple switches in strategy use and/or reliance on ineffective strategies. Random walk models offer additional information compared to Markov chains by showing the consistency of strategy use for individual participants, rather than the aggregated switching tendencies displayed by a Markov chain. Additionally, the random walk model is designed to show each participants’ overall consistency over time, while Markov chains show probabilities of switching for each individual strategy.
The current study uses two extant datasets to help determine the generalizability of the research findings. Dataset 1 included 2322 CRs from 257 high school students (158 female; mean age = 17.58) [16]. Dataset 2 included 2448 CRs generated by 153 undergraduates. We predict that the results will be similar across datasets, but that the older, likely more skilled readers, in Dataset 2 would show more frequent use of effective strategies, more frequent use of combinations of strategies, and greater consistency of strategy use, compared to participants in Dataset 1.
Method
Datasets
In Dataset 1, participants read one of two texts, “Heart Disease” or “Red Blood Cells”. Participants were asked to provide self-explanations at nine points in their assigned text. Both texts contain about 300 words and use scientific terminology suitable for the age of the participants. They have been validated in prior studies and matched for linguistic difficulty. In Dataset 2, participants read a text called “Cell Division”, containing about 600 words, and were asked to self-explain the text at 16 different points. In both datasets, participants completed comprehension questions about the text after reading. Performance on these questions serves as the dependent variable, which reflects students’ comprehension success.
Expert Rating of Strategy Use
Verbal protocols were scored by expert raters using a self-explanation rubric that assesses the presence or absence of three reading strategies: paraphrase, bridging, and elaboration [17]. Paraphrase presence was scored based on the inclusion of idea units from the most recently read sentence. Bridging presence was scored based on the inclusion of references to other parts of the text. Elaboration presence was scored based on the inclusion of words or ideas that elaborate on the text but were not directly present in the text. Since paraphrase, bridging, and elaboration were scored independent of one another, the presence of any one strategy could be observed on its own or in combination with any of the other two strategies. Then, responses were categorized as containing one of eight strategy combination types, based on the presence of individual strategies: “None”, “Paraphrase” (paraphrasing in isolation), “Bridge” (bridging in isolation), “Elaboration” (elaborating in isolation), “Para-bridge” (paraphrasing and bridging in combination), “Para-elab” (paraphrasing and elaborating in combination), “Bridge-elab” (bridging and elaborating in combination), and “All” (paraphrasing, bridging, and elaborating in combination). These categories did not include the order in which strategies were used within a single response, as the strategies were sometimes intermixed within a single response. For example, a “para-bridge” response means that paraphrasing and bridging were both used, but not in any particular order.
Scoring training was deemed complete when raters reached sufficient reliability for each coding category (weighted kappa ≥ 0.71). CRs were divided between pairs of raters such that each scored 60% of participant protocols, with 20% of participant protocols being scored by both raters. To calculate inter-rater reliability, protocols scored by both expert raters were compared per dataset, per text, and per coding category on a regular basis up to the latest point where both raters had scored the same protocols. Expert raters discussed coding disagreements to reach a consensus on the score. Following discussions, each rater independently reviewed and rescored as needed their entire set of protocols. Once raters completed scoring for a given text, scores were finalized only after raters achieved 0.71 or above weighted kappa per coding category.
Data Analysis
In both datasets, participants were divided into two groups based on the median performance (50%) in the text comprehension test. In Dataset 1, the low comprehension group included 117 participants, and the high comprehension group included 118 participants. In Dataset 2 (median = 50%), each group included 72 participants; 9 participants who scored on the median were excluded. The code used to create the Markov chains and the Random Walk displays can be found at https://github.com/kchristhilf/Markov-Chains.
Markov chains were used to examine the dynamic nature of students’ strategy use, as well as the overall frequency of different strategies. For each chain, we calculated the frequency of each type of strategy switch from one CR to the next. For instance, if a participant used paraphrasing in one CR and used para-bridging in the following submission, we added “1” to the overall frequency of switching from paraphrasing to para-bridging. The frequency of switches from a strategy were divided by the total number of switches from that strategy overall to calculate the probability of switching from one strategy to the next. We also calculated the number of times each strategy was used overall.
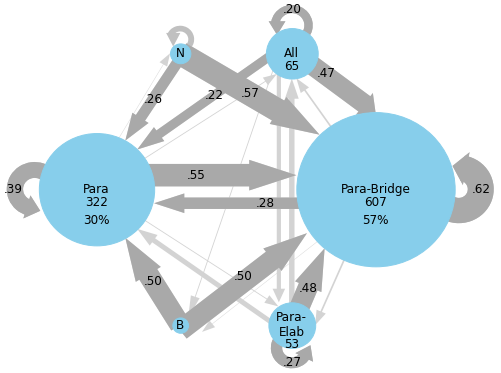
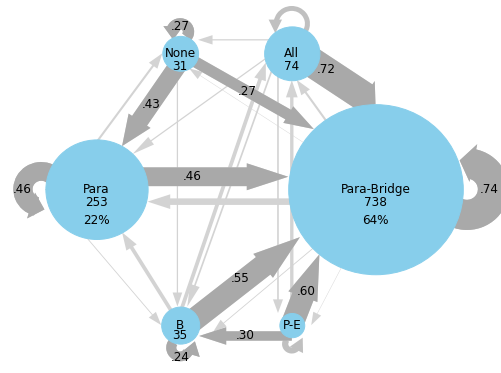
These calculations were visibly represented in Markov chain diagrams created using ‘Matplotlib’ in Python (see Figures 2 and 3). Nodes were created to represent each strategy that was used more than five times. The area of the node was scaled relative to the overall number of times that strategy was used. The probability of switching from one strategy to another was represented by arrows between nodes. Wider arrows indicate a higher probability of switching from the origin node to the end node. Strategy use frequencies and transition probabilities are labeled when possible.
To examine consistency of strategy use over time, the current study uses random walk visualizations. As there are several possible “strategy moves” that a reader can make, we opted to simplify the analysis to four choices for visibility. Strategy use per trial was defined as using no strategies, paraphrasing in isolation, bridging in isolation, or two or more strategies in combination. The two or more strategies grouping includes para-bridging, para-elaborating, and para-bridge-elaborating. Each of these strategy combinations are an example of supplementing paraphrasing with one or more strategies, so we chose to combine them into a single group. For every participant’s Random Walk analysis, each CR is coded as one “strategy move”, and each strategy move is associated with a one unit movement in a specified direction. “No strategies” means one step down on the y-axis, “paraphrasing” means one step left on the x-axis, “bridging” means one step right on the x-axis, and “two or more strategies” means on step up on the y-axis. A single participants’ full random walk is shown in Figure 1. The visualization shows that the participant primarily used paraphrasing or two or more strategies as their walk remains in the upper left quadrant. The student sometimes switched between different strategy types as shown by the relative distance away from the origin. In Figures 4 and 5, just the endpoints of each participant’s walk were plotted onto a graph with an origin of (0, 0). For each random walk visualization, the participants’ endpoint of the walk was graphed as a dot with 30% visibility, so that endpoints with more participants are darker. The graphs were created in Python using Matplotlib.
Results
Markov Chains
Elaboration in isolation and the combination of bridging and elaboration were not included as nodes in the Markov chains because participants used those strategies fewer than five times for each chain. The six strategies that are represented in the Markov chains are no recorded strategies (labeled “None” or "N"), paraphrasing (“Para”), bridging (“Bridge” or “B”), paraphrasing and bridging in combination (“Para-Bridge”), paraphrasing and elaborating in combination (“Para-Elab” or “P-E”), and paraphrasing, bridging, and elaborating in combination (“All”).
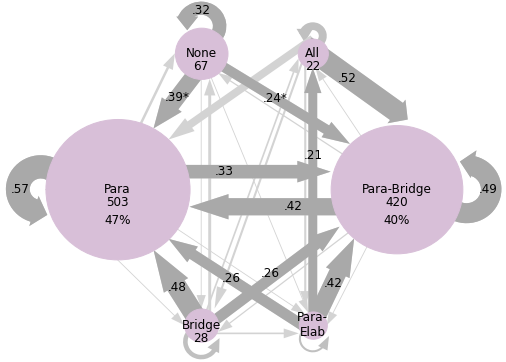
The variation in strategy use comparing more and less successful high school readers (Dataset 1) is shown in Figure 2. The low-comprehension group had high probabilities (>40%) for the following transitions: paraphrase to paraphrase (57%), bridge to paraphrase (48%), para-bridge to paraphrase (42%), para-bridge to para-bridge (49%), and all to para-bridge (52%). The high-comprehension group had high probabilities for none to para-bridge (57%), paraphrase to para-bridge (55%), para-bridge to para-bridge (62%), para-elab to para-bridge (48%), and all to para-bridge (47%). The low comprehension group tended to paraphrase (n=503 instances) more than para-bridge (n=420). Paraphrasing was the only strategy students were more likely to continue using than to switch from. Participants were also more likely to use none of the analyzed strategies (n=67) than all three (n=22). Meanwhile, the high comprehension group used more para-bridging (n=607) than paraphrasing (n=322), as shown in Figure 2. Para-bridging was the only strategy students were more likely to continue using than to switch from. Students in the high comprehension group were more likely to use a combination of all three strategies (n=65) than no strategies (n=10). They were also more likely to switch to using para-bridging than the low comprehension group, even when their previous response used no strategies. Participants in the high comprehension group were more likely to use para-elaboration as a strategy than the low comprehension group (n=19, n=52). These results suggest paraphrasing is used by most readers. However, readers who are more successful at comprehending texts supplement paraphrasing with other strategies, particularly through para-bridging but also through para-elaborating and para-bridge-elaborating.
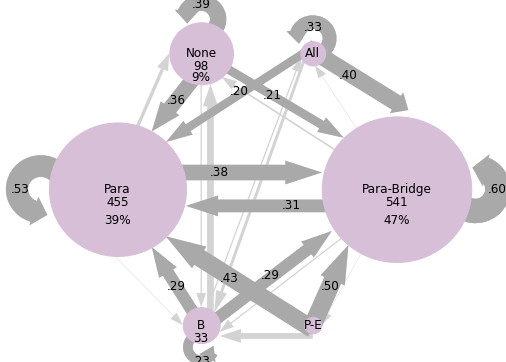
As predicted, the college students in Dataset 2 showed similar trends, as shown in Figure 3. The low-comprehension group had high probabilities (>40%) for the following transitions: paraphrase to paraphrase (53%), para-bridge to para-bridge (60%), para-elab to para-bridge (50%), para-elab to paraphrase (43%), and all to para-bridge (40%). Participants in the low comprehension group were more likely to use none of the analyzed strategies (n=98) than all three (n=15). Less successful comprehenders used paraphrasing in isolation more frequently than more successful comprehenders. In the high comprehension group, more distinct trends emerge. Most of the high probability switch types involve para-bridging: the most common switches were none to paraphrase (43%), paraphrase to paraphrase (46%), paraphrase to para-bridge (46%), bridge to para-bridge (55%), para-bridge to para-bridge (74%), para-elab to para-bridge (60%), and all to para-bridge (72%). They were more likely to use a combination of all three strategies (n=63) than no strategies (n=30). Participants in the high comprehension group, compared to the low comprehension group, used more para-bridging (n=738, n=541) and were more likely to continue para-bridging from the previous CR (74% vs 60%). When paraphrasing in isolation, they were equally likely to switch to para-bridging as to continue paraphrasing in isolation (46%), compared to the low comprehension group that was more likely to continue paraphrasing in isolation (53%). More successful comprehenders seem to rely on the combination of paraphrasing and bridging. This suggests that the combination of paraphrasing and bridging is generally the most effective aid to comprehension, compared to other examined strategy combinations.
Overall, participants tended to not switch between using no strategies or paraphrasing and using all strategies. Participants were much more likely to switch from using a single strategy to two strategies or vice versa. Participants with high comprehension were more likely to switch between using one to three strategies, while participants with low comprehension were more likely to switch from using between zero to two strategies.
The two datasets have some differences from each other, likely due to the differences in age and education between the two groups. In Dataset 2, both groups were more likely to para-bridge than to paraphrase, while in Dataset 1, the low comprehension group was less likely to use para-bridging than paraphrasing. In both datasets, participants tended to continue to use the same strategy rather than switching. As para-bridging seems to be the more useful strategy in text comprehension, students in Dataset 2 may be more skilled, which can be expected given that they are university students, rather than high school students. The differences in strategy use between datasets may also be due to differences in the difficulty of the text used, as participants in Dataset 2 read a more complicated text, potentially requiring strategic processing to a greater extent.
One potential argument against examining participants’ probabilities of switching between strategies is that switching is solely dependent on overall strategy use. For instance, one might argue that participants frequently switch to para-bridging because that strategy is used commonly in general. A series of chi-square analyses were conducted to determine if transitions were random (solely dependent on base frequencies of strategy use), or if there were meaningful trends in switching. Chi-squares were conducted for each switch type grouping (all switches from none, all switches from paraphrasing, etc.). Only transition types with an expected value of 5 or more were calculated (all ps < .05). In Dataset 1, for the low comprehension group 4 out of 6 chi-squares were significant; for the high comprehension group 3 out of 4 were significant. In Dataset 2, 3 out of 5 chi-squares in the low comprehension group and 4 out of 5 chi-squares in the high comprehension group were significant.
Random Walk
In Dataset 1 (Figure 4), each participant had 9 steps, leading to a maximum distance of 9 from the origin if the same strategy was repeatedly used. In Dataset 2 (Figure 5), each participant had 16 steps. Good comprehenders are shown in blue, while poorer comprehenders are shown in pink.
For Dataset 1, visual inspection reveals a broad pattern of readers ending in the upper right quadrant, replicating the findings from the Markov chains analyses such that readers tend to use paraphrase and para-bridge most commonly. Participants who comprehended the text less successfully showed less consistency in their strategy use than other participants, as shown in Figure 5 by the endpoints that are closer towards the origin. They were more likely to have switched to using bridging or no strategies. Those who were more successful consistently used paraphrasing or a combination of strategies. For Dataset 2, participants in the low comprehension group showed less consistency in their strategy use, compared to the high comprehension group. Low comprehension group participants were more likely to use no strategies and bridging compared to participants in the high comprehension group. Both groups showed a tendency towards using paraphrasing and using two or more strategies in combination. Dataset 2 has considerably more variability than Dataset 1. This may be due to the higher number of response opportunities compared to Dataset 1 (16 vs 9). Participants in Dataset 2 may have needed to use a greater variety of strategies to understand the more difficult text, or they may have experienced more fatigue towards the end of the task.
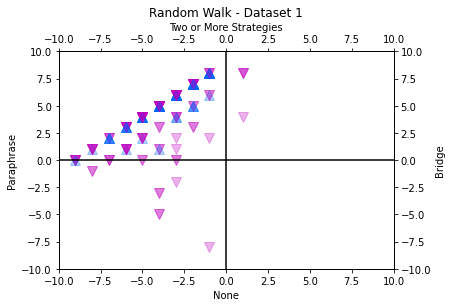
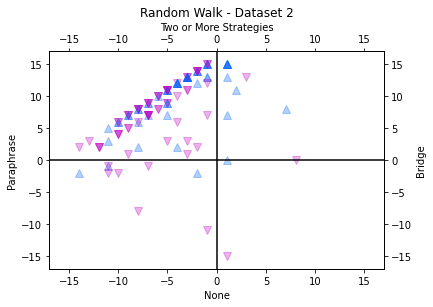
To quantify these Random walks, we calculated average Euclidean distance. Euclidean distance represents the distance of each step from the origin. It is used as a quantitative measure of the consistency of participants' strategy use. Pearson product-moment correlation tests showed that Euclidean distance was significantly correlated with comprehension score (Dataset 1, n = 256, r = .292, p < .001; Dataset 2, n = 153, r = .293, p < .001). This suggests that readers who were more consistent in their strategy use (as reflected by greater distance from the origin) had better overall comprehension success.
Discussion
Discourse comprehension researchers commonly examine overall frequencies of different types of strategies, rather than the dynamics of strategy use. The current study applied Markov chains, a methodology previously used in EDM, and Random Walk analysis, a methodology used in other domains, to better understand the dynaics of strategy use in reading comprehension. These data analytic techniques yielded qualitative evidence that more successful comprehenders engaged in markedly different strategy use patterns than their less-successful peers. For instance, Markov chains showed that high text comprehension performance was associated with use of multiple strategies, as well as switching to and from para-bridging. Poorer text comprehension was associated with using strategies in isolation, such as paraphrasing and bridging, and less structure in switching between strategies. Random walk analysis illustrated that students who are less successful in text comprehension are less consistent in their strategy use. They switch between using strategies in isolation, and at times use no strategies at all. On the other hand, more successful comprehenders rely on using paraphrasing and combinations of strategies that include paraphrasing, and they rarely switch to using solely bridging or no strategies. Understanding the dynamics of strategy use has been elusive [8], and so these types of analytic tools provide new insights about strategy use and how it differs across readers. These analyses show that solely examining the types of strategies used within constructed responses neglects the ways in which patterns of strategy use differ among readers.
Our results suggest that examining combinations of strategies may be useful for gaining a more complete picture of students’ strategy use. Markov chains and Random Walk models show that readers who are comprehending texts successfully use multiple strategies while reading. They are frequently using multiple strategies within a single CR of a small section of text. Prior studies have shown that skilled readers are more likely to bridge than less-skilled readers. Examining combinations of strategies demonstrates that successful readers are not foregoing paraphrasing for better comprehension; they continue to ground their understanding of the text in paraphrasing, and frequently use other strategies to deepen comprehension. Because bridging is connecting information from different parts of the text, it contributes to a more coherent understanding of the text. However, it is difficult to connect different parts of text without a solid understanding of each of the individual parts. When the syntax, vocabulary, or concepts in a sentence are difficult, it may be challenging to build a mental representation of the sentence without paraphrasing it. This mental representation must be constructed prior to higher-order strategies such as bridging and elaborating. The results suggest that models of student strategy use should include the combinations of strategies students use, not just the individual types of strategies.
One limitation of the work is that some analyses relied on a median split. While such an approach is common for exploring differences between more and less successful comprehenders [11, 19], this dichotomy can mask within-group differences. There may also exist more than two types of patterns in strategy use. Future research should use a more nuanced approach to determining differences in strategy use and how they relate to reading comprehension. For example, we are currently exploring approaches such as k-means clustering [26] to identify profiles of readers' use of combinations of strategies and transitions between strategies.
Similarly, the chi-square analyses used to assess the Markov chains are limited in their interpretability. Such tests show that there are differences in patterns, but not the full nature of those patterns. We are exploring approaches such as lag sequential analysis [8, 27], which could be conducted for the transitions that are embedded within the chi-square tests. However, this inherently comprises 10 to 16 transition types to test for significance, which potentially inflates Type I errors. Future work should thus leverage the current results to determine in advance the most common transition types to assess using lag-sequential analysis.
Finally, our analysis focuses on differences across comprehension of a specific text, rather than on relatively stable individual differences (e.g., reading skill). Future work should explore how readers' individual differences in comprehension-related factors such as reading skill [15], prior knowledge [28], and motivation [1] relate to strategy use and strategy patterns, and the extent to which strategy use on a given text influences text comprehension beyond general reading skill (as measured by an outside assessment, such as the Gates-MacGinitie Reading Test [13]). Further studies should also consider extending this work to other populations, such as second language learners and struggling readers.
The current study relies on human judgements of strategy use, which are formed through retroactive analysis of data. Researchers are in the process of refining NLP-driven algorithms that can detect these strategies during reading. The current work suggests the possibility of combining these detectors with Markov models and Random Walk analysis as a means of providing real-time stealth assessment of student learning and just-in-time support. These analyses can be used to create different profiles of learners and determine the types of strategy use that are most helpful to comprehension. These profiles could include the types of strategies used and the number of times users switch between different strategies. Once these profiles are established, real-time analysis of students’ strategy use within their typed responses in an automated system can be leveraged to augment feedback. For example, if a student were demonstrating ineffective strategy patterns, an adaptive learning environment (or an instructor using a teacher interface) could intervene and encourage revising the self-explanation or scaffolding to help the student to use more effective strategies. Combining these data mining approaches with adaptive feedback would allow teachers to provide high-quality, real-time individualized instruction that can help a greater number and variety of students to become more successful comprehenders.
ACKNOWLEDGMENTS
We are grateful to Bryce Badaruddin, Kathryn Fleddermann, Emily Goblirsch, Elizabeth Kenney, Melanie Knezevic, Jacob Snyder, and Melissa Vasquez for their help in coding the constructed responses for strategy use. The research reported here was supported by the Institute of Education Sciences, U.S. Department of Education, through Grant R305A190063 to Arizona State University. The opinions expressed are those of the authors and do not represent views of the Institute or the U.S. Department of Education.
REFERENCES
- Ahmadi, M. 2017. The Impact of Motivation on Reading Comprehension. International Journal of Research in English Education, 2 (Mar. 2017), 1-7. DOI= http://dx.doi.org/10.18869/acadpub.ijree.2.1.1
- Benhamou, S., and Bovet, P. 1989. How animals use their environment: a new look at kinesis. Animal Behavior, 38, 3 (Sep. 1989), 375-383. DOI= https://doi.org/10.1016/S0003-3472(89)80030-2
- Berthelot, G., Saïd, S., & Bansaye, V. 2021. A random walk model that accounts for space occupation and movements of a large herbivore. Scientific Reports, 11 (Jul. 2021), 14061. DOI= https://doi.org/10.1038/s41598-021-93387-2
- Cai, Z., Graesser, A., Forsyth, C., Burkett, C., Millis, K., Wallace, P. Halpern, D., & Butler, H. 2011. Trialog in ARIES: User Input Assessment in an Intelligent Tutoring System. In Proceedings of the 3rd IEEE International Conference on Intelligent Computing and Intelligent Systems. IEEE Press, 429-433. DOI= http://dx.doi.org/10.13140/2.1.4284.5446
- Cohen, D. J. & Quinlan, P. T. 2016. How numbers mean: Comparing random walk models of numerical cognition varying both encoding processes and underlying quantity representations. Cognitive Psychology, 91 (Dec. 2016), 63-81. DOI= https://doi.org/10.1016/j.cogpsych.2016.10.002
- Corbett, A. T. & Anderson, J. R. 1995. Knowledge Tracing: Modeling the Acquisition of Procedural Knowledge. User Modeling and User-Adapted Interaction, 4 (Dec. 1994), 253-278. DOI= https://doi.org/10.1007/BF01099821
- Coté, N., Goldman, S. R., & Saul, E. U. 1998. Students making sense of informational text: Relations between processing and representation. Discourse Processes, 25, 1, 1–53. DOI= https://doi.org/10.1080/01638539809545019
- Cromley, J. G. & Wills, T. W. 2016. Flexible strategy use by students who learn much versus little from text: transitions within think-aloud protocols. Journal of Research in Reading, 39, 1 (Feb. 2016), 50-71. DOI= https://doi.org/10.1111/1467-9817.12026
- Farrell, S. & Lewandowsky, S. 2010. Computational Models as Aids to Better Reasoning in Psychology. Current Directions in Psychological Science, 19, 5 (Oct. 2010), 329-335. DOI= https://doi.org/10.1177/0963721410386677
- Geyer, C. J. 1992. Practical Markov Chain Monte Carlo. Statistical Science, 7, 4 (Nov. 1992), 473-483. DOI= https://www.jstor.org/stable/2246094
- Goldman, S. R., Braasch, J. L. G., Wiley, J., Graesser, A. C., & Brodowinska, K. 2012. Comprehending and learning from internet sources: Processing patterns of better and poorer learners. Reading Research Quarterly, 47, 4, 356–381.
- Kaplan, D. 2008. An overview of Markov chain methods for the study of stage-sequential developmental processes. Developmental Psychology, 44, 2 (Mar. 2008), 457–467. DOI= https://doi.org/10.1037/0012-1649.44.2.457
- MacGinitie, W. H., & MacGinitie, R. K. 1989. Gates–MacGinitie Reading Test (3rd ed.). Itasca, IL: Riverside.
- Magliano, J. P., Higgs, K., Santuzzi, A., Tonks, S. M., O’Reilly, T., Sabatini, J., Feller, D., Kopatich, R. D., Ray, M., & Parker, C. 2020. Testing the inference-mediation hypothesis in a post-secondary context. Contemporary Educational Psychology, 61 (Apr. 2020), 101867. DOI= https://doi.org/10.1016/j.cedpsych.2020.101867
- Magliano, J. P., Millis, K. K., The RSAT Development Team, Levinstein, I., Boonthum, C. 2010. Assessing comprehension during reading with the Reading Strategy Assessment Tool (RSAT). Metacognition and Learning, 6 (Dec. 2010), 131-154. DOI= https://doi.org/10.1007/s11409-010-9064-2
- McCarthy, K. S., Likens, A. D., Johnson, A.M., Guerrero, T. A., & McNamara, D. S. 2018. Metacognitive Overload!: Positive and Negative Effects of Metacognitive Prompts in an Intelligent Tutoring System. International Journal of Artificial Intelligence in Education, 28 (Feb. 2018), 420–438. DOI= https://doi.org/10.1007/s40593-018-0164-5
- McCarthy, K. S., Magliano, J. P., Snyder, J. O., Kenney, E. A., Newton, N. N., Perret, C. A., Knezevic, M., Allen, L. K., & McNamara, D. S. 2021. Quantified qualitative analysis: Rubric development and inter-rater reliability as iterative design. In 15th International Conference of the Learning Sciences (Bochum, Germany, June 2021). ICLS ’21, 139-146. International Society of the Learning Sciences. URL= https://repository.isls.org//handle/1/7458
- McCrudden, M. T., Huynh, L., Lyu, B., & Kulikowich, J. M. 2021. Bridging Inferences and Learning from Multiple Complementary Texts. Discourse Processes, 58, 5-6 (May 2021), 529-548. DOI= https://doi.org/10.1080/0163853X.2021.1924586
- McMaster, K. L., van den Broek, P., Espin, C. A., White, M. J., Rapp, D. N., Kendeou, P., Bohn-Gettler, C. M., Carlson, S. Making the right connections: Differential effects of reading intervention for subgroups of comprehenders. Learning and Individual Differences, 22, 1 (Feb. 2012), 100-111. https://doi.org/10.1016/j.lindif.2011.11.017
- McNamara, D. S. 2017. Self-Explanation and Reading Strategy Training (SERT) Improves Low-Knowledge Students’ Science Course Performance. Discourse Processes, 54, 7, 479-492. https://doi.org/10.1080/0163853X.2015.1101328
- McNamara, D. S., Levinstein, I., & Boonthum, C. 2004. iSTART: Interactive Strategy Training for active reading and thinking. Behavior Research Methods, Instruments, & Computers, 36 (May 2004), 223-233. DOI= https://doi.org/10.3758/BF03195567
- McNamara, D. S., & Magliano, J. 2009. Toward a comprehensive model of comprehension. Psychology of Learning and Motivation, 51, 297–384. DOI= https://doi.org/10.1016/S0079-7421(09)51009-2
- Munoz, B., Magliano, J. P, Sheridan, R., & McNamara, D. S. 2006. Typing versus think-aloud when reading: Implications for computer-based assessment and training tools. Behavior Research Methods, 38, 2 (May 2006), 211-217. DOI= https://doi.org/10.3758/BF03192771
- National Assessment of Educational Progress. 2019. NAEP report card: 2019 NAEP reading assessment. U.S. Department of Education, Institute of Education Sciences. URL= https://www.nationsreportcard.gov/highlights/reading/2019/
- Neubrand, C. & Harms, U. 2017. Tackling the difficulties in learning evolution: effects of adaptive self-explanation prompts. Journal of Biological Education, 51, 4, 336-348. DOI= https://doi.org/10.1080/00219266.2016.1233129
- Nguyen, H., Hou, X., Stamper, J. & McLaren, B. 2020. Moving beyond Test Scores: Analyzing the Effectiveness of a Digital Learning Game through Learning Analytics. In Proceedings of the 13th International Conference on Educational Data Mining (Online, Jul. 10-13, 2020). EDM ‘20. Anna N. Rafferty, Jacob Whitehill, Cristobal Romero, Violetta Cavalli-Sforza (eds), 487-495. URL= https://educationaldatamining.org/edm2020
- Pohl, M., Wallner, G., Kriglstein, S. 2016. Using lag-sequential analysis for understanding interaction sequences in visualizations. International Journal of Human-Computer Studies, 96 (Dec. 2016), 54-66. DOI= https://doi.org/10.1016/j.ijhcs.2016.07.006
- Williams, J. J. & Lombrozo, T. 2010. Explanation constrains learning, and prior knowledge constrains explanation. In Proceedings of the 32nd Annual Conference of the Cognitive Science Society. Cognitive Science Society.
- Williamson, K., and Kizilcec, R. 2021. Effects of Algorithmic Transparency in Bayesian Knowledge Tracing on Trust and Perceived Accuracy. In Proceedings of the 13th International Conference on Educational Data Mining (Paris, France, Jul. 10-13, 2020). EDM ‘20. Anna N. Rafferty, Jacob Whitehill, Cristobal Romero, Violetta Cavalli-Sforza (eds), 338-344. URL= https://educationaldatamining.org/edm2021
© 2022 Copyright is held by the author(s). This work is distributed under the Creative Commons Attribution-NonCommercial-NoDerivatives 4.0 International (CC BY-NC-ND 4.0) license.