ABSTRACT
Doing assignments is a very important part of learning. Students’ assignment submission time provides valuable information on study attitudes and habits which strongly correlate with academic performance. However, the number of assignments and their submission deadlines vary among university courses, making it hard to use assignment submission time as a feature to predict academic performance. In this paper, we propose a new method called Relative Assignment Submission Time (RAST) which uses the assignment submission information of peer students to improve the correlation with course grades. Experiments on real-life data of 20 courses show that RAST has a high correlation with students’ academic performance. We also build a machine learning model using RAST as a feature to detect students who would suffer from poor grades. Our method outperforms the traditional method by up to 61% on f1-score. We believe that our proposed method can help other studies on assignment submission time to improve the prediction accuracy on academic performance and detecting at-risk students.
Keywords
1. INTRODUCTION
Doing assignments is a traditional method of testing the quality of students’ learning and consolidating what they have learned. Typically, instructors assign some exercises or projects to students at the end of a class, and then in most cases students are required to submit their assignments by a certain deadline. Many studies have shown that there is a strong correlation between assignment completion and academic performance in the corresponding courses [7, 20, 21]. Some studies also show that the time when students start doing assignments can also reflect students’ learning psychology [1]. Generally speaking, the time when students start doing assignments is related to students’ procrastination psychology. If a student suffers from serious procrastination, the student is likely to choose to start doing assignments close to the deadlines, which could result in late or poor-quality submissions. A meta-analysis [11] on 33 studies confirms that procrastination is negatively correlated with academic performance.
Many studies have demonstrated the impact of students’ assignment behavior (including time spent on assignments, help-seeking behavior, etc.) on academic performance in online learning environments [7, 20, 21]. In most offline learning environments, however, it is hard to know exactly when students start working on their assignments, how they work out the solution, and how much time they spend on the assignments, etc. The difference between online and offline settings makes the methodologies in many studies limited to online teaching platforms only. In most offline learning environments, the only data on assignment behavior is the submission time.
Different from other continuous learning behavior data such as class attendance, assignment submission time could have distinctive implications before and after the corresponding deadline. In most learning environments, late submissions of assignments receive penalties on grading, which makes the deadline a watershed on student behavior. The straightforward way of using the difference between submission time and its deadline cannot capture all the information of submission time. In this paper, we propose an approach to process late and normal submissions separately while still using submission time data as a single continuous fashion, so that the new variable can be easily integrated into machine learning prediction methods that require continuous features.
The popularity of Learning Management Systems (LMS) makes it possible to collect data and study multiple courses at the same time; however, it is still challenging to apply analysis on submission time data from multiple courses. Most studies in the literature focus on using the data from one course only. The key issue is that cross-course data analysis is fundamentally different across different courses. The numbers of assignments in different courses are different. More assignments usually mean less time to work out the solution, so that it is hard to analyze the submission time of different courses together. Furthermore, the difficulty levels of assignments may vary a lot. Even with the same number of assignments, courses with difficult assignments may have larger numbers of late submissions. Students of course A with difficult assignments may tend to submit assignments closer to the deadlines than other students, but this does not necessarily mean that students of A are more procrastinating. Inspired by a recent study [5] that compares attendance rates using peer attendance data, this study proposes a new indicator on assignment submission time that incorporates peer information so that submission time data from multiple courses can be compared and used in a machine learning model. So far as we know, there is no previous study that applies peer information on assignment submission time.
In this paper, we propose a new indicator called Relative Assignment Submission Time (RAST), which reflects the average distance between a student’s assignment submission time and the corresponding deadline, while using peer assignment submission information to eliminate differences in time limits and difficulty levels of assignments. Our approach treats late and normal submissions in different groups but computes the new indicator as a single continuous variable, so that it can be easily applied to most machine learning methods as a prediction feature. We investigate the correlation between RAST and academic performance on real-life data from 5679 samples of 20 courses, showing that there is a high Pearson correlation between RAST and course grades. We also use RAST and other commonly available features to build models to detect at-risk students. Using the data from the first half of the semester, our method outperforms the traditional method by up to 61% on f1-score. We believe that our method can help other studies on assignment submission time to improve the prediction accuracy on academic performance and detecting at-risk students.
The rest of the paper is organized as follows. Section 2 discusses related work. Section 3 describes the preliminary. Section 4 introduces the method we propose, including the definition of Relative Assignment Submission Time (RAST). Section 5 presents the experimental results on real-life data and the analysis of the experimental results. Section 6 discusses the limitations of this paper and the future work. Section 7 concludes the paper.
2. RELATED WORK
Assignments are very important to learning. With the development of online education over the last decade, many platforms and methods have been proposed to help people collect and analyze students’ assignment information. Jivet et al. [10] designed a learning analytics dashboard for Coursera MOOCs which can record when learners submit assignments. Studies in [2, 25] used clickstream data (including submitting assignments) in online teaching platforms to analyze students’ behavior. [3] predicted the decrease of students’ engagement in typical MOOC tasks such as watching lecture videos or submitting assignments.
Many studies have shown a correlation between students’ assignment completion and procrastination. Studies in [19] analyzed student self-discipline by tracking student behavior including assignment submission. [17] comprehensively studied the relationship between students’ learning behaviors and procrastination. [1] proposed a new measure called Procrastination Index, which represents a learner’s degree of procrastination in the start time of doing assignments. [24] studied the relationship between procrastination and assignment deadlines. The authors showed that dependencies between students’ historical activities and the future ones provide meaningful interpretations in terms of students’ procrastination behaviors.
Many studies have analyzed the relationship between assignment and academic performance. [7] explored the effects of help-seeking behavior on learning assignments to academic performance. [20] analyzed the relation between consistency in students’ online work habits (including assignment submissions) and academic performance in a blended course. [21] confirmed the positive correlation between the time students spend on assignments and their academic performance.
An important topic in educational data mining is to identify and help at-risk students. Studies in [6] proposed a classifier to identify students at-risk for disengagement from coursework. [8] proposed a solution in the absence of data from previous courses to identify students at risk of failing the course. [13] developed a machine learning framework to conduct accurate at-risk student identification specialized in K-12 multimodal online environments. [15] identified at-risk students based on their behavior of handing in assignments on online platforms. Using features of attendance rate, grade retention and student profile, [23, 14] established early warning systems to identify at-risk students.
Recently, [4, 16, 12] studied the impact of assignment submission time on academic performance. [4] used students’ precise assignment submission time to identify at-risk students, but without introducing peer information from the classmates. The authors suggested that assignment submission time is not easy to predict at-risk students, as the relationship between submission time and marks varies depending on both the student and the assignment context. [16] studied patterns in assignment submission time. By building a machine learning model, the authors found that completion time performs better in predicting students’ assignment grades than quizzes and exam grades in a one-semester physics course with 1374 students. [12] applied the assignment submission time with temporal learning analytics to aid precision education. The authors analyzed the transitional patterns between successive assignments with Markov chains and the relationship between the patterns and the passes with association rules from 69 students.
[5] proposed a method called Relative Attendance Index to measure attendance rates, which reflects students’ efforts on attending courses. While traditional attendance focuses on the record of a single person or course, relative attendance emphasizes peer attendance information of relevant individuals or courses, making the comparisons of attendance more justified. However, the specific method of introducing peer information in this paper is different from our work.
None of the above studies applied peer information to study assignment submission time.
3. PRELIMINARY
Logistic regression is a statistical model that in its basic form uses a logistic function to model a binary dependent variable [22]. Given dataset , the loss function to minimize is the cross entropy loss function below.
(1)Sometimes, we will encounter the problem that the difference between the number of positive () and the number of negative () samples is too large. A simple way is to use the loss function in the “balanced” mode [18]. The “balanced” mode uses the values of to adjust weights in the loss function. In the “balanced” mode, the weight of will be given by and the weight of will be given by . In this paper, we will refer to the original method without adjusting the loss function as the “unbalanced” mode.
4. METHOD
To give the definition of Relative Assignment Submission Time (RAST), we need to define some quantities first.
How long a student can submit an assignment before the deadline is an indicator of study habits and attitude, we define it as Submission Buffer.
Definition 1 (Submission Buffer ): Given course and student , let be the deadline for submission of the th assignment of course ; let be the submission time of the th assignment of course for student . Then the Submission Buffer is defined as below.
(2)The average assignment submission time of a student in a course can be defined straight-forwardly.
Definition 2 (Average Submission Time ): Given course and student , let be the number of assignments in , then the Average Submission Time (AST) of and is defined as below.
(3)One drawback of AST is that it mixes the data of late submissions with normal submissions together. Late submission reflects the punctuality and study habits of the students. If a student has large submission buffers in some assignments, late submission information (even if it is a frequent pattern) will be buried in the average of submission buffers. Therefore, in our method we separate normal submissions and late submissions in the calculation of the new index.
Positive and negative submission buffers indicate normal and late submissions respectively.
Definition 3 (Normal Set and Late Set ) Given the definition of submission buffer , let be the set of students who registered for course , then normal set () and late set () represent normal and late submissions.
With the definitions of Normal Set and Late Set, we further define a notion called Submission Deviant to reflect how a submission is different from submissions of other students in the same course in terms of submission time. We process normal and late submissions in their own category to preserve the difference between late and on-time submissions. For an assignment submission, Submission Deviant is defined as the submission buffer divided by the largest submission buffer of the same category (late or on-time). The peer information of other students’ submission time helps normalizing the significance of a late or normal submission. For example, if a student submits an assignment early but not that early when compared with the best student in the class in terms of submission buffer (who has the earliest submission), the significance of this early submission is low; similarly, if a student submits an assignment late but not that late when compared with the worst student in the class, the significance of this late submission is also low. Formally, Submission Deviant is defined as below.
Definition 4 (Submission Deviant ): The Submission Deviant of the th assignment submission of student in course is defined by the formula below.
(4)By the definition, normal and late submissions have positive and negative submission deviants respectively.
Finally, Relative Assignment Submission Time (RAST) is defined as the average submission deviant over all assignments of a course for each student.
Definition 5 (Relative Assignment Submission Time ): Given course and student ,the Relative Assignment Submission Time (RAST) is defined as below.
(5)Relative Assignment Submission Time (RAST) reflects the average distance between a student’s assignment submission time and the corresponding deadline, while using peer assignment submission information to eliminate differences in time limits and difficulty levels of assignments. Compared with Relative Assignment Submission Time (RAST), Assignment Submission Time (AST) in Definition 2 does not consider peer assignment submission information.
Lemma 1: Given student in course and the Relative Assignment Submission Time , . Proof. The proof is straightforward. __
Students who are always submitting assignments before classmates (and ahead of the deadlines) will have an RAST of 1, while students who are always missing the deadlines and are the last one to submit assignments have an RAST of -1. The fixed range of provides the minimal and maximal values of RAST, which can make the data analysis more convenient.
| Course code | Course title |
|---|---|
| CSC1001 | Programming Methodology |
| CSC1002 | Computational Laboratory |
| CSC3001 | Discrete Mathematics |
| CSC3002 | Programming Paradigms |
| CSC4020 | Fundamentals of Machine Learning |
| EIE2050 | Digital Logic and Systems |
| ERG2050 | Introduction to Data Analytics |
| FIN2020 | Foundation of Finance |
| MAT2002 | Ordinary Differential Equations |
| MAT2007 | Elementary Real Analysis II |
| MAT2040 | Linear Algebra |
| MAT3007 | Optimization |
| MAT3040 | Advanced Linear Algebra |
| MAT3253 | Complex Variables |
| STA2001 | Probability and Statistics I |
| STA3010 | Regression Analysis |
| STA3020 | Statistical Inference |
| STA3100 | Advanced Statistics |
5. RESULTS
5.1 Datasets
The anonymous data used in this paper were collected from a university in China in the Fall 2020 semester and the Spring 2021 semester. Note that all data collection and usage in this project have been approved by the university management. To protect students’ privacy, all student IDs were encrypted and processed into hash codes, with other data related to a student being linked by the corresponding hash code. The data came from 20 undergraduate courses (15 in the Spring 2021 semester and 5 courses in the Fall 2020 semester). As shown in Table 1, these courses covered multiple topics on Computer Science (CSC), Math (MAT), and Statistics (STA). MAT2040 and MAT3007 were offered in both semesters. We collected the deadline for each assignment in a course and then the submission time of each assignment for each student from the LMS system “Blackboard”. In all the courses, students received letter grades from A to F at the end of the courses. The corresponding relationship between letter grades and numerical grades is shown in Table 2. The proportions of different grades in different courses were not exactly the same, but the differences were not very significant due to the grading quality control of the university. Many courses had the policy of not accepting submissions of 4 or more days late. For the simplicity of data reprocessing, we considered missing assignments as 3-day late. These samples only account for 4.2% of all the 5679 samples.
| Letter grade | A | A- | B+ | B | B- | C+ |
|---|---|---|---|---|---|---|
| Numerical grade | 4.0 | 3.7 | 3.3 | 3.0 | 2.7 | 2.3 |
| Letter grade | C | C- | D+ | D | D- | F |
| Numerical grade | 2.0 | 1.7 | 1.3 | 1.0 | 0.7 | 0 |
5.2 Correlation with Academic Performance
Many previous studies showed that assignment submission is correlated with academic performance. We calculated the Pearson correlation between students’ Relative Assignment Submission Time (RAST) and their course numeric grades across 20 courses. As a comparison, we also calculated the Pearson correlation between the corresponding Average Submission Time (AST) and the course numeric grades. The results are shown in Table 3 (sorted by the correlation coefficient of RAST). The second column of the table is the course enrollment number, the third column is the AST correlation coefficient, and the fourth column is the RAST correlation coefficient. The correlation coefficients between RAST and course grades are higher than that of AST across 18 courses. The p-values of all the correlation coefficients in Table 3 are all well below 0.005, which shows that the correlation coefficients are statistically significant [9].
| course | enrollment | AST | RAST |
|---|---|---|---|
| MAT3253 (21 spring) | 76 | 0.69 | 0.73 |
| MAT3007 (21 spring) | 150 | 0.71 | 0.73 |
| MAT2002 (21 spring) | 212 | 0.56 | 0.72 |
| CSC1001 (21 spring) | 1037 | 0.39 | 0.69 |
| CSC3001 (20 fall) | 301 | 0.47 | 0.67 |
| MAT2040 (20 fall) | 452 | 0.51 | 0.65 |
| MAT2040 (21 spring) | 184 | 0.59 | 0.63 |
| STA2001 (21 spring) | 818 | 0.53 | 0.62 |
| MAT2007 (21 spring) | 107 | 0.54 | 0.61 |
| CSC4020 (21 spring) | 103 | 0.45 | 0.60 |
| MAT3007 (20 fall) | 343 | 0.41 | 0.58 |
| CSC1002 (21 spring) | 930 | 0.38 | 0.57 |
| EIE2050 (20 fall) | 121 | 0.45 | 0.57 |
| CSC3002 (20 fall) | 151 | 0.32 | 0.54 |
| ERG2050 (21 spring) | 82 | 0.46 | 0.52 |
| STA3010 (21 spring) | 217 | 0.48 | 0.46 |
| STA3100 (21 spring) | 100 | 0.27 | 0.35 |
| STA3020 (21 spring) | 100 | 0.36 | 0.32 |
| FIN2020 (21 spring) | 157 | 0.25 | 0.29 |
| MAT3040 (21 spring) | 56 | 0.21 | 0.25 |
5.3 RAST Distribution
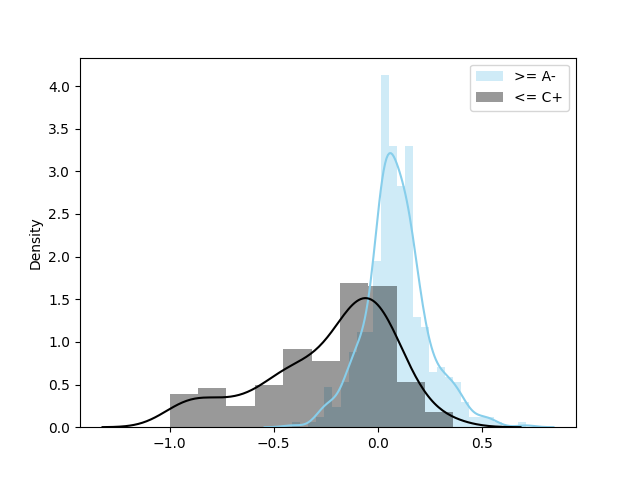
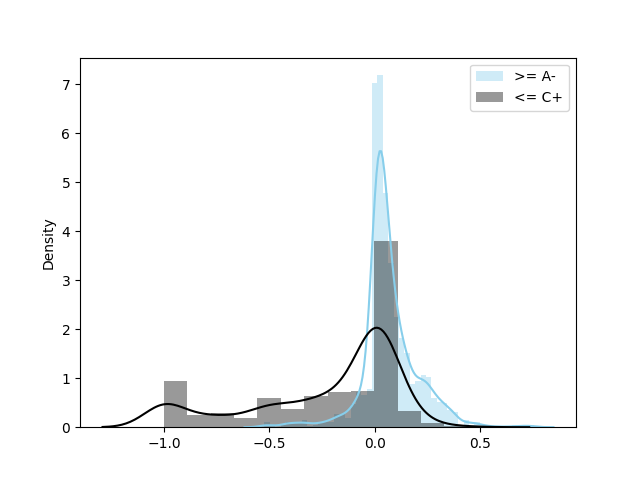
In order to show the different distributions on RAST of high and low course grade students, we selected two sample sets from all the data in the Fall 2020 semester of our dataset, one with grades greater than or equal to A- (sample size 438), and the other with grades less than or equal to C+ (the sample size 208). Figure 1 shows the distribution on RAST of samples with grades A- (in blue) and the distribution on RAST of samples with grades C+ (in grey) in Fall 2020. The data of the two sets came from five courses (CSC3001, CSC3002, MAT2040, MAT3007, and EIE2050) in Fall 2020. For samples with higher grades (in blue), the RAST values of 79% samples are greater than 0, and 13% samples are greater than 0.25. For samples with lower grades (in grey), the RAST of the 75% samples are less than 0, 39% samples are less than -0.25, and 19% samples are even less than -0.5. We can see that students with high grades have a higher probability of having high RAST, whereas students with lower grades have a higher probability of having low RAST. We did a similar experiment on Spring 2021 data (The two sample sets are of size 1422 and 705 respectively), and the results are shown in Figure 2. The distributions are similar to those in Figure 1.
5.4 Predicting Academic Performance
In this experiment, we used students’ RAST and some other attributes as features in logistic regression models to predict their academic performance. More precisely we predicted whether a student will have a struggling performance (course grade C+). The data used in our experiments came from 20 courses. For each sample , is a vector consisting of 4 features, including the RAST in the course, average GPA in previous semesters, year in university, and the school (in one-hot coding). if grade C+, or otherwise . Note that we used a mix of data from different courses because the grading criteria for each course are not very different and RAST is in the range of -1 to 1. We randomly divided the data into a training set and a test set according to the ratio of 4:1. We used the cross entropy loss function for Logistic Regression training in order to avoid overfitting. The total number of samples is 5697, with 15.6% of them being positive samples (). Since the data is imbalanced, we experimented both with and without the “balanced” mode. As discussed in the Preliminary (Section 3), the “balanced” mode can improve the recall while sacrificing the precision. All experimental results are averaged after ten repetitions. At the same time, we also tried replacing RAST with AST and conducted experiments for comparison. The results are shown in Table 4. In the unbalanced mode, RAST is better than AST on precision (0.80 vs. 0.68), while AST is better than RAST on recall (0.49 vs. 0.44). The two methods are tied on f1-score. In the “balanced” mode, however, RAST is better than AST on all the three measures (precision, recall and f1-score).
Furthermore, in order to evaluate the feature importance of RAST, we also repeated the above experiment without using RAST as a feature. The results (with standard deviation values) are shown in the Table 5. Compared with the results using RAST, the f1-score decreased by 28% (0.57 vs. 0.41) with the “unbalanced” mode, and the f1-score decreased by 0.25% (0.68 vs. 0.51) with “balanced” mode.
| RAST | “unbalanced” mode | “balanced” mode
|
|---|---|---|
| precision | 0.80 (0.05) | 0.56 (0.04) |
| recall | 0.44 ( 0.02) | 0.85 (0.03) |
| f1-score | 0.57 (0.01) | 0.68 (0.01) |
| AST | “unbalanced” mode | “balanced” mode
|
| precision | 0.68 ( 0.06) | 0.53 ( 0.03) |
| recall | 0.49 (0.02) | 0.76 ( 0.04) |
| f1-score | 0.57 (0.03) | 0.62 ( 0.04) |
| “unbalanced” mode | “balanced” mode
| |
|---|---|---|
| precision | 0.63 ( 0.04) | 0.38 ( 0.02) |
| recall | 0.31 ( 0.05) | 0.76 ( 0.04) |
| f1-score | 0.41 ( 0.03) | 0.51 ( 0.04) |
5.5 Application of Half Semester Data
In real-life applications, it is important to detect at-risk students long before the semester is over. Therefore, in this experiment we used only the data from the first half of the semester to perform the training. We repeated the same experiments as in the previous section, except that only the assignment data from the first half of the semester are used to train the prediction models. The results (with standard deviation values) are shown in Table 6. We can see that only using half semester data, models with RAST can still achieve better results than models with AST. In unbalanced mode, the f1-score of RAST is 61% better than that of AST (0.53 vs. 0.33). In the balanced mode, the f1-score of RAST is 14% better than that of AST (0.64 vs. 0.56). We notice that for RAST the f1-scores are only slightly worse than the original experimental results in Table 4 (0.53 vs. 0.57 for “unbalance” mode and 0.64 vs. 0.68 for “balanced” mode), even though using half amount of the data. Our experimental results inspire us to use our method to predict students who are likely to be struggling in the course halfway through the course, which allows us to take steps early to provide assistance to these students in need.
Moreover, we conducted additional experiments on individual courses, with all experimental settings unchanged. Experimental results show that our method can achieve stronger results in some individual courses, including EIE2050 (0.86 f1-score), CSC3001 (0.81 f1-score), and CSC3002 (0.80 f1-score) of Fall 2020, as well as MAT3040 (1.00 f1-score), MAT3007 (0.81 f1-score) and STA3020 (0.79 f1-score) of Spring 2021. The f1-score of other testing courses are below 0.79. See the appendix for the complete results.
| RAST | “unbalanced” mode | “balanced” mode
|
|---|---|---|
| precision | 0.76 (0.07) | 0.52 (0.02) |
| recall | 0.41 ( 0.03) | 0.83 (0.05) |
| f1-score | 0.53 (0.04) | 0.64 (0.02) |
| AST | “unbalanced” mode | “balanced” mode
|
| precision | 0.62 ( 0.02) | 0.52 ( 0.01) |
| recall | 0.45 (0.03) | 0.71 ( 0.02) |
| f1-score | 0.33 ( 0.02) | 0.56 ( 0.02) |
6. DISCUSSION
Studies have shown that students tend to delay assessment submissions until deadlines approach [1, 3]. Our data also indicate that more than 60% of students did not submit assignments until the last 24 hours before the deadlines. The submission distribution may vary in different courses due to the assignments’ difficulties and the students’ average level. Hence, AST reflects limited information about the objectives of students. RAST takes other students in the same course into consideration. The performance of RAST better than the AST manifests that RAST is a more general feature to estimate whether a student’s assignment submission time is in a normal stage.
We have considered the circumstances that students submit their assignments after the deadlines. Even though late submissions receive heavy penalties on grading, students may be overwhelmed with the workload or forget to submit assignments, causing slightly late submissions. However, the assignments usually account for a limited proportion of the final grade. By finishing the assignments, students practice a review and raise the chance of getting a good mark in the final exam. In this sense, late submissions are better than making no submission, and late submissions contain valuable information. Compared with the general regularization, RAST divides submissions of the same course into two groups (late and normal) to capture the information from late submissions.
In Table 3, three STA courses attain low correlation values between RAST/AST and course grades. We conjecture that course difficulty and assessment composition may influence the correlation. For example, STA3010, STA3100 and STA3020 are all advanced statistics courses. The exams are difficult, so that their final exam scores are dominant in the course grades. For such courses, assignment submission time may not be sufficient to trace students’ learning status because besides the assignments students still need to spend a lot of time reviewing and understanding the course contents. In contrast, STA2001 the elementary statistics course (this university set up statistics course codes from 2000 instead of 1000), gains a much higher correlation coefficient between RAST and course grades.
7. LIMITATIONS AND FUTURE WORK
In this paper, we studied assignments finished offline and submitted online through LMS. Since in such a setting we cannot collect the time the students start doing the assignments, the submission time may not always reflect students’ study attitudes. For example, a student may complete an assignment early, but submit it close to the deadline.
Although we mentioned in the paper that the grading standards of the courses included in the data used in this paper are not very different, in other scenarios, if the evaluation standards of different courses are very different, it may be necessary to consider the difference on grading schemes between courses when using Relative Assignment Submission Time (RAST) on multiple course data. We leave the study of such scenarios to future work.
8. CONCLUSION
Students’ assignment submission time is an important factor on study psychology and behavior analysis. In this paper, we proposed a new indicator using peer assignment submission information called Relative Assignment Submission Time (RAST). Our experiments on real-life data showed a high correlation coefficient between RAST and students’ academic performance. Using relative assignment submission time as a feature, we built a machine learning model to predict students who are likely to suffer from poor performance in courses. The experimental results show that the prediction ability of the model is significantly improved by adding RAST as a feature. We also used half semester data to train prediction models which allow us to identify students who may be struggling in the course earlier and make it easier for schools and teachers to take relevant measures in time to help these students.
9. ACKNOWLEDGMENTS
This work was supported by Shenzhen Research Institute of Big Data. We also want to thank anonymous reviewers for helpful suggestions.
10. REFERENCES
- L. Agnihotri, R. Baker, and S. Stalzer. A procrastination index for online learning based on assignment start time. In Proceedings of The 13th International Conference on Educational Data Mining (EDM20), pages 550–554. International Educational Data Mining Society, 2020.
- N.-J. Akpinar, A. Ramdas, and U. Acar. Analyzing student strategies in blended courses using clickstream data. In Proceedings of The 13th International Conference on Educational Data Mining (EDM20), pages 6–17. International Educational Data Mining Society, 2020.
- M. L. Bote-Lorenzo and E. Gómez-Sánchez. Predicting the decrease of engagement indicators in a mooc. In Proceedings of the 7th international learning analytics and knowledge conference, pages 143–147, 2017.
- S. H. Cormack, L. A. Eagle, and M. S. Davies. A large-scale test of the relationship between procrastination and performance using learning analytics. Assessment & Evaluation in Higher Education, 45(7):1046–1059, 2020.
- P. Deng, J. Zhou, J. Lyu, and Z. Zhao. Assessing attendance by peer informations. In Proceedings of The 14th International Conference on Educational Data Mining (EDM21), pages 400–406. International Educational Data Mining Society, 2021.
- J. Feild, N. Lewkow, S. Burns, and K. Gebhardt. A generalized classifier to identify online learning tool disengagement at scale. In Proceedings of the 8th International Conference on Learning Analytics and Knowledge, pages 61–70, 2018.
- A. Gurung, A. F. Botelho, and N. T. Heffernan. Examining student effort on help through response time decomposition. In Proceedings of the 11th International Learning Analytics and Knowledge Conference, pages 292–301, 2021.
- M. Hlosta, Z. Zdrahal, and J. Zendulka. Ouroboros: early identification of at-risk students without models based on legacy data. In Proceedings of the 7th international learning analytics and knowledge conference, pages 6–15, 2017.
- J. P. Ioannidis. The proposal to lower p value thresholds to. 005. Jama, 319(14):1429–1430, 2018.
- I. Jivet, J. Wong, M. Scheffel, M. Valle Torre, M. Specht, and H. Drachsler. Quantum of choice: How learners’ feedback monitoring decisions, goals and self-regulated learning skills are related. In Proceedings of the 11th international learning analytics and knowledge conference, pages 416–427, 2021.
- K. R. Kim and E. H. Seo. The relationship between procrastination and academic performance: A meta-analysis. Personality and Individual Differences, 82:26–33, 2015.
- M. Kokoç, G. Akçapınar, and M. N. Hasnine. Unfolding students’ online assignment submission behavioral patterns using temporal learning analytics. Educational Technology & Society, 24(1):223–235, 2021.
- H. Li, W. Ding, and Z. Liu. Identifying at-risk k-12 students in multimodal online environments: a machine learning approach. In Proceedings of The 13th International Conference on Educational Data Mining (EDM20), pages 137–147. International Educational Data Mining Society, 2020.
- H. Li, C. F. Lynch, and T. Barnes. Early prediction of course grades: models and feature selection. In Proceedings of The 11th International Conference on Educational Data Mining (EDM18), pages 492–495. International Educational Data Mining Society, 2018.
- J. McBroom, B. Jeffries, I. Koprinska, and K. Yacef. Mining behaviours of students in autograding submission system logs. In Proceedings of The 9th International Conference on Educational Data Mining (EDM16), pages 159–166. International Educational Data Mining Society, 2016.
- M. Nieberding and A. F. Heckler. Patterns in assignment submission times: Procrastination, gender, grades, and grade components. Physical Review Physics Education Research, 17(1):013106, 2021.
- J. Park, R. Yu, F. Rodriguez, R. Baker, P. Smyth, and M. Warschauer. Understanding student procrastination via mixture models. In Proceedings of The 11th International Conference on Educational Data Mining (EDM18), pages 187–197. International Educational Data Mining Society, 2018.
- F. Pedregosa, G. Varoquaux, A. Gramfort, V. Michel, B. Thirion, O. Grisel, M. Blondel, P. Prettenhofer, R. Weiss, V. Dubourg, et al. Scikit-learn: Machine learning in python. the Journal of machine Learning research, 12:2825–2830, 2011.
- F. Salehian Kia, M. Hatala, R. S. Baker, and S. D. Teasley. Measuring students’ self-regulatory phases in lms with behavior and real-time self report. In Proceedings of the 11th International Learning Analytics and Knowledge Conference, pages 259–268, 2021.
- V. Sher, M. Hatala, and D. Gašević. Analyzing the consistency in within-activity learning patterns in blended learning. In Proceedings of the 10th International Learning Analytics and Knowledge Conference, pages 1–10, 2020.
- D. Tzimas and S. Demetriadis. The impact of learning analytics on student performance and satisfaction in a higher education course. In Proceedings of The 14th International Conference on Educational Data Mining (EDM21), pages 654–660. International Educational Data Mining Society, 2021.
- R. E. Wright. Logistic regression. 1995.
- Y. Xu and K. Wilson. Early alert systems during a pandemic: A simulation study on the impact of concept drift. In Proceedings of the 11th International Learning Analytics and Knowledge Conference, pages 504–510, 2021.
- M. Yao, S. Sahebi, and R. Feyzi Behnagh. Analyzing student procrastination in moocs: a multivariate hawkes approach. In Proceedings of The 13th International Conference on Educational Data Mining (EDM20), pages 280–291. International Educational Data Mining Society, 2020.
- T. Zhang, M. Taub, and Z. Chen. Measuring the impact of covid-19 induced campus closure on student self-regulated learning in physics online learning modules. In Proceedings of the 11th International Learning Analytics and Knowledge Conference, pages 110–120, 2021.
APPENDIX
| course | f1-score |
|---|---|
| MAT3040 (21 spring) | 1.00 |
| EIE2050 (20 fall) | 0.86 |
| MAT3007 (21 spring) | 0.81 |
| CSC3002 (20 fall) | 0.80 |
| CSC3001 (20 fall) | 0.79 |
| STA3020 (21 spring) | 0.79 |
| FIN2020 (21 spring) | 0.75 |
| MAT2002 (21 spring) | 0.67 |
| CSC4020 (21 spring) | 0.67 |
| CSC1001 (21 spring) | 0.65 |
| MAT2040 (20 fall) | 0.65 |
| MAT3253 (21 spring) | 0.65 |
| STA2001 (21 spring) | 0.64 |
| CSC1002 (21 spring) | 0.63 |
| STA3010 (21 spring) | 0.63 |
| STA3001 (21 spring) | 0.61 |
| MAT2007 (21 spring) | 0.59 |
| MAT3007 (20 fall) | 0.53 |
| MAT2040 (21 spring) | 0.43 |
| ERG2050 (21 spring) | 0.31 |
© 2022 Copyright is held by the author(s). This work is distributed under the Creative Commons Attribution-NonCommercial-NoDerivatives 4.0 International (CC BY-NC-ND 4.0) license.