ABSTRACT
Academic grades in assessments are predicted to determine if a student is at risk of failing a course. Sequential models or graph neural networks that have been employed for grade prediction do not consider relationships between course descriptions. We propose the use of text mining to extract semantic, syntactic, and frequency-based features from course content. In addition, we classify intended learning outcomes according to their higher- or lower-order thinking skills. A learning parameter is then formulated to model the impact of these cognitive levels (that are expected for each course) on student performance. These features are then embedded and represented as graphs. Past academic achievements are then fused with the above features for grade prediction. We validate the performance of the above approach via datasets corresponding to three engineering departments collected from a university. Results obtained highlight that the proposed technique generates meaningful feature representations and outperforms existing methods for grade prediction.
Keywords
1. INTRODUCTION
Detecting students at the risk of failing university courses based on predicted grades is essential for administering early intervention strategies. From a regression problem perspective, grades obtained from prior courses in previous semesters are used to predict grades for pilot courses registered in the upcoming semester.
1.1 Related Models for Grade Prediction
Existing techniques for grade prediction using past academic records include conventional regression models such as random forest, support vector machine, and K-nearest neighbor [10, 15, 1] as well as the factorization machine in a collaborative filtering setting [33]. In addition to the use of past examination results, information derived from online click-stream data on learning management systems has been used to augment the prediction capability of a model [26, 25]. More recently, sequential models such as the long short-term memory (LSTM) network have been developed to capture the temporal dynamics of past academic performance [12]. While such deep learning models have achieved reasonable success in grade prediction, existing temporal-based approaches do not take the relationships among courses and among students into account. Consideration of these relationships is essential since information pertaining to courses with similar content and students with similar cognitive levels would aid in grade prediction. In addition, the performance trend of an academically-inclined student or a well-performed course in the current semester may continue for the upcoming semesters [23].
Notwithstanding the above, graph neural networks have recently been employed to generate meaningful feature representations which model the transitions of grade distributions between courses across semesters [11]. Similar to social multi-relational networks [14] with nodes representing either students or courses, three graphs—student-course, student-student, and course-course graphs—consisting of edge links computed via grade distribution similarities or correlations have been constructed [23, 21]. Modeling the student-course relations have also been achieved via knowledge graphs to extract course and student embeddings as well as to encode temporal student behavioral data [17]. Pre- or co-requisites between courses have also been considered for grade prediction [27].
Despite adopting multi-dimensional approaches toward analyzing prior course grades to predict student performance [35], existing models assume that the relationship among courses depends solely on the grade distribution; these models do not consider topics covered and the intended learning outcomes defined by the course instructors. These aspects are important since the process of knowledge acquisition often involves assimilating and discerning information from myriad sources [29], i.e., academic performance has shown to be dependent on prior experience and how the student has understood certain concepts. Moreover, course content that overlap or are highly inter-dependent may influence how well the student can achieve the intended learning outcomes for the upcoming semesters [38]. While course syllabus has recently been used to extract frequency-based features for the determination of course similarities [16], it does not analyze the intended learning outcomes nor capture the relationship between courses holistically. It is also not surprising to expect that students who are less academically inclined often struggle in courses that require higher-order thinking skills. Information pertaining to the thinking skills required for prior courses will, therefore, allow the grade-prediction model to better represent grades achieved from previous semesters.
1.2 Grade Prediction From Curriculum Development Perspective
From a curriculum development perspective, course descriptions comprise topics to be covered and the intended learning outcomes for each course designed by the course instructor [34]. The importance of identifying suitable topics is motivated by an earlier study where first-year university students who had been exposed to fundamental concepts in high school have shown to perform better than those who had not studied similar content before [13]. In today’s context, this highlights the intrinsic (and often intimate) relationships including pre-requisites, recommended literature, and course content that define dependencies between courses. Coupled with the fact that course instructors often adopt the constructivist approach in curriculum design [6], analysis of course content is important for grade prediction.
Apart from course content, outcome-based teaching and learning require course instructors to identify suitable intended learning outcomes and assessments that measure those learning outcomes [4, 30]. In this regard, learning activities with various cognitive complexity levels should be designed and aligned with the learning outcomes constructively throughout the course [32, 2, 5, 9]. Alignment of learning activities can be achieved via the revised Bloom’s Taxonomy with the recollection of information being associated with the lowest-order thinking skill to generating creative outcomes being associated with the highest-order thinking skill [20]. Given that less academically-inclined students often face challenges in higher-order thinking skills [39], it is important to consider the influence of learning outcomes on student performance for grade prediction.
1.3 Contribution of This Work
In this work, we propose a course description-based grade prediction (CODE-GP) model that employs text mining techniques for extracting features associated with (i) course content similarities and (ii) higher- or lower-order thinking skills required for each course. With regards to the first dimension highlighted in Table 1, we propose three types of course similarities extracted from topic outlines and learning outcomes found within course descriptions. These similarities include semantic [22], syntactic [3], and frequency-based features [36]. The use of these features is in contrast to the use of grade distributions as edge weights for generating similarities [11]. The basis for our proposed architecture is motivated by the need to consider both course outlines and learning outcomes, since both the intended learning outcomes and syllabus are important for the development and implementation of teaching programs [28]. In addition, we also consider past performance of each student from the perspective of thinking skills required for each course. In particular, the proposed model employs a document classification approach that tags each course with higher- or lower-order thinking skills according to the revised Bloom’s Taxonomy. A learnable parameter is then used to aggregate the respective grades achieved for both lower- and higher-order thinking skill courses. This allows the proposed model to establish the relationship between the complexity of courses and academic performance.
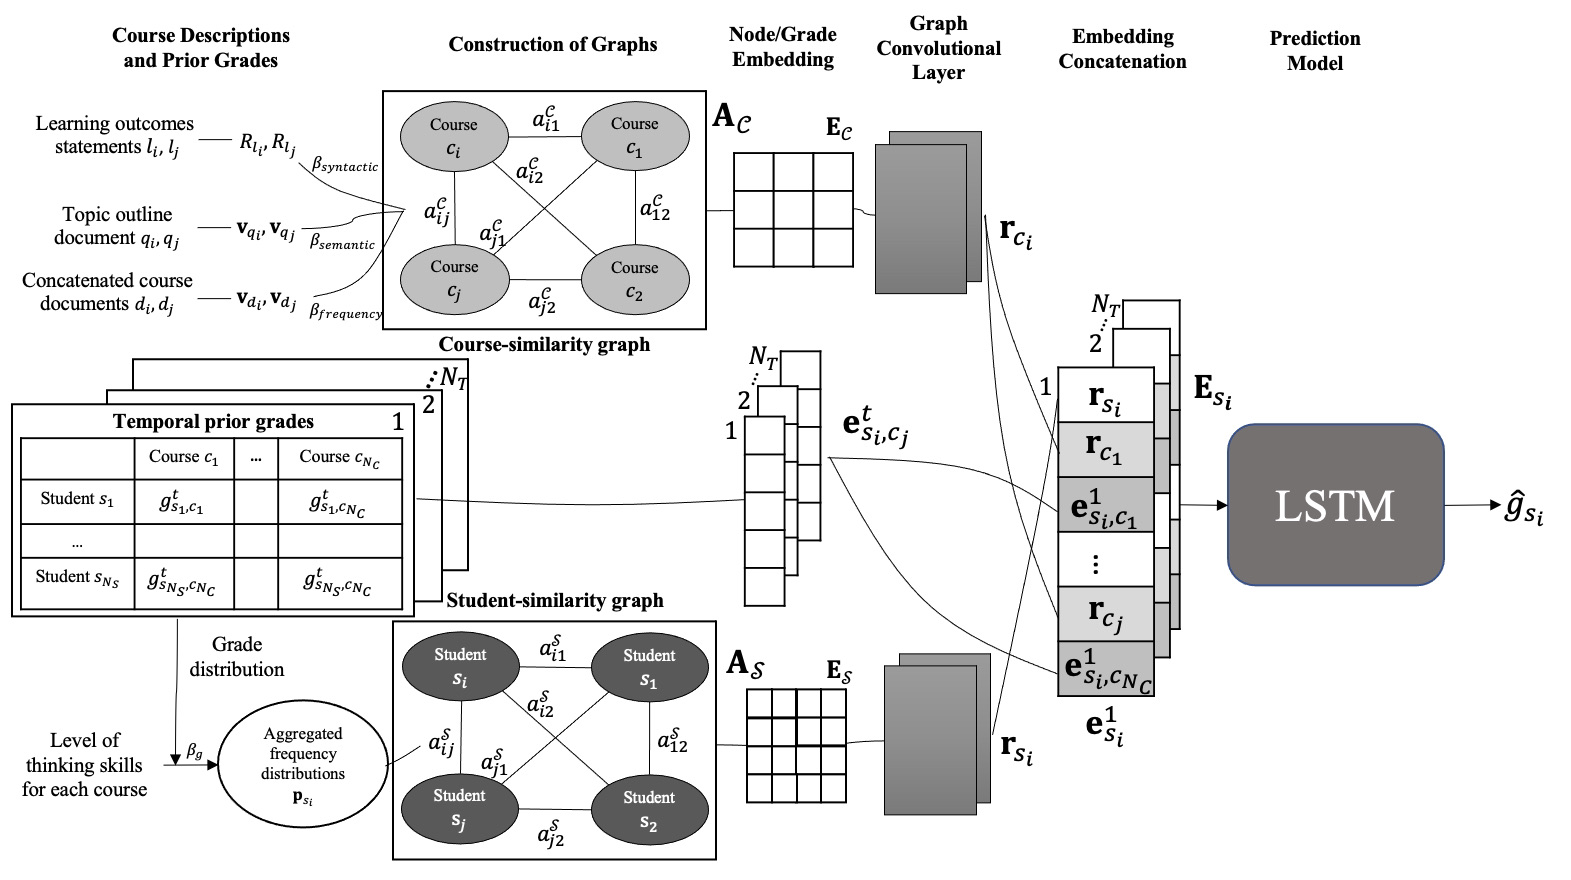
As shown in Figure 1, we adopt graph neural networks to generate representations of the above text mining features. These features are represented as course- and student-similarity graphs with nodes corresponding to courses and students, respectively. The edge weights for the former are computed based on the proposed three text features. For the latter, past academic grades are aggregated, and the similarity related to Jensen-Shannon Divergence (JSD) is then computed among the grade distributions [23]. These graphs are subsequently embedded and trained using a graph convolutional network (GCN) layer.
In addition and similar to [12], we incorporate temporal information extracted from past examination records for each student across semesters. Grade embeddings, the corresponding student vector, and prior course vectors acquired from the GCN for each semester are then concatenated as a representation vector. This temporal representation serves as the input to LSTM, which exploits the sequential relationships and predicts the grade for a course to be taken in the coming semester.
2. THE PROPOSED CODE-GP MODEL
The task of grade prediction involves predicting the grade for student who has registered a pilot course. Given number of prior courses and students, the set of prior courses is defined as and the set of students as . We define as the predicted grade of a given pilot course for the student .
2.1 Construction of Course Similarities Graph Based on Course Descriptions
The CODE-GP model incorporates semantic, syntactic, and frequency-based features extracted from course descriptions that comprise topic outlines and intended learning outcomes. These features are subsequently used for constructing the course-similarity graph. We first pre-process the text by removing symbols, diagrams, equations, numbers, punctuation marks, and stop-words (e.g., “and", “or"). All remaining characters are set to lower case [32].
Semantic similarity based on word embeddings has been employed to assess student capability for the recommendation of similar courses [24]. In the context of CODE-GP, we first define topic outline as corresponding to course . A topic outline vector is then generated from based on the bidirectional encoder representations from transformer (BERT) embeddings [7, 8]. The cosine similarity between and is then computed between two course outlines via
(1)With , a value of 1 implies an almost semantically similar pair of courses and .
Syntactic features for CODE-GP comprise phrase types (i.e., regular expressions (regexes)) that are extracted from statements associated with the intended learning outcomes. In this context, we first extract noun- and verb-phrases from the intended learning outcome document corresponding to course . These (multiple) phrases are then associated with their parts-of-speech tags resulting in the set of regexes [31]. Overlaps between the regex sets are then computed via the Jaccard similarity given by
(2)where . The number of common occurrences is denoted by while refers to the total number of regexes. A high Jaccard similarity, therefore, implies a high proportion of similar phrase types occuring between a course pair regardless of whether the topics covered are identical.
The term frequency-inverse document frequency (TF-IDF) determines the uniqueness of a word within a set of documents [37]. To account for word appearance similarity, we include TF-IDF weighting on both the topic outlines and intended learning outcomes for course . These features are extracted from each concatenated course document , where denotes the concatenation of two texts. We then compute the cosine similarity similar to (1) but between bag of words (BoW) vectors and corresponding to each course document. Here, with denoting the th word in document . The BoW vector length is based on the word vocabulary size across the entire corpus. The value of each element corresponding to the TF-IDF weight for word is given by [37]
(3)where is the number of times occurs in , denotes the length of that document, the total number of documents, and the number of documents in which occurs. The obtained TF-IDF values are subsequently normalized to prevent bias in the term frequency variable due to document length .
With nodes of the course-similarity graph denoted by each course , the edge weights are determined via
where , , and are the trainable weights. Each of the variable is used within the adjacency matrix
(5)corresponding to the course-similarity graph.
2.2 Temporal Grade Information
Before attempting the pilot course in the current semester, we assume, for each student , availability of prior course grades in across semesters , where is the total number of semesters, denotes the grade that student achieves for in semester . Hence, the grade vector for student in semester is given by
(6)where is the total number of prior courses across all semesters. It is important to note that for a given semester, only a subset of these prior courses are attempted, i.e., is not a full vector and null elements will be assigned for courses not attempted during that semester. Across all previous semesters, we acquire the temporal grade information for each student, as shown in Figure 1. Such temporal grade information would be used in two ways—(i) being aggregated according to the thinking skills required for each course and to generate student similarity as will be described in Section 2.3 and (ii) being concatenated with the course and student embeddings as input for LSTM.
2.3 Construction of Student Similarities Graph Based on Cognitive Levels
Construction of the student-similarity graph is based on cognitive levels associated with each course according to Table 1. Each of the prior courses is first categorized as one that requires high-order thinking skills or lower-order thinking skills . This is achieved by first classifying each course intended learning outcome statement via document classification described in [31] with classes being defined according to Bloom’s Taxonomy. Each course is then tagged as (or ) if more statements are classified as labels associated with high-order (or lower-order) thinking skills.
For each student, we compute the frequency distribution and corresponding to courses that require lower- and higher-order thinking skills. This is achieved by first dividing the grade range (1-100) into five bins of twenty-point intervals before determining the number of courses (in each and category) that falls under each bin. Contributions of these two distributions are then learned via
(7)where is a learnable weight for . With the above, student similarities are obtained via the JSD between the grade distribution for each pair of students, i.e.,
(8)Therefore, a higher implies that the two students possess similar higher- or lower-order skills (measured by how they perform in the prior courses). With the student similarity graph shown in Figure 1 comprising students as nodes, the corresponding adjacency matrix is generated based on similar to (5).
Mean Squared Error (MSE) |
||||||||||
|---|---|---|---|---|---|---|---|---|---|---|
|
Methods | Department 1 | Department 2 | Department 3 |
Average | ||||||
| Ave. | Ave. | Ave. | ||||||||
| LR | 0.0360 | 0.0199 | 0.0280 | 0.0262 | 0.0247 | 0.0255 | 0.0264 | 0.0576 | 0.0420 | 0.0318
|
| LSTM [12] | 0.0309 | 0.0210 | 0.0260 | 0.0191 | 0.0259 | 0.0252 | 0.0164 | 0.0377 | 0.0270 | 0.0252
|
| GCN [19] | 0.0356 | 0.0214 | 0.0285 | 0.0259 | 0.0251 | 0.0245 | 0.0224 | 0.0276 | 0.0250 | 0.0263
|
| Proposed CODE-GP | 0.0296 | 0.0203 | 0.0250 | 0.0159 | 0.0184 | 0.0172 | 0.0188 | 0.0299 | 0.0244 | 0.0222
|
2.4 GCN and Embeddings
After constructing the course- and student-similarity graphs, we employ a two-layer GCN to embed each graph. Both course and student nodes are encoded with one-hot vectors to obtain encoded matrices and . The embedding vector for the course-similarity graph is generated via
(9)such that the one-hot vectors are represented as dense vectors of lower dimensions. Here, is the weight matrix. With being generated similarly, and with and derived from Sections 2.1 and 2.3, two GCN layers [18] are then applied to obtain latent representations of all nodes in course-similarity graph and student-similarity graph . In particular, the th layer for is computed via
(10)where is the degree matrix, , and is the weight matrix. The output of the GCN for course-similarity graph is denoted as matrix with each row vector being associated with course . The above computation is also applied on student-similarity graph to obtain the graph embedding matrix with each row vector being defined as for student .
To generate representations for the prior grades achieved, embedding is applied for each grade. With a one-hot vector representing a unique value of prior grade , the embedding vector for a student prior grade is learned via
(11)where is the weight matrix. The three embedding vectors from course-similarity graph, student-similarity graph, and temporal grade information are then concatenated for each semester to form a vector
(12)where , , and denote the embedding length for , , and , respectively, and denotes transpose. Each of these vectors are then concatenated to form a feature matrix
(13)of each student for the subsequent prediction model.
2.5 Grade Prediction using Long Short-term Memory Network
LSTM models time-series representations and is used to predict the pilot grade based on sequential matrix for each student. Through the use of input, output, and forget gate, LSTM aggregates important and permutes less significant representations to achieve prediction of pilot grades in semester . LSTM is employed for grade prediction via the hidden state
(14)where denotes the hidden state for semester . The predicted grade for student obtained from the last hidden state is then given by
(15)where and are defined, respectively, as the weight vector and bias scalar for the predictor.
3. RESULTS AND DISCUSSION
3.1 Datasets and Implementation Details
Open-source datasets employed for grade prediction do not include course descriptions. We collected data that include both academic records and course descriptions (comprising both course outlines and intended learning outcomes). These are obtained from three engineering departments in a university to evaluate the models. Each dataset is obtained with the student name and identity being hashed by another office (authorized to handle such data) to protect privacy. Table 2 summarizes details for each dataset used. In particular, for each dataset is determined by the maximum number of semesters the students within the cohort take to complete all courses under consideration. The prior course list for each pilot course consists of the core courses corresponding to the department’s curriculum. In addition, and are distinct for each dataset. In our experiments, the training, validation, and testing ratio are set as 6:2:2.
We employed the mean squared error (MSE)
(16)for performance evaluation, where denotes the actual grade obtained by student for a given pilot course. In terms of hyperparameter selection, course description document embeddings are trained using BERT with a dimension of 768. During GCN training, the dropout rate was set as 0.5, while the Adam optimizer with a learning rate of 0.001 was used. A weight decay parameter was set to to prevent overfitting.
3.2 Performance Analysis
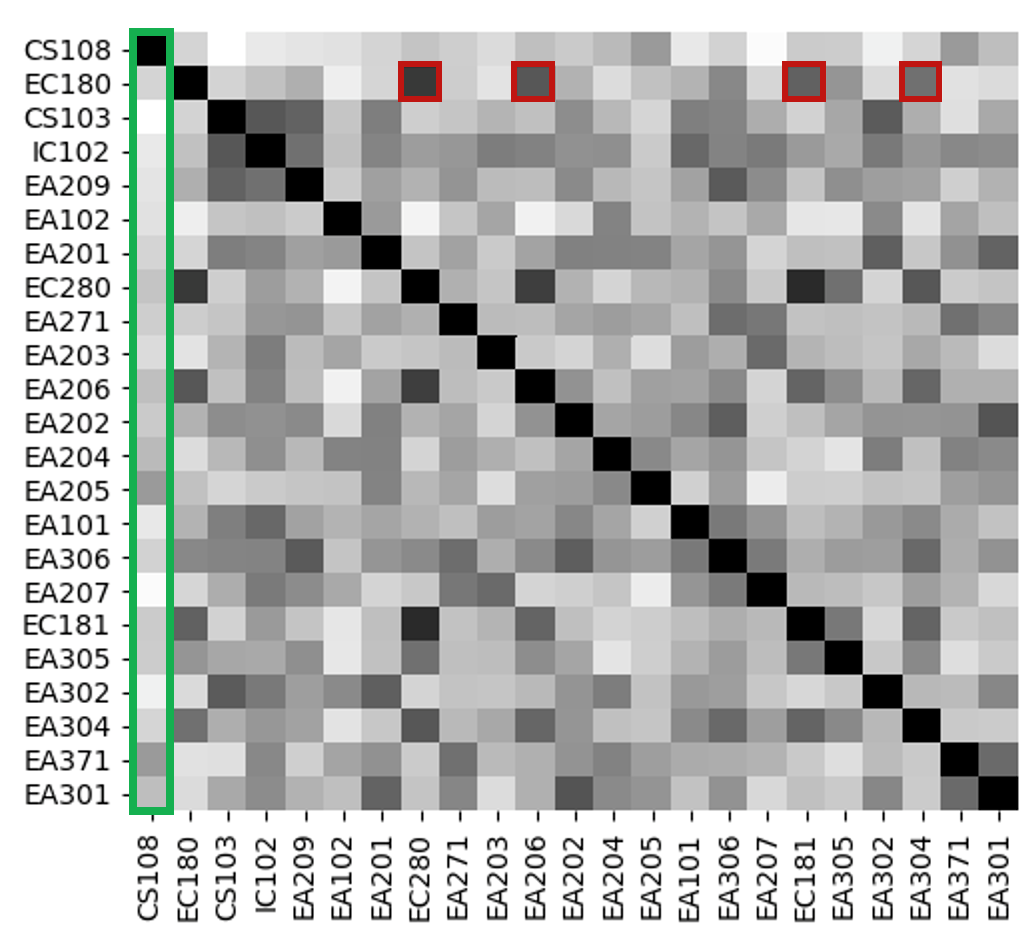
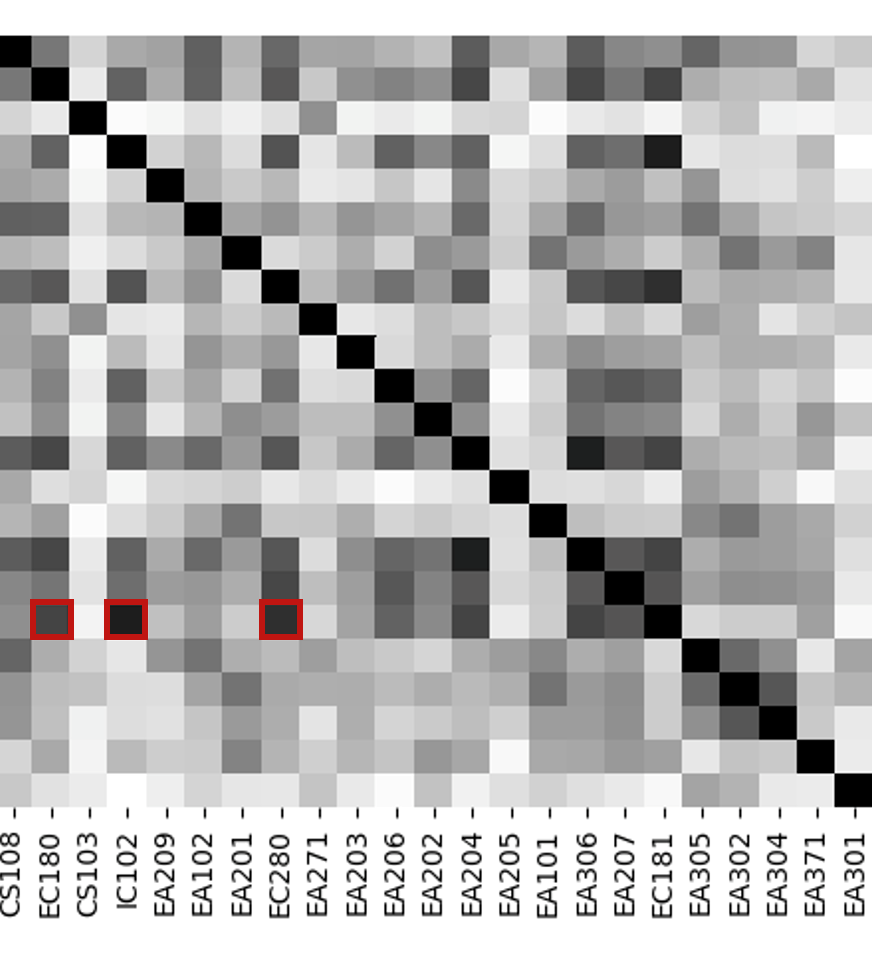
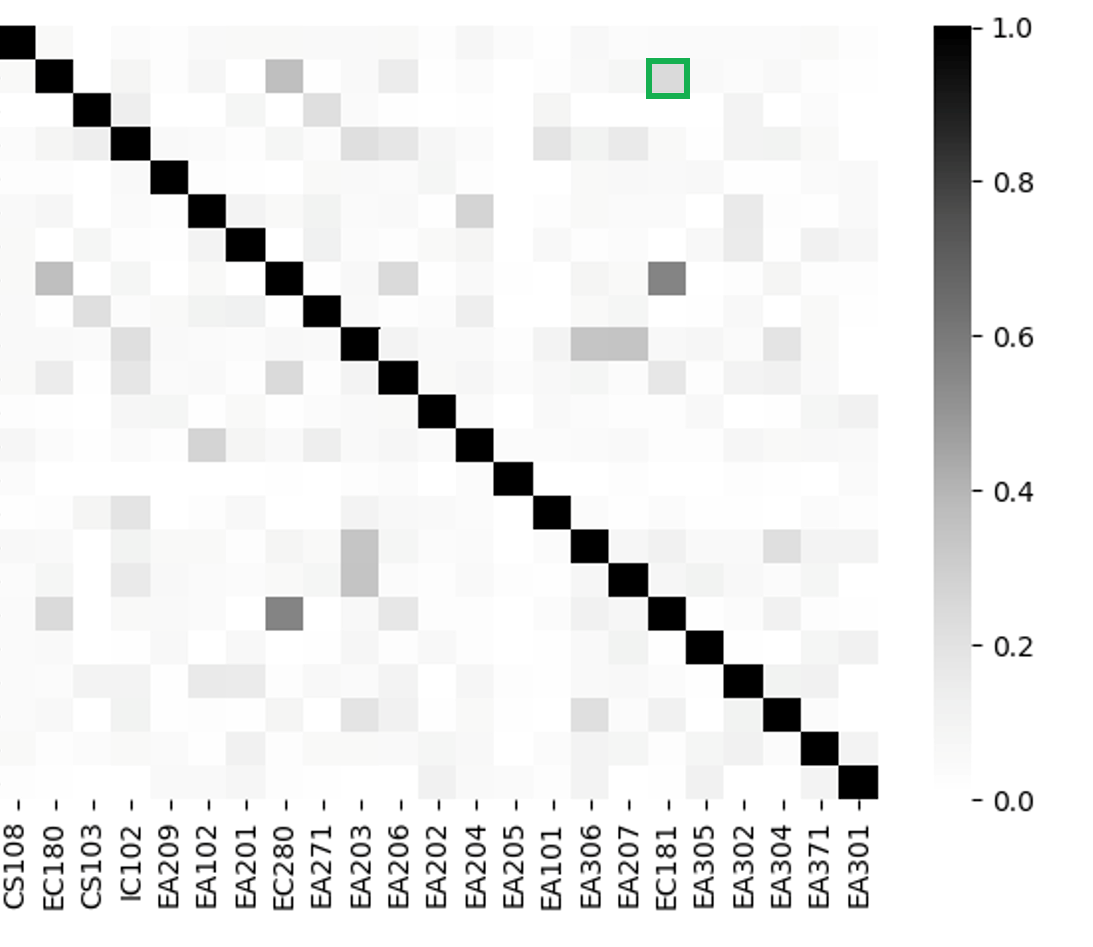
We take pilot course from Department as an example to illustrate the impact of considering the semantic, syntactic, and frequency aspects of words used in course outlines and intended learning outcomes. Three heatmaps with colors depicting the similarity values described in Section 2.2 are provided while details pertaining to prior course information are shown in Table 3.
Figure 2(a) illustrates the semantic cosine similarity where high similarities in terms of the closeness of course content are indicated by the dark shades. It can be seen that the mathematics-based prior course EC180 exhibits high semantic similarity with other prior courses EC280, EA206, EC181, and EA304, which have high mathematical content. On the other hand, computing course CS108 exhibits lower semantic similarity with the most of other non-programming courses. Figure 2(b) highlights how (dis)similar phrase types are between the course outlines and the intended learning outcomes of two prior courses. We note that EC181 exhibits higher Jaccard similarity with courses that require fundamental scientific and mathematical knowledge such as EC180, IC102, and EC280. TF-IDF weighting, on the other hand, indicates the choice and uniqueness of words being used in the course outlines and intended learning outcomes. Figure 2(c) highlights the high variability in words used between the courses being considered—only a few pairs of course outlines and intended learning outcomes exhibit high TF-IDF similarity. In addition, we also note that the similarity between content is irrelevant. This can be observed from the fact that even though EC180 and EC181 are mathematics-related, their frequency-based TF-IDF similarity is relatively low.
We next compare the performance of the proposed CODE-GP model with LSTM based grade-prediction model [12], GCN [19], and the conventional logistic regression (LR) model. While LR and LSTM focus on temporal information and GCN exploits the interrelationship between courses and students, the proposed model considers both aspects. We note from Table 4 that the proposed CODE-GP model achieves the highest grade prediction capability than the LR, LSTM, and GCN. While the proposed model requires higher complexity than these three baseline models, CODE-GP achieves the lowest mean MSE of 0.0222 (11.9% improvement compared to LSTM), across the three departments as seen in Table 4. These results highlight the importance of course descriptions when constructing student- and course-similarity graphs with time series information. Features extracted from course descriptions enhance the grade prediction capability instead of using only a single modality.
We further performed an ablation test by excluding each input graph/temporal representations. Table 5 summarizes the MSE and mean absolute error (MAE) across all three departments. We note that the use of all three aspects in CODE-GP is vital to provide a holistic perspective for grade prediction. It is interesting to note that grade prediction performance is more sensitive to course-similarity graph (compared to student-similarity graph). This suggest that information derived from course descriptions can assist in grade prediction since performance is closely related to achieving the set of intended learning outcomes depicted in course descriptions. These results also highlight that temporal information and graphs provide complementary features which contribute jointly to the success of grade prediction.
4. CONCLUSIONS
We propose a grade prediction model that considers course descriptions and prior academic results. Text mining techniques determine the edge weights of the course- and student-similarity graphs. A three-pronged model that constitutes the semantic, syntactic, and frequency-based feature extraction methods is formulated for course similarities. Student performance in terms of their achievements in courses associated with low- or high-order thinking skills have also been incorporated to construct the student-similarity graph. The LSTM synthesizes these aspects before performing prediction.
An accurate and just-in-time prediction of performance enables course instructors to administer early interventions. Once the predicted results indicate a tendency of a student in failing a course, student support staff can respond and plan for a personalized intervention strategy for each student. Moreover, early detection of at-risk students can potentially reduce the drop-out rate. Future work may include techniques that incorporate other data modalities such as student demographic or online learning behavior while protecting student privacy.
5. REFERENCES
- M. Adnan, A. Habib, J. Ashraf, S. Mussadiq, A. A. Raza, M. Abid, M. Bashir, and S. U. Khan. Predicting at-risk students at different percentages of course length for early intervention using machine learning models. IEEE Access, 9:7519–7539, 2020.
- T. Andre. Does answering higher-level questions while reading facilitate productive learning? Review Edu. Research, 49:280–318, 1979.
- X. Bai, P. Liu, and Y. Zhang. Investigating typed syntactic dependencies for targeted sentiment classification using graph attention neural network. IEEE/ACM Trans. Audio Speech Lang. Proc., 29:503–514, 2021.
- D. Boud and N. Falchikov. Aligning assessment with long-term learning. Assessment, Evaluation Higher Edu., 31:399–413, 2006.
- S. G. Bull. The role of questions in maintaining attention to textual material. Review Edu. Research, 43:83–88, 1973.
- H. Bydžovská. A comparative analysis of techniques for predicting student performance. In Proc. Int. Conf. Edu. Data Mining (EDM), pages 306–311, 2016.
- J. Devlin, M. W. Chang, K. Lee, and K. Toutanova. BERT: pre-training of deep bidirectional transformers for language understanding. In Proc. Human Lang. Tech.: Annual Conf. North American Chap.(NAACL-HLT), pages 4171–4186, 2019.
- M. Fateen and T. Mine. Predicting student performance using teacher observation reports. In Proc. Int. Conf. Edu. Data Mining (EDM), pages 481–486, 2021.
- R. M. Felder and R. Brent. Designing and teaching courses to satisfy the ABET engineering criteria. J. Eng. Edu., 92:7–25, 2003.
- Q. Hu and H. Rangwala. Course-specific Markovian models for grade prediction. In Proc. Int. Pacific-Asia Conf. Knowledge Discovery Data Mining, pages 29–41. Springer, 2018.
- Q. Hu and H. Rangwala. Academic performance estimation with attention-based graph convolutional networks. In Proc. Int. Conf. Educational Data Mining, pages 69–78, 2019.
- Q. Hu and H. Rangwala. Reliable deep grade prediction with uncertainty estimation. In Proc. Int. Conf. Learn. Anal. & Knowl., pages 76–85, 2019.
- T. Hunt. Overlapping in high school and college again. J. Edu. Research, 13(3):197–207, 1926.
- V. N. Ioannidis, A. G. Marques, and G. B. Giannakis. A recurrent graph neural network for multi-relational data. In Proc. IEEE Int. Conf. Acoust., Speech, Signal Process. (ICASSP), pages 8157–8161, 2019.
- Z. Iqbal, J. Qadir, A. N. Mian, and F. Kamiran. Machine learning based student grade prediction: A case study. arXiv, pages 1–22, 2017.
- W. Jiang and Z. A. Pardos. Evaluating sources of course information and models of representation on a variety of institutional prediction tasks. In Proc. Int. Conf. Edu. Data Mining (EDM), pages 115–125, 2020.
- H. Karimi, T. Derr, J. Huang, and J. Tang. Online academic course performance prediction using relational graph convolutional neural network. In Proc. Int. Conf. Edu. Data Mining (EDM), pages 444–450, 2020.
- T. Kipf and M. Welling. Semi-supervised classification with graph convolutional networks. In Proc. Int. Conf. Learn. Representations (ICLR), pages 1–14, 2017.
- T. N. Kipf and M. Welling. Semi-supervised classification with graph convolutional networks. In Proc. Int. Conf. Learn. Representations, pages 76–85, 2017.
- D. Krathwohl. A revision of Bloom’s Taxonomy: An overview. Theory into Practice, 41:212–218, 2002.
- D. D. Leeds, T. Zhang, and G. M. Weiss. Mining course groupings using academic performance. In Proc. Int. Conf. Edu. Data Mining (EDM), pages 1–5, 2021.
- X. Liu, X. You, X. Zhang, J. Wu, and P. Lv. Tensor graph convolutional networks for text classification. In Proc. AAAI Conf. Artificial Intell., pages 8409–8416, 2020.
- X. Lu, Y. Zhu, Y. Xu, and J. Yu. Learning from multiple dynamic graphs of student and course interactions for student grade predictions. Neurocomputing, 431:23–33, 2021.
- H. Ma, X. Wang, J. Hou, and Y. Lu. Course recommendation based on semantic similarity analysis. In Proc. IEEE Int. Conf. Control Sci. Syst. Engg., pages 638–641, 2017.
- K. H. R. Ng, S. Tatinati, and A. W. H. Khong. Online education evaluation for signal processing course through student learning pathways. In Proc. IEEE Int. Conf. Acoust., Speech, and Signal Process., pages 6458–6462, 2018.
- K. H. R. Ng, S. Tatinati, and A. W. H. Khong. Grade prediction from multi-valued click-stream traces via Bayesian-regularized deep neural networks. IEEE Trans. Signal Process., 69:1477–1491, 2021.
- Z. Ren, X. Ning, A. S. Lan, and H. Rangwala. Grade prediction based on cumulative knowledge and co-taken courses. In Proc. Int. Conf. Educational Data Mining, pages 158–167, 2019.
- J. C. Richards. Curriculum approaches in language teaching: Forward, central, and backward design. RELC J., 44(1):5–33, 2013.
- S. H. Seyyedrezaie and G. Barani. Constructivism and curriculum development. J. Humanities Insights, 1(3):119–124, 2017.
- S. Supraja, K. Hartman, S. Tatinati, and A. W. H. Khong. Toward the automatic labeling of course questions for ensuring their alignment with learning outcomes. In Proc. 10th Int. Conf. Educational Data Mining (EDM), pages 56–63, 2017.
- S. Supraja, A. W. H. Khong, and S. Tatinati. Regularized phrase-based topic model for automatic question classification with domain-agnostic class labels. IEEE/ACM Trans. Audio Speech Lang. Proc., 29:3604–3616, 2021.
- S. Supraja, S. Tatinati, K. Hartman, and A. W. H. Khong. Automatically linking digital signal processing assessment questions to key engineering learning outcomes. In Proc. IEEE Int. Conf. Acoust., Speech, Signal Process. (ICASSP), pages 6996–7000, 2018.
- M. Sweeney, J. Lester, and H. Rangwala. Next-term student grade prediction. In Proc. IEEE Int. Conf. Big Data, pages 970–975, 2015.
- R. Tang and W. Sae-Lim. Data science programs in U.S. higher education: An exploratory content analysis of program description, curriculum structure, and course focus. Edu. Info., 32(3):269–290, 2016.
- J. Valenchon and M. Coates. Multiple-graph recurrent graph convolutional neural network architectures for predicting disease outcomes. In Proc. IEEE Int. Conf. Acoust., Speech, Signal Process. (ICASSP), pages 3157–3161, 2019.
- P. Wei, J. Zhao, and W. Mao. A graph-to-sequence learning framework for summarizing opinionated texts. IEEE/ACM Trans. Audio Speech Lang. Proc., 29:1650–1660, 2021.
- A. A. Yahya, A. Osman, A. Taleb, and A. A. Alattab. Analyzing the cognitive level of classroom questions using machine learning techniques. In Proc. 9th Int. Conf. Cognitive Sci., pages 587–595, 2013.
- Y. Zhang, R. An, S. Liu, J. Cui, and X. Shang. Predicting and understanding student learning performance using multi-source sparse attention convolutional neural networks. IEEE Transactions on Big Data, 2021.
- A. Zohar and Y. J. Dori. Higher order thinking skills and low-achieving students: Are they mutually exclusive? J. Learn. Sci., 12(2):145–181, 2003.
© 2022 Copyright is held by the author(s). This work is distributed under the Creative Commons Attribution-NonCommercial-NoDerivatives 4.0 International (CC BY-NC-ND 4.0) license.