ABSTRACT
Recommender systems in educational contexts have proven effective to identify learning resources that fit the interests and needs of learners. Their usage has been of special interest in online self-learning scenarios to increase student retention and improve the learning experience. In current recommendation techniques, and in particular, in collaborative filtering recommender systems, the quality of the recommendation is largely based on the explicit or implicit information obtained about the learners. On free massive online learning platforms, however, the information available about learners may be limited and based mostly on logs from website analytics tools such as Google Analytics. In this paper, we address the challenge of recommending meaningful content with limited information from users by using rating estimation strategies from a log system. Our approach posits strategies to mine logs and generates effective ratings through the counting and temporal analysis of sessions. We evaluate different rating penalty strategies and compare the use of per-user and global metrics for rating estimation. The results show that using the average number of lessons viewed per-user is better than using global metrics with a p-value under for 4 of our 5 hypotheses, showing statistical significance. Additionally, the results show that functions that penalize the rating to a lesser degree behave better and lead to a better recommendation.
Keywords
1. INTRODUCTION
The number of users enrolled in learning web platforms (i.e., MOOCs) [1] has a constantly grown in the last 8 years [2]. The recent COVID-19 pandemic has reinforced this phenomenon, and web virtual learning platforms are taking on an importance not previously seen. The pandemic forced learners, course designers and instructors to migrate to virtual environments where the learning content is mainly delivered in digital formats with a limited or none face-to-face interaction. Existing work have shown the importance of simple but effective virtual learning environments, which allow a progressive adaptation according to learners needs and preferences in order to keep their motivation and engagement [3, 4].
To adapt the learning environment and give meaningful content recommendations to learners, learning platforms should be able to profile the learner in terms of a set of features such as preferences, behaviors, or learning needs. A question then arises in this context: how to obtain relevant learners’ information? While more traditional approaches ask the learner directly through surveys and registration forms, modern approaches complement this explicit information with implicit data extracted from interactions with the platform (i.e., logs) [5, 6]. The amount and quality of information that can be extracted depends largely on privacy regulations, the administrator guidelines, and the platform technological capabilities. Therefore it is not unusual to find open virtual learning scenarios where the information collected and available about learners is limited. This is the case for the GCFGlobal learning platform.1
The GCFGlobal Learning Program objective is to teach different basic skills necessary for the 21st century, online, in an open modality, and without cost. According to GCFGlobal ’s Web page “gcfglobal.org" offers training in more than 40 topics, ranging from Microsoft Office and email usage to reading, math, and more. A GCFGlobal course contains several lessons. GCFGlobal offers more than 360 courses, counting for more than 6,400 lessons, more than 2,500 videos, and more than 50 interactive activities and games”. In 2021 the number of users who used the English, Spanish and Portuguese sites and visited at least one course was around 41 million. GCFGlobal establishes as a regulatory principle of its operation that access to their learning content has to be open to anyone in the world, and the only requirement is internet access. The courses are online, self-paced and self-directed (i.e., without a tutor). Registration and authentication on the platform is not mandatory and it is estimated that only 2% of users are registered, thus, there is no explicit information about learners (i.e., identity data). The information that is available comes mainly from the logs via Google Analytics tool. Google Analytics is a standard and popular tool used in e-commerce that has been also positioned itself as a useful tool in learning platforms [7, 8]. Its popularity is due to its ease of implementation and its capabilities to filter and analyze large volumes of logs. Although log analysis has limitations when it comes to identifying a user, it is the most likely type of data that can be found in any existing web-based platform.
In this paper, we present an empirical study for rating estimation from Google Analytics logs. These ratings express the preferences of the learners and allow the construction of recommender systems. Our evaluation is focused on how these ratings behave in a course recommendation scenario. The contributions of our work are summarized as follows. (1) Dedicated strategies for counting lessons seen by a user, and to process the timelines from logs. (2) A strategy to generate ratings that contemplate per-user and global metrics based on lesson counting. (3) A comparison of previous strategies in a course recommendation system.
2. RELATED WORK
A recommender system in a learning platform aims to identify the most interesting learning content for learners according to their preferences [9]. The most popular recommendation techniques described in the literature are collaborative filters (CF), content-based techniques (CB), and hybrid models that combine both CF and CB [10, 11, 12, 13]. CF uses information about the rating that learners assign to courses or learning content to generate a recommendation [14, Ch.3]. CF-based systems assume that if a learner has the same/similar rating as a learner on a course, is more likely to have the same/similar rating as on a different course [14, Ch.3]. CB filters use a course as the basis of the recommendation, rather than a learner. That is, a CB filter uses the characteristics of the course (i.e., descriptions, tags, content, topics, classifications) to make recommendations. CB filters use course characteristics to search for courses similar to those a learner has previously taken [13]. To address specific disadvantages of CF and CB models, hybrid models work on the idea of merging them to enhance the result.2
Existing work have shown the effectiveness of recommendation engines in learning platforms. For instance, Campos et al. [9] propose a CB filter that uses topic modeling for a big corpus of courses from different education platforms. Ma et al. [15] use a similar CB technique but their evaluation focuses on user experience and usability. Another common approach is to use of data mining techniques such as associate rules; for example Intayoad et al. [16] use classification algorithms and associate rules to create a system that exploits the learner’s content access history to propose recommendations.
Following the trend of e-commerce recommender systems, there is a recent increase of hybrid models use combining both CF and CB. A representative strategy in that trend is to use a CB model to manage the problem of the cold start and CF to take advantage of the information that is produced by learners in their interaction with the platform. CB models are used to recommend items for learning content for which there is not enough information for a CF strategy. For example, a course recommendation engine can use the CB model for new students, and a CF model for existing students [13, 10]. Wang et al. [12] use a similar hybrid technique with the DCBVN framework, where the model is built with a Variational Autoencoder Network combined with a CF model to generate recommendations. DCBVN considers the course difficulty and the skills of learners to generate the recommendations.
Yin et al. [11] use three models: CF, CB (using a topic classification technique), and a transition probability model to produce a single rating for a course. The transition probability model is used to manage the relationship of prerequisites between courses. Shanshan et al. [17] use a hybrid technique to generate recommendations with a CF model and an ontology to calculate similarities. This technique uses a cascade evaluation to refine the recommendation list with a rule association algorithm.
The aforementioned models often operate in rich information scenarios. In these scenarios, demographic information, evaluation results or perception surveys are available to facilitate the construction and evaluation of the recommender system. The problem of inferring ratings is not addressed to the extent that this information is explicitly provided by the learner.
3. METHODOLOGY
In this paper, we focus on the estimation of users results and their ratings for courses via a CF recommendation technique. CF requires a rating matrix to find similar learners. However, we do not have these ratings explicitly, therefore, it is necessary to infer them from Google Analytics logs. A course developed by GCFGlobal is composed of a set of lessons. The analysis of the number of lessons accessed by the learner and the associated session time are the basis for generating the rating. In the following we present the raw data extracted from Google Analytics and its processing, as well as the rating generation strategies.
3.1 Data processing
The logs in Google Analytics are consolidated under the concept of a session. Sessions are defined as the set of events generated by user’s actions within the platform without exceeding 30 minutes of inactivity.3 Due to the way the logs layer is deployed, we have to assume that the same user accesses the platform through the same device. This statement is true in most cases and allows us to group sessions in a timeline per user. We are interested in the “PageView" event that provides the URL of the page that the user accesses. The page URLs in the learning platform are defined by a unique path for each course-lesson pair, which allows us to identify the course and lessons related to a “PageView" event; URL paths are as “language/course/lesson/additional-params".
We use two filters to select users and lessons from Google Analytics. The first filter removes sporadic users, keeping users with at least 30 sessions during the year (2021-01-31 to 2022-01-31). The second filter ensures that the sessions belong to at least three different courses. This filter allows us to guarantee the future construction of the dataset and ground truth to evaluate the recommendation system. We use at least two courses to build the ratings for the collaborative filter and the third one for its evaluation. It is important to mention that the temporality of the sessions is taken into account in the construction of the dataset. The first two courses in temporal order are used in the construction of the collaborative filter and the last seen was used to evaluate the recommendation. We also consider the session time factor for lesson counting as explained in the following.
After building a base of users and sessions, we proceed to perform the pre-processing steps described in Figure 1. In step 1, the base of users and sessions extracted from Google Analytics is loaded into a local database in order to be able to perform transformations on the data in an easy and efficient way. In step 2, the timestamp column is transformed and standardized in such a way that the records can be ordered from the most recent session to the most distant. As mentioned previously, this allows us to identify the chronological route that the user made through the courses and their lessons. In step 3, we identify the time spent by the user in each lesson (“ lesson duration"). Step 3 is not trivial as the different sessions in which the same lesson is visited must be reconciled. An intra-lesson analysis is performed first, followed by an inter-lesson consolidation.
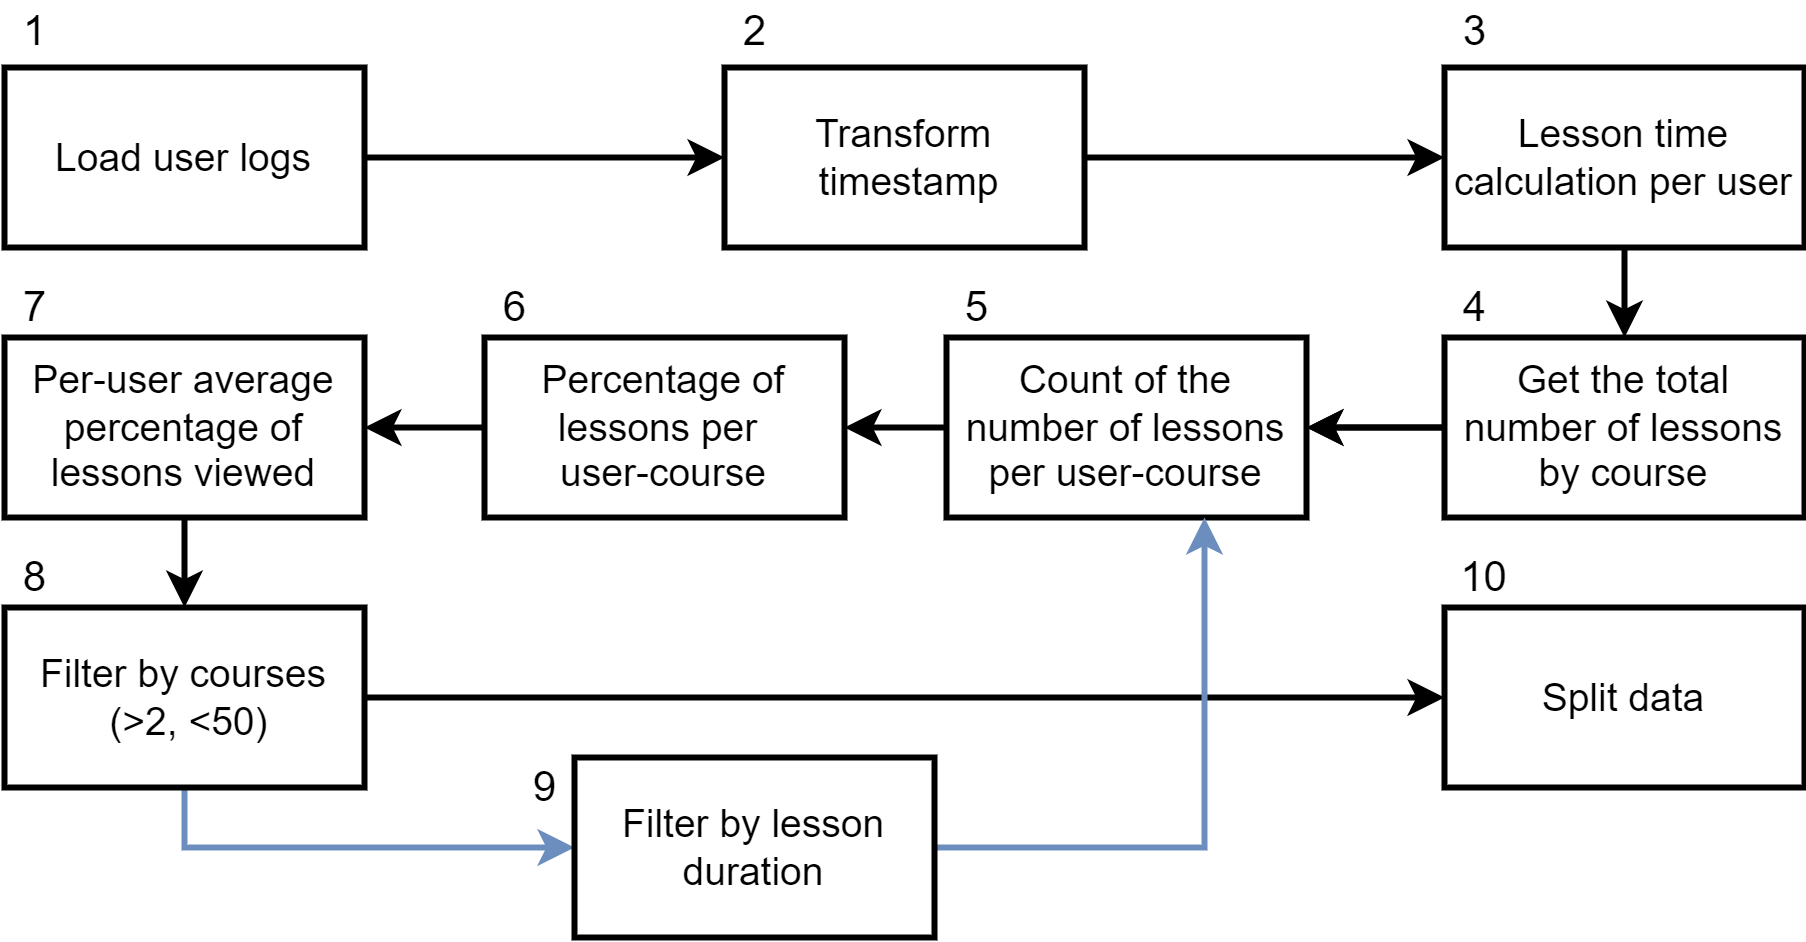
In the intra-session analysis, the time that a user spent in lessons of the same session is extracted. The time is calculated as the difference between the timestamp of the “PageView" event of the lesson URL and the immediately following event timestamp if it exists. In the case that the session ends with a visit to a lesson and there is no subsequent event for the calculation, we use imputation using the average lesson time over all users. For lessons with multiple visits in the same session, the times obtained were added. Table 1 shows an example of the calculation of the time spent in the lessons within the same session. Being the last event of the lesson, the time of lesson “D” is imputed using the average duration of the lesson over all users. Then an inter-lesson level analysis is carried out where the times of the lessons that were visited in different sessions are added to consolidate a total “lesson duration" per user.
| Lesson | Timestamp | Time Spent (min) |
|---|---|---|
| A | 2021-01-29 08:49:01 | 20 |
| B | 2021-01-29 09:09:01 | 18 |
| C | 2021-01-29 09:27:01 | 21 |
| D | 2021-01-29 09:48:01 | 17 |
In steps 4 and 5, the number of lessons that make up each course is consolidated, then, for each user-course combination, the number of lessons viewed is counted. With these results, in step 6, the percentage of lessons viewed is calculated per user-course. In step 7, the percentages obtained in step 6 are averaged to obtain a per-user metric of the percentage of lessons viewed.
In step 8, users who have seen lessons from more than 50 courses are removed. These are considered outliers because they are more than three standard deviations from the mean [18, p.19]. A total of 4 users were removed, one of them with a total of 131 courses viewed. Considering the minimum 3 courses filter explained at the beginning of this section, our dataset only contains users who have seen courses in the range (2,50).
In step 9, we add a filter to the count made in step 5 according to the user’s lesson duration. Lessons below a stipulated time will not be considered. The exclusion of lessons by duration is controlled by a parameter, and the effect of this parameter is evaluated in the experimentation. Our hypothesis is that the inclusion of this filter will allow discarding lessons that a user addressed lightly and possibly incompletely, thus improving the results of the recommendation.
Finally, in the last step (step 10), we split the data into a subset for training (i.e., construction of the collaborative filter) and another for testing. The split maintains the temporal order, therefore, the test set always has courses viewed after those in the training dataset per user. We use the first 70% of the courses for building the collaborative filter and the last 30% for evaluation. In the worst case when a user has only seen three courses, two will be used for training and one for evaluation.
3.2 Rating Estimation
As mentioned above, these ratings are essential for the construction of the collaborative filter [14, Ch.2]. In this section, we explain how we estimate these ratings. Our hypothesis is that the number of lessons accessed by a user in a certain course is an expression of the level of liking of a learner for it. Being open courses where the courses and lessons are approached by the will of the learner, it seems valid to assume that the perception about a course is reflected in the number of lessons taken by the learner.
To estimate ratings we use a threshold between 0 and 5, common in recommender systems [14, Ch.2]. Courses with a percentage of lessons viewed above a threshold will obtain the maximum grade (5), and those that are below will be penalized according to a penalty function. We use two threshold metrics: (1) the average percentage of lessons viewed per course by a user (per-user metric), and (2) the overall average percentage of lessons viewed per course for all users (global metric). These two metrics are inspired by the different ways of calculating similarities [14, Ch.2], where knowing if a rating is above or below the average is considered more valuable than the rating itself. It is known that user ratings in different domains tend to be very close to the average. While a rating in the middle does not say much, a rating far from it is a clear indication of like or dislike.
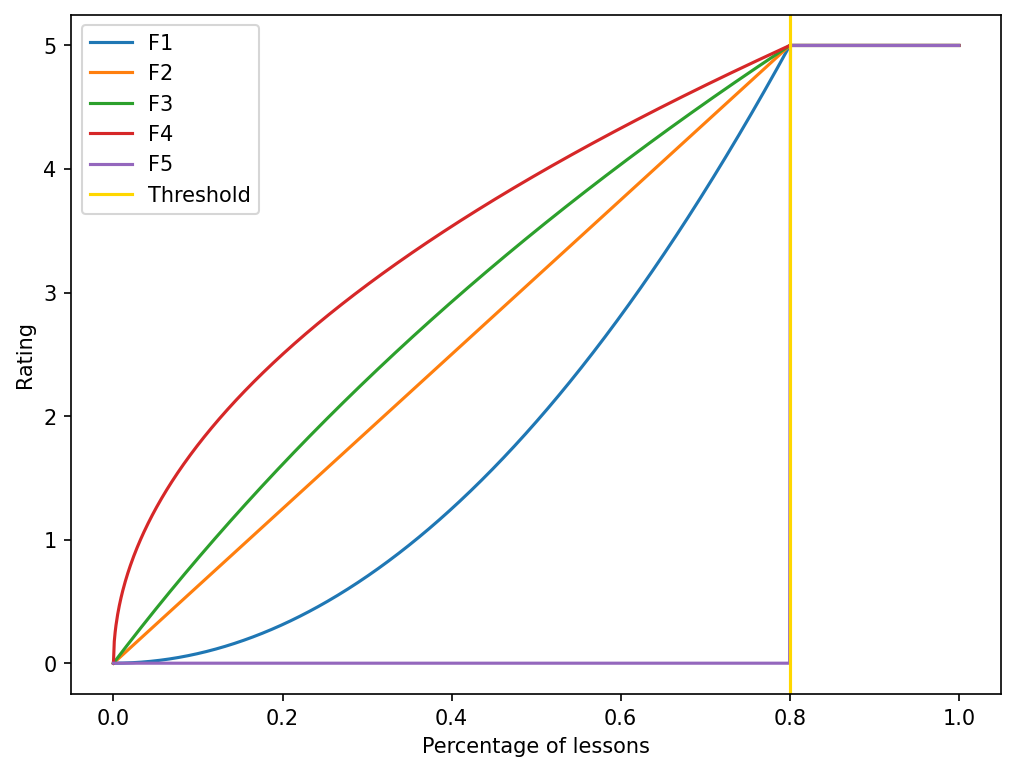
For the rating penalty, 5 different functions will be evaluated: logarithmic, square root, quadratic, linear, and step (Equations 1 to 5). The combination of thresholds and penalty functions give us 10 different ways of calculating the ratings.
(1) (2) (3) (4) (5)
3.3 Collaborative Filter
We use a classic collaborative filter approach since our objective is to evaluate the effect of the rating generation strategies on the recommendation as well as the temporal analysis in the filtering of the lessons.
Our collaborative filter uses the turicreate python library that
implements an item-based CF. We use cosine similarity to
identify similar courses based on ratings (Equation (6)).
where is the set of users who rated item , and is the set of users who rated both items and .4The library has a default threshold of 0.001 where users with a lower similarity coefficient are excluded when making the rating prediction.
3.4 Evaluation setup
In step 10 of the data processing flow (Figure 1), the dataset is built using 70% of the courses for training and the remaining 30% for evaluation. Given that the average number of courses viewed by each user in our dataset is 6.64, in the average case, there are four courses for the construction of the collaborative filter and two for its evaluation.
The performance of the recommender system was evaluated by precision at (), a typical metric for the evaluation of Top-N recommender tasks [10, 11, 19, 20]. We found in the literature that a value of usually used in recommender systems in learning environments is [10, 11]. A higher number of recommendations could overwhelm the learner, in particular in partially known domains of knowledge, and a lower number could include elements that are not diverse. However, the use of for evaluation poses a challenge to the extent that in our dataset most of the users do not contain 5 relevant courses in the evaluation set. To avoid an overpenalization in the calculation of the , we define the k per user in the range according to the number of courses in the test set. The results reported are the average over all users. A Wilcoxon rank-sum test with the Bonferroni correction was used for all our statistical significance tests ().
4. RESULTS
After processing the data, 56466 sessions were obtained, a total of 7071 users extracted, and 230 different courses were considered from the GCFGlobal learning platform. Table 2 presents the results obtained using the rating strategies explained in Section 3.2.
| Penalty Function | Threshold Strategy | Precision @ 5 |
|---|---|---|
F1 (Quadratic) | PU | 0.3928 |
| GPC | 0.3923 | |
F2 (Lineal) | PU | 0.3759 |
| GPC | 0.3711 | |
F3 (Logarithmic) | PU | 0.3783 |
| GPC | 0.3753 | |
F4 (Square root) | PU | 0.3911 |
| GPC | 0.3824 | |
F5 (Step) | PU | 0.1677 |
| GPC | 0.0526 |
The results suggest that a custom threshold (PU: per-user) is better than a global one (GPC). However, it is not conclusive on the use of penalty functions. To identify if there are significant differences in the precision obtained by different combinations of penalty functions and threshold strategies, we built a set composed of 100 sample. Each sample is built by selecting randomly 3000 users from the total set of users (i.e., ). Then, we repeat the process of building and evaluating the recommendation engine. In Table 5, we present the average precision obtained per penalty function over the 100 experiments. As can be seen in the table, a similar behavior where the custom threshold (PU) and a square root function (F4) lead to a better recommendation results. Regarding the penalty functions, a very interesting behavior is evident: the lower the penalty, the better the recommendation. Figure 2 shows the penalty functions for a particular threshold from which it is possible to identify that there is a correspondence between the order in the results F4(best)-F3-F2-F1-F5(worst) and the penalty degree of the function.
We perform a statistical significance via Wilcoxon rank-sum test where the null hypothesis is that the obtained by the two threshold metrics have the same distribution. The alternative hypothesis is that the distribution of obtained by one metric is stochastically greater than the distribution of the other. We repeated this test for each penalty function, therefore a total of 5 hypotheses were evaluated. The results of the tests for each penalty function are shown in Table 3. Our first relevant finding is that the results obtained by a custom threshold (PU) are statistically significant in most cases. Only for the quadratic function, the null hypothesis was not rejected.
We repeat a similar test but for the penalty functions. Using PU as the threshold, we test if the results obtained via F4 are statistically significant in comparison with the others penalty functions. The test results are reported in Table 4 and show that results obtained via F4 are statistically significant compared to all other functions except again for the quadratic function.
| Penalty Function | -value () |
|---|---|
| F1 (Quadratic) | 0.448 |
| F2 (Lineal) | 5.273e-32 |
| F3 (Logarithmic) | 9.649e-32 |
| F4 (Square root) | 5.750e-32 |
| F5 (Step) | 1.261e-34 |
| Penalty Functions | -value () |
|---|---|
| F4 (Square root) vs F1 (Quadratic) | 0.033 |
| F4 (Square root) vs F2 (Lineal) | 7.837e-09 |
| F4 (Square root) vs F3 (Logarithmic) | 8.400e-05 |
| F4 (Square root) vs F5 (Step) | 1.261e-34 |
| Penalty Function | Threshold Strategy | Avg. Prec. @ 5 |
|---|---|---|
F1 (Quadratic) | PU | 0.225 |
| GPC | 0.225 | |
F2 (Lineal) | PU | 0.239 |
| GPC | 0.214 | |
F3 (Logarithmic) | PU | 0.241 |
| GPC | 0.218 | |
F4 (Square root) | PU | 0.246 |
| GPC | 0.223 | |
F5 (Step) | PU | 0.09 |
| GPC | 0.03 |
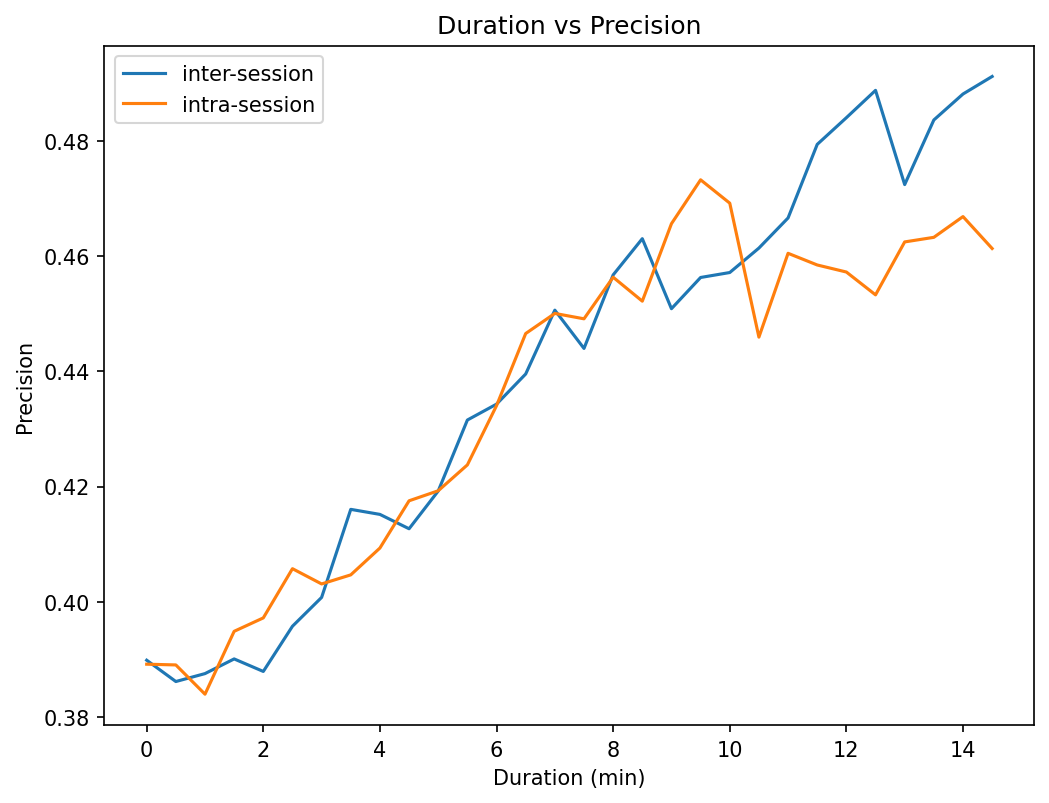
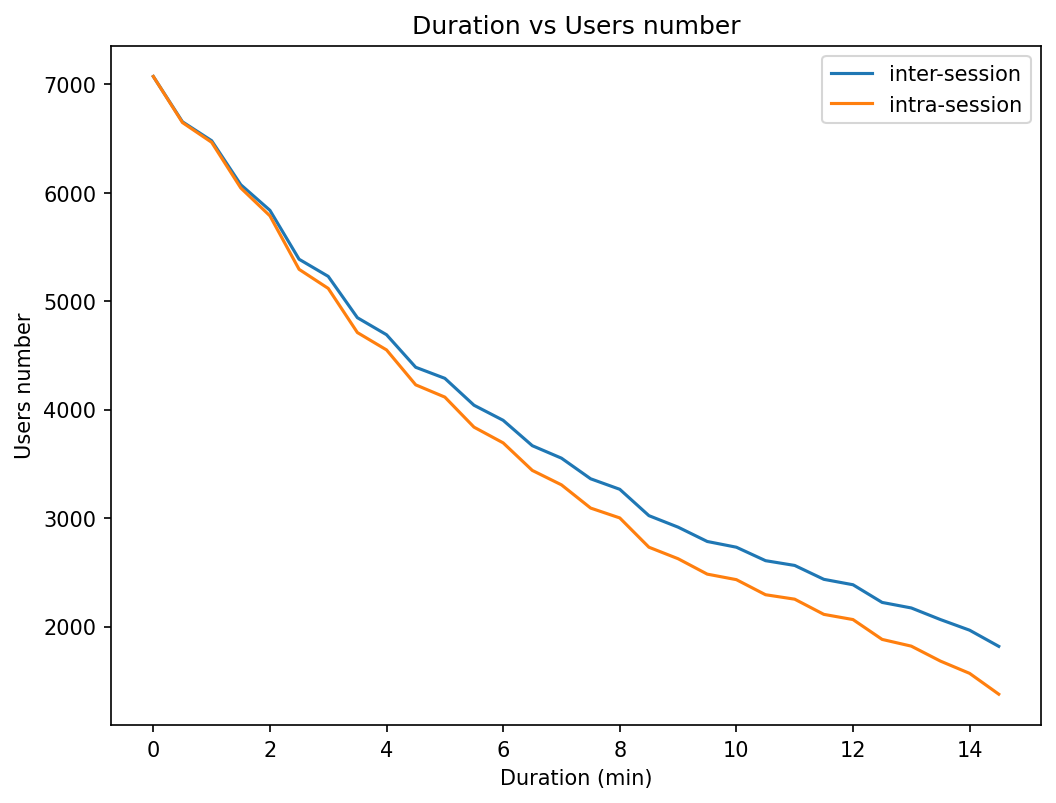
Our final experimentation is related with the lesson duration (i.e., Step 9 in Figure 1). We want to see the effect on the recommendation precision of adding a lesson duration filter prior to counting and calculating the percentage of lessons viewed. The filter removes lessons with a duration less than value. We use PU as threshold metric and F4 as penalization strategy. Figure 3 shows the results obtained as the filter becomes more restrictive. One of the consequences is that as the minimum lesson duration time is restricted, the size of the dataset is reduced. This means that after applying the filter there are users with less than 3 courses and they are thus removed from the analysis. Figure 4 shows how the size of the number of users decrease with the increase of the lesson duration filter.
5. DISCUSSION AND FUTURE WORK
In relation to penalization functions, we observe that less penalty lead to a better recommendation. This indicates that a low number of lessons viewed per course cannot be directly related to low preference. Being open learning resources where the learning process is self-directed, there are many other variables that can affect the non-continuity in the learning process that are impossible to identify in our context (i.e., learning priorities, time, health). It should also be taken into account that since it is an implicitly extracted rating, it is to be expected that it does not accurately reflect the user’s preferences. We also conclude that the F4 (square root) penalty function leads to better recommendation results, and there is statistical significance concerning F3, F2, and F5.
The experiments suggest that a per-user metric works better than a global metric. This result is not surprising to us as using a custom metric for each user should better reflect their behavior and therefore their preferences. Despite this, keeping this metric updated is a process that can be exhausting in a productive environment, since it must be recalculated for each new interaction with a lesson. The global is expected to fluctuate less and can be recalculated every certain time interval.
Regarding the duration of the lesson, the figures show the more restrictive the filter is, the better is the recommendation precision. This behavior is independent of the way the session is processed (i.e., inter vs intra). We attribute this result to the fact that the lesson duration filter reduces the data set to users for which we have (1) more information (i.e., more lesson interactions), and (2) more precision in the rating calculation. As users spent more time going through the lessons, it is more likely that those lessons were of interest to them. In consequence, we can conclude that the rating estimation strategy based on course lesson completeness better reflects the preferences of learners with greater lesson duration times.
There is a wide range of future work that we want to address based on the results presented in this paper. Now that we have found an appropriate strategy to build the ratings from logs, we want to explore more advanced techniques for building the CF engine such as matrix factorization strategies and recent deep learning approaches [21, 22]. We also want to explore hybrid recommendation techniques that combine CF and CB making use, on the one hand, of textual descriptions of lessons and on the other hand, on semantic descriptions that can be enriched via knowledge graphs [23].
6. CONCLUSION
This paper addresses the problem of course recommendation under limited information scenarios. We posit a process for course rating estimation based on log information for a CF-based recommender system. Our strategy to exploit the limited information available in logs uses the combination of: (1) the percentage of the lessons accessed in a course, (2) a threshold definition, and (3) different penalty functions to estimate the learner perception about the course. Then, we evaluate the influence of the duration of a user in a lesson in the definition of the rating.
As a threshold, we found that a personalized average per-user is better than a global one. Regarding penalty functions, F4 present the best results, and in general we found that the functions that penalize to a lesser degree lead to a better recommendation. Finally, we found that “lesson duration" plays an important role to improve rating estimation. The more demanding the "lesson duration" filter better our rating estimation and the recommendation precision. However, using the lesson duration as a filter has the side effect of reducing the number of users in the dataset because a great number of lessons access records are discarded.
7. ACKNOWLEDGMENTS
The authors would like to thank GCFGlobal Learning Program for funding this project, its continuous interest in improving its learning services, and its support in consolidating the dataset used in this paper.
References
- Byeongwoo Kang. How the covid-19 pandemic
is reshaping the education service, 2021. URL
https://doi.org/10.1007/978-981-33-4126-5\_2. - Annisa R Sari, Curtis J Bonk, and Meina Zhu. Mooc
instructor designs and challenges: what can be learned
from existing moocs in indonesia and malaysia? Asia
Pacific Education Review, 21:143–166, 2020. ISSN
1876-407X. doi: 10.1007/s12564-019-09618-9. URL
https://doi.org/10.1007/s12564-019-09618-9. - Marhainis, Ismail Wan Saiful Azzam Wan, Arifin Noorfadzilah Zakaria Ibhrahim, and Jamaludin. Measuring user’s usage intentions on e-learning portal. In Janudin, Aziz Anealka, Alias Nor Aziah Luaran Johan Eddy, and Sardi, editors, Envisioning the Future of Online Learning, pages 347–357. Springer Singapore, 2016. ISBN 978-981-10-0954-9.
- Maria José Sousa and Álvaro Rocha.
Learning analytics measuring impacts on organisational
performance. Journal of Grid Computing, 18:563–571,
2020. ISSN 1572-9184. doi: 10.1007/s10723-018-9463-1.
URL
https://doi.org/10.1007/s10723-018-9463-1. - Si Na Kew, Zaidatun Tasir, S N Kew, and Z Tasir.
Learning analytics in online learning environment:
A systematic review on the focuses and the types
of student-related analytics data keywords learning
analytics · online learning environment · student-related
analytics data · intervention · educational data mining.
URL
https://doi.org/10.1007/s10758-021-09541-2. - Javaria Hassan, Jovin Leong, and Bertrand
Schneider. Multimodal data collection made easy:
The ez-mmla toolkit: A data collection website
that provides educators and researchers with easy
access to multimodal data streams. pages 579–585.
Association for Computing Machinery, 2021. ISBN
9781450389358. doi: 10.1145/3448139.3448201. URL
https://doi-org.ezproxy.uniandes.edu.co:8443/10.1145/3448139.3448201. - Daniel Brandon. Google analytics. J. Comput. Sci. Coll., 34:81–82, 4 2019. ISSN 1937-4771.
- Loveleen Gaur, Gurinder Singh, Jeyta, and
Shubhankar Kumar. Google analytics: A tool to
make websites more robust. In Proceedings of the
Second International Conference on Information and
Communication Technology for Competitive Strategies.
Association for Computing Machinery, 2016. ISBN
9781450339629. doi: 10.1145/2905055.2905251. URL
https://doi-org.ezproxy.uniandes.edu.co:8443/10.1145/2905055.2905251. - Rodrigo Campos, Rodrigo Pereira dos Santos, and
Jonice Oliveira. A recommendation system based on
knowledge gap identification in moocs ecosystems. In
XVI Brazilian Symposium on Information Systems.
Association for Computing Machinery, 2020. ISBN
9781450388733. doi: 10.1145/3411564.3411572. URL
https://doi-org.ezproxy.uniandes.edu.co:8443/10.1145/3411564.3411572. Tener en cuenta el esquema de evaluación, puede servir para la parte del modelo basado en contenido o en general. - Zhengjun Pan, Lianfen Zhao, Xingyu Zhong,
and Zitong Xia. Application of collaborative
filtering recommendation algorithm in internet
online courses. In International Conference
on Big Data and Computing, pages 142–147.
Association for Computing Machinery, 2021. ISBN
9781450389808. doi: 10.1145/3469968.3469992. URL
https://doi-org.ezproxy.uniandes.edu.co:8443/10.1145/3469968.3469992. En general presenta como generar el modelo de filtrado colaborativo mejorando su arranque en frio con un modelo basado en contenido, la entrada no es muy clara. - Shengjun Yin, Kailai Yang, and Hongzhi Wang. A mooc
courses recommendation system based on learning
behaviours. In Proceedings of the ACM Turing
Celebration Conference - China, pages 133–137. ACM,
5 2020. ISBN
9781450375344. doi: 10.1145/3393527.3393550. URL
https://dl.acm.org/doi/10.1145/3393527.3393550. - Chao Wang, Hengshu Zhu, Chen Zhu, Xi Zhang,
Enhong Chen, and Hui Xiong. Personalized
employee training course recommendation with
career development awareness. In Proceedings
of The Web Conference, pages 1648–1659.
Association for Computing Machinery, 2020. ISBN
9781450370233. doi: 10.1145/3366423.3380236. URL
https://doi-org.ezproxy.uniandes.edu.co:8443/10.1145/3366423.3380236. - Jun Xiao, Minjuan Wang, Bingqian Jiang, and Junli Li.
A personalized
recommendation system with combinational algorithm
for online learning. Journal of Ambient Intelligence
and Humanized Computing, 9:667–677, 2018. ISSN
1868-5145. doi: 10.1007/s12652-017-0466-8. URL
https://doi.org/10.1007/s12652-017-0466-8. - Charu C. Aggarwal. Recommender
Systems. Springer International Publishing,
2016. ISBN 978-3-319-29659-3. doi:
10.1007/978-3-319-29659-3\_6. URL
http://link.springer.com/10.1007/978-3-319-29659-3. - Boxuan Ma, Min Lu,
Yuta Taniguchi, and Shin’ichi Konomi. Courseq: the
impact of visual and interactive course recommendation
in university environments. Research and Practice
in Technology Enhanced Learning, 16:18, 2021. ISSN
1793-7078. doi: 10.1186/s41039-021-00167-7. URL
https://doi.org/10.1186/s41039-021-00167-7. - Wacharawan Intayoad, Till Becker, and Punnarumol
Temdee. Social context-aware recommendation for
personalized online learning.
Wireless Personal Communications, 97:163–179, 2017.
ISSN 1572-834X. doi: 10.1007/s11277-017-4499-2. URL
https://doi.org/10.1007/s11277-017-4499-2. - Shang Shanshan, Gao Mingjin, and Luo Lijuan. An
improved hybrid ontology-based approach for online
learning
resource recommendations. Educational Technology
Research and Development, 69:2637–2661, 2021. ISSN
1556-6501. doi: 10.1007/s11423-021-10029-0. URL
https://doi.org/10.1007/s11423-021-10029-0. - Ihab F. Ilyas and Xu Chu. Data Cleaning. Association for Computing Machinery, New York, NY, USA, 2019. ISBN 9781450371520.
- TongXin Liao, XinHui Feng, YuanLi Sun,
HongTing Wang, Cong Liao, and YuanBing
Li. Online teaching platform based on big
data recommendation system. pages 35–39.
Association for Computing Machinery, 2020. ISBN
9781450375757. doi: 10.1145/3411681.3412951. URL
https://doi-org.ezproxy.uniandes.edu.co:8443/10.1145/3411681.3412951. - Rubén Manrique and Olga Marino. Knowledge
graph-based weighting strategies for a scholarly paper
recommendation scenario.
In Workshop of Knowledge-aware and Conversational
Recommender Systems RecSys, KaRS’18, 2018. URL
https://www.w3.org/TR/sparql11-property-paths/. - Le Wu, Xiangnan He, Xiang Wang, Kun Zhang, and Meng Wang. A survey on accuracy-oriented neural recommendation: From collaborative filtering to information-rich recommendation. IEEE Transactions on Knowledge and Data Engineering, pages 1–1, 2022. doi: 10.1109/TKDE.2022.3145690.
- Dheeraj Bokde, Sheetal Girase, and Debajyoti
Mukhopadhyay. Matrix factorization model in
collaborative filtering algorithms: A survey. Procedia
Computer Science, 49:136–146, 2015. ISSN 1877-0509.
doi: https://doi.org/10.1016/j.procs.2015.04.237. URL
https://www.sciencedirect.com/science/article/pii/S1877050915007462. Proceedings of 4th International Conference on Advances in Computing, Communication and Control (ICAC3’15). - Christian Grévisse, Rubén Manrique, Olga Mariño, and Steffen Rothkugel. Knowledge graph-based teacher support for learning material authoring. In Jairo E. Serrano C. and Juan Carlos Martínez-Santos, editors, Advances in Computing, pages 177–191, Cham, 2018. Springer International Publishing. ISBN 978-3-319-98998-3.
1GCFGlobal learning platform:https://bit.ly/3tBpGa5
2A discussion of the advantages and disadvantage of CB and CF is given by Xiao et al. [13]
3Google Analytics forum: https://bit.ly/3IRlAAY
4Turicreate documentation: https://bit.ly/3y0vJsx
© 2022 Copyright is held by the author(s). This work is distributed under the Creative Commons Attribution-NonCommercial-NoDerivatives 4.0 International (CC BY-NC-ND 4.0) license.