ABSTRACT
The complex and dynamic nature of collaboration makes it challenging to find indicators of productive learning and quality collaboration. This exploratory study developed a collaboration metric to capture temporal patterns of joint attention (JA) based on log files generated as students interacted with an immersive astronomy simulation using augmented reality headsets and tablets. JA is defined as the ability to coordinate attention, which thus plays an important role in collaborative problem-solving to build the common ground for knowledge co-construction. We first developed a JA metric consisting of six distinct but closely relevant states as a measure of the collaboration process. We then conducted descriptive statistics to compare frequency and temporal pattern of JA states across three learning performance groups. Our results showed that high-learning-gain groups demonstrated visual coordination behaviors more frequently and utilized this collaboration strategy in the early stage. We then investigated sequences of these JA states, focusing on one key behavior: long and consistent shared view as a proxy for collaboration. This sequential analysis revealed two different collaboration profiles: attention follow-leader and turn takers, suggesting the existence of asymmetrical participation. Our findings indicate the potential of JA metric to predict overall collaboration quality, identify undesirable collaboration behaviors, and serve as an early warning to provide just-in-time guidance.
Keywords
INTRODUCTION
Collaborative problem-solving (CPS) is considered a core competency of the 21st century [14]. CPS refers to the capacity of an individual to solve a problem by sharing their knowledge, skills, and efforts with two or more people [26]. CPS provides opportunities for learners to develop the cognitive and social skills required for effective collaboration. Computer-supported collaborative learning (CSCL) environments are thus designed to facilitate this joint activity by allowing individuals to monitor collaborative progress, accommodate different perspectives, and develop a solution (e.g., [24]).
As more advanced technologies such as augmented reality (AR) emerged, there have been some challenges to understanding how students use the technologies and further how technological features need to be designed to support the students’ CPS process [17]. Such learning platforms provide every student with immersive learning experiences in a classroom setting; yet it is challenging to understand their collaboration process due to the complexity (e.g., [38]). Exploring novel ways to understand collaborative learning in immersive learning environments becomes critical. In this regard, this exploratory study investigates joint attention (JA) as a proxy for collaborative behaviors in a multi-device collaborative learning platform.
JA has been studied to understand how students coordinate attention to build shared understanding in collaborative tasks. Existing studies have focused mainly on joint visual attention (JVA) using eye-tracking data and showed correlations between JVA and collaboration quality [33, 34]. However, most studies considered moments of joint visual attention (JVA) as a binary variable, which may be insufficient to capture the complex process of collaboration. We therefore developed a JA metric consisting of six distinct but closely relevant states as a measure of the collaboration process. More specifically, we investigated JA states as preliminary evidence to understand how students coordinate attention across different types of devices (AR headsets, tablets) and identify collaboration patterns that may contribute to learning gains in CPS.
Relevant Work
CPS in immersive learning environments
CPS refers to the process when students attempt to form a shared understanding and co-construct knowledge by working on a common problem or project known as the joint problem space [32]. Advanced educational technologies like AR emerged as a medium for immersive collaborative simulations [11]. This technology brings new affordances and challenges for students to participate in CPS and for researchers to understand CPS behaviors.
Studies have suggested that immersive learning environments enhance face-to-face interaction and collaboration [39], support collaborative inquiry learning [37], and facilitate collaborative knowledge construction [21]. Pervasive AR headsets and mobile-AR systems enhance social interactions in the sense that students can collaborate through both digital devices and face-to-face interactions [4]. Immersive technologies also create a sense of immersion [9] that contributes to an authentic learning experience [39]. From this perspective, immersive learning environment fosters collaborative learning and problem-solving as it affords a dual interaction space: (1) the social interaction space through both face-to-face communication and interactions enabled by the device, and (2) the cognitive problem space by proving a simulated or 3D object that students can respond to and build knowledge on.
However, an immersive learning environment also brings challenges when it comes to understanding students’ learning and collaboration processes. Given the immersive nature of this environment, it often requires expensive monitoring devices such as eye trackers, motion trackers, and video cameras to understand how students utilize these technologies [10]. How students navigate multiple representations in such an environment remains unexplored, and there is limited evidence suggesting how the navigation and exploration patterns generate learning opportunities [1]. Another challenge lies in the lack of peer awareness in immersive learning environments [7, 17], in which students are not aware of their peers’ actions when they explore and solve tasks. An analysis of how they coordinate their attention and manipulate virtual objects to build close connections between social and cognitive problem space is fundamental to the understanding of the CPS in immersive learning.
Understanding CPS Using Log Data
Log data offers a particular advantage to examine the complex nature of human interactions in CSCL environment. While traditional quantitative methods rely on outcome variables and static variables from subjective measures, log data enables the analysis of collaboration as a dynamic process. It can capture sequences of actions and events, and thus provide an opportunity to examine collaborative learning from a process perspective. A common and significant characteristic of sequential analysis is its emphasis on the interrelations between actions over time instead of the presence or absence of the actions in isolation [20]. The application of sequential mining approaches has proven successful to identify interaction patterns differentiating low and high-achieving groups [22, 40], discover problem-solving modes in pair programming [31], identify navigation behavior patterns in the CPS process [19], and understand how regulation processes unfold over time in group work [12].
The benefits of sequential analysis are further reflected by Han et al. [15]. The authors point out the necessity to examine time-related factors when implementing collaboration analytics, as characteristics of collaboration such as coordination between group members may differ over time. Temporal aspects like sequence provide a unique perspective to understand CPS as a complex and dynamic process. However, most research efforts focused on exploring CPS supported by single platform (e.g., online learning platforms, ITS, multi-touch tablets, interactive whiteboard). There is much less research on how to discover and analyze patterns of interactions when students collaborate across multiple devices [10].
Joint Attention and Collaboration
One of the potential proxies for collaboration is JA, which is defined as “the ability to coordinate attention toward a social partner and an object of mutual interest” [3, 25]. Solving problems together requires students to share ideas and build a mutual understanding of problem-solving rules, in which students help each other think through the problem [7, 15, 28]. If JA is not achieved between partners, it is less likely for them to regulate their attention and build the necessary common ground for further discussion, and actively contribute to problem-solving. In this regard, JA is closely related to productive collaboration [27]. A prototypical example of JA involves visual synchronization, which refers to JVA—the mutual coordination of eye gaze [6]. JVA was first introduced by Scaife and Bruner [6] to study the focus of attention in infants and has been studied to understand collaboration dynamics. Previous research mainly used mobile eye-trackers to measure JVA and found correlation between JVA and dyad productivity [18], collaboration quality [33], and other outcome measures like learning gains and task performance [34]. Although these findings demonstrated the potential of JVA to serve as a proxy for quality collaboration, high-level JVA moments may hide unbalanced participation known as the free-rider effect, suggesting the partner dominance in terms of gaze initiation [34]. Schneider and Pea [33] categorized this dyad as leader and follower, inspired by four collaboration profiles that students assume [35]: turn takers, driver-navigator, driver-passenger, and independent. This asymmetrical collaborative pattern was found negatively correlated with learning gains, as students who less frequently initiate and respond to joint objects benefit less from JVA moments. This finding points out limitations of JVA as it may hide undesirable collaboration mode and thus insufficient to measure collaboration quality.
Another limitation of existing literature is the perception of JVA as a binary and momentary event that students are either in or not in this state [18, 33, 34]. Relying on this binary classification, JVA may not accurately or sufficiently represent the process of collaboration considering its complex and dynamic nature. Siposova and Carpenter [36] argued that the jointness of attention comes in degrees rather than as arbitrary, discrete, and uniform events. They developed a systematic framework containing four levels of social attention (monitoring, common, mutual, and shared). According to their framework, attention levels are nested hierarchically and exist on a scale of jointness. It is important to distinguish between these levels as they may support different interactions and communications. To achieve a more comprehensive understanding of collaboration, it is necessary to investigate JA as a process consisting of interrelated states rather than a binary phenomenon.
Research Aim
To fill in these gaps, we conducted an exploratory study to investigate JA in a CPS process based on fine-grained log data in a multi-device immersive environment. We hope to go beyond the previous binary classification of JVA and provide insights into how students coordinate attention in the CPS process. Therefore, we designed a JA metric that consists of six different states, inspired by the spectrum of jointness framework [36]. We then explored the sequences of these states to characterize the process of attention coordination in CPS. Using a sequential analysis approach, we investigated the relationship between groups’ JA states and their learning gains. Our goal is to understand how CPS unfolds over time using a sequential analysis method. By extracting key collaboration patterns that potentially lead to quality collaboration and better learning performances, we hope to characterize dynamics of JA in the context of CPS. The research questions guiding our analysis are: (1) What are temporal patterns of joint attention that are indicators of collaborative problem-solving? and (2) How do these joint attention patterns vary across groups with different learning gains?
Methods
CEASAR
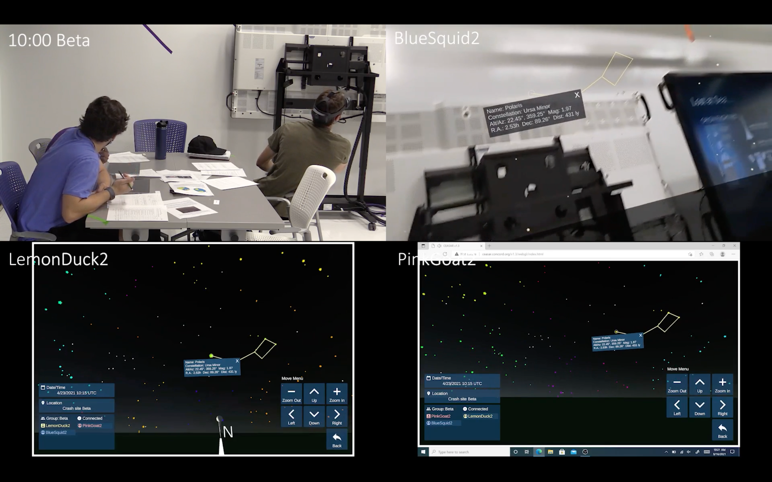
Connections of Earth and Sky with Augmented Reality (CEASAR) employed a digital planetarium simulation software designed to investigate collaborative learning in immersive augmented reality. CEASAR allows the exploration of the night sky through three scenes: Horizon (default), Earth, and Star. It simulates a first-person view of the night sky from a specific location and time. The Earth scene allows users to observe the entire Earth from space. Users can drop a pin on any location of the Earth’s sphere to change their location or obtain its coordinate. The Star scene provides access to the complete celestial sphere and cataloged western constellations. Users can shift between these three views, manipulate the location and simulation time, or change their direction of view to explore the sky. Since this platform was designed to support collaboration, annotations (e.g., mark a constellation) made in one device will be simultaneously visible to all users in the same group.
Participants and Tasks
This study involved 77 undergraduate students enrolled in an introductory astronomy course from a mid-western university in the United States. Students participated in three weekly one-hour sessions. The first two sessions helped students familiarize themselves with the simulation platform using gesture-controlled AR headsets (Microsoft HoloLens 2) and touch-based tablets. In the third session, 25 self-assigned groups of three to four solved a CPS task called “Lost at Sea”. Each group was provided with one AR device and two tablets. Students were expected to leverage these digital devices determine the location of a space capsule that has crashed somewhere on Earth. To complete the task, groups need to identify the hemisphere of their location, find the correct cardinal directions by identifying key stars or constellations as reference points, and estimate their latitude and longitude. Aside from the group task, students were required to complete individual pre- and post-paper-based assessments to measure their conceptual knowledge relevant to the task’s topic. Each assessment took about five minutes.
Data Source
This study explores the students’ collaboration patterns using data collected from video recordings of group work, screen recordings from the devices (Figure 1), and interactions with the simulation in the form of logs obtained from both AR and tablets. The interaction logs were recorded as rows of events, where event = {Username, Groupname, Device, Activity, Event, UTC time, Heading vectors, Simulation time, Crashsite, Location, Scene, Selected object, Selected star}. A new event was generated each time students moved their devices to change the direction of view, selected a star or constellation, chose a different scene, or manipulated the simulation time within the platform. In this study, we only focused on log features relevant to the identification of JA. The pre-/post-assessments contain one open-ended question to measure the students’ understanding of latitude and longitude calculation, which was scored by researchers from 0 to 2 based on the completeness and accuracy of students’ responses.
Data Processing
The following describes a multiple-step process of extracting JA states from raw log data.
Step1: Individual Inactivity Extraction This step filtered active episodes and prepared for further analysis at a second granularity. We defined 20 seconds as the threshold to distinguish active and inactive episodes. This time frame was chosen based on classroom recordings and previous study [22] showing that elapsed time beyond this threshold should be differentiated, beyond which the set of actions were perceived less relevant and supposed to belong to a different action episode. If students did not trigger any event within this 20-second time gap, subsequent seconds (i.e., from the 21st second) were labeled as inactivity until the next event. It is worth noting that during inactivity students may participate in off-task behaviors like idling or engage in task-relevant activities without using the devices, like paper sheet filling.
Step 2: Device Pair We then labeled the scene for each second, yielding a time series containing four types of scene values (Horizon, Earth, Star, and inactivity). Next, we combined the individual scene values to code the JA state of each device pair as inactivity, no overlapping, or scene overlapping. Inactivity means that neither device triggered any event within the 20-seconds time gap. No overlapping contains two possible situations: (1) two students explore the simulation in two different scenes (2) one student explores the simulation while the other is inactive. Both situations suggest a lack of JA as students engage in different activities or scenes. Scene overlapping represents that both students are in the same scene and observe the simulation from the same perspective. This initial coding created a state sequence for each dyad within a group, resulting in a total of three device pairs for each group (i.e., tablet1-tablet2, tablet1-HL2, and tablet2-HL2). We observed a tendency for groups to only use two devices most of the time. Considering all the dyad sequences may lead to misleading results as one device may not be used consistently and may look like a student was not engaging in the task and JA. Thus, we picked one dyad sequence that represents the whole group based on the level of participation (i.e., a dyad with the least number of inactivity and no overlapping states).
Step 3: Pair Scene Overlapping Coding This step extracted higher-level JA behavior (i.e., scene overlapping) in the horizon scene using the shared view (SV) metric (see details in [10]). SV metric tracks whether two devices’ screens overlapped, indicating students were looking at the same area of sky or celestial objects. This continuous value ranges from 0 to 1, representing the screen overlap ratio, where 1 indicates a perfect shared screen, and 0 means no overlap. By watching screen capture recordings (see Figure 1), we found that a SV value larger than 0.35 allows students to look at the same area and was thus used as the threshold to filter shared view state in Horizon scene. We also incorporated more contextual information to this state by characterizing it as ‘short’ and ‘long’ based on state duration. We chose 15 seconds as the delimiter based on our observations in terms of whether students were having a quick or in-depth longer discussion with their partners.
Step 4: Consistent State Extraction We then extracted consistent JA episodes longer than 5 seconds. Previous research pointed out that students need around 2 seconds to focus their attention on the object mentioned by their peers [30]. Considering our simulation platform requires students to manually move their screens and find the reference points or shift the scene, we set the threshold as 5 seconds. A state lasting 5 seconds or less was not sufficient to be counted as a consistent state as it may be generated by accident.
Finally, six mutually exclusive states (shown in Table 1) were identified. These states were ordered according to levels of participation and attention coordination; that is, three hierarchical levels. Each level may require varying amounts of effort to achieve attention coordination and visual synchronization. At the top level, we utilized a previously developed SV metric [10] to capture consistent screen overlapping behavior in Horizon. In the subsequent level, we focused on scene overlapping behavior in the Earth or Star scenes. The lowest level included no overlapping and inactivity state, which could be perceived as lack of JA. JA states in Horizon was differentiated from the other two scenes and perceived as the higher level for the following reason. The current calculation method of SV metric only applies to Horizon scene, which captures the moments when students looked at the same region of the simulated sky. This is typically achieved with the help of a reference star or constellation (see the marked constellation in Figure 1). Students need to move their screens or AR headsets to find the reference object first before achieving the visual synchronization in Horizon. For the other two scenes (Star and Earth), however, students only need to click the button to select the same scene. Therefore, the extra efforts required in Horizon may indicate more verbal communication to coordinate the screens to achieve synchronization. Considering the fact that JA states differ in the level of attention and coordination, overlapping in Horizon scene is more likely to represent a high-level, intentional coordination behavior to build a shared problem space.
JA State | Scenes | Description | |
|---|---|---|---|
Inactivity (INACT) | N/A | Both students do not trigger any event within the 20 seconds | |
No scene overlapping (NO) | All | Students explore in different scenes OR one is inactive | |
Scene overlapping in Earth or Star (SO_Earth/Star) | Earth and Star | Both students stay in Earth or Star scene | |
Scene overlapping in Horizon | No shared view in Horizon (SO_HZ_NO) | Horizon | Both students stay in the Horizon scene but no screen overlap |
Short-shared view (SO_HZ_SRT) | Horizon | a quick screen overlap (<15 seconds) | |
Long-shared view (SO_HZ_LNG) | Horizon | a long and consistent screen overlap behavior (>15 seconds) | |
Group Exclusion and Classification
We used pre- and post-assessment scores as an outcome measure of learning performance. Students wrote a short response explaining the multiple steps to complete the location calculation given the visible stars and constellations, which was graded as 0, 1, or 2 based on a rubric developed during a pilot study. We computed individual normalized gains (i.e., post − pre / post-max − pre) to obtain each group’s average normalized learning gains. Among 25 groups, the mean of normalized learning gains was 0.283 (SD = 0.290), and the median was 0.313. Six groups earned no or negative learning gains. For the rest, we conducted a median split and ended up with three performance groups: no-learning-gain (n = 6), low-learning-gain (n = 9), and high-learning-gain (n = 10). One group in no-learning-gain began with a full score in the pre-assessment and was removed given the ceiling effect. Four groups were removed as the students frequently shared only one device, making the logs unable to capture their collaborative behaviors. As such, a total of 20 groups were included for the further analyses: no-learning-gain (n = 4), low-learning-gain (n = 9), and high-learning gain (n = 7).
Analysis
Our analysis consists of two parts. First, we conducted descriptive analysis to compare aggregated values of JA states across the three learning performance groups. Examining the distribution of screen overlapping states across groups with different learning gains yields a preliminary understanding of the association between screen overlapping behaviors (i.e., JA states) and learning performance. Then we applied sequential analysis to search for patterns that characterize JA from a process perspective. Specifically, we looked at the transition probabilities between the six JA states to uncover more interesting patterns of collaboration dynamics. Two transition metrics were utilized to explore the state sequences: the Markov-chain model (MCM) and the L* metric.
MCM is a transition metric that calculates the conditional probability of one state following another based on the assumption that the occurrence probability of one state depends on the previous state. We used the TraMineR and seqHMM packages in R to build Markov models for our sequence data [13, 16]. Two important parameters in MCM are (1) the transition probabilities between the states and (2) the initial probabilities for each state. Transitions with higher probability within the sequence can be interpreted as common collaboration patterns to characterize the groups' JA dynamics. However, one limitation of MCM is the failure to take base rates into account (i.e., the initial probability of each state in the sequence). This may impact how we interpret transition probabilities and understand the relationship between states in the sequence.
We therefore applied L* metric as a complementary method. L* was chosen as the best metric for sequences without consecutive repetitive states according to the discussion in [5]. L* compares the actual occurrence probability with a calculated base rate, which is the transition probability assuming the states in the sequence are randomly ordered [23]. The use of base rates in the calculations of the L* metric makes it well suited for between-group comparison, while MCM is better suited for within-group comparison (i.e., comparison between two transitions of the same group). L* illustrates the degree to which transition between two states is more likely than in a randomly ordered sequence of states, given the base rates of each. The range of L* is (−∞, 1] where the negative value represents the specific transition is less likely to occur compared to the chance level, and 0 means this transition occurs as often as expected in a randomly ordered sequence.
Results
Descriptive Analysis
Table 2 presents the distribution of each state across three learning levels. It suggests no-learning gain group stayed either inactivity or no overlapping states most of the time. Comparably, high-learning-gain groups had more scene overlapping states. This difference suggests that high-learning-gain groups are more likely to demonstrate JA behaviors such as screen coordination to maintain mutual attention and construct a shared problem space for in-depth discussion. We also examined the temporal aspect of data. One interesting finding was the early adoption of collaboration strategies of high-learning-gain group. We compared the long-shared view state during the first 30 states, which roughly corresponds to the first twenty minutes. While five out of seven groups in the high-learning-gain groups demonstrate long-shared view in the early stage, only one in the no-learning-gain groups and three in the low-learning-gain group demonstrate long-shared view. These results suggest that high-learning-gain groups not only demonstrate more high-level JA behavior such as screen coordination but also tend to demonstrate this behavior in the early stage of collaborative problem-solving.
State | No Gain (n=4) | Low Gain (n=9) | High Gain (n=7) |
|---|---|---|---|
INACT | 14.78 | 14.57 | |
NO | 30.50 (47.7%) | 28.00 | 27.71 |
SO_HZ_NO | 9. 25 | 9.67 | 12.14 |
SO_Earth/Star | 2.75 (4. 2%) | 3.11 (4.7%) | 2.14 (3.3%) |
SO_HZ_SRT | 1.00 (1.6%) | 2.11 (3.5%) | 2.00 (3.1%) |
SO_HZ_LNG | 1.50 (2.3%) | 1.44 (2.6%) | 3.00 (4.9%) |
Note. aAverage number of states; bAverage proportion of each state within each group sequence.
Sequential Analysis
We further looked at transition probabilities between states to identify collaboration patterns able to differentiate learning groups (see Figure 2). We particularly focused on the transitions relevant to the long-shared view state (SO_HZ_LNG), which is a key collaborative behavior. An interesting difference was found in the transition probabilities between the long-shared view and the other two states: no overlapping (NO) and scene overlapping in Horizon (SO_HZ_NO). These two transition sequences represent two different JA patterns, indicating to what extent groups engage in collaborative participation (e.g., symmetrical to asymmetrical participation).
SO_HZ_LNG→NO indicates that only one student remained active and interacted with the platform after the end of a higher-level JA state (i.e., long-shared view). Meanwhile, another student no longer triggered any event. By looking at the session video recordings, we found this transition typically occurred when one student initiated the screen coordination and dominated the problem-solving processes, while another student was less engaged. SO_HZ_LNG→SO_HZ_NO suggests a more positive collaborative behavior where pairs remained in the same scene and actively interacted with the simulation platform after leaving the screen overlapping state. Although these pairs no longer looked at the same area of simulated sky, they both continued individual exploration in a shared problem space (i.e., the same scene). We observed that this transition typically occurred when students ended discussion around the reference stars and went back to individual exploration in the same scene.
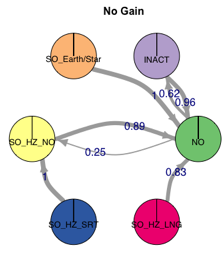
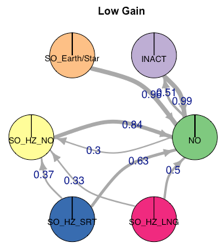
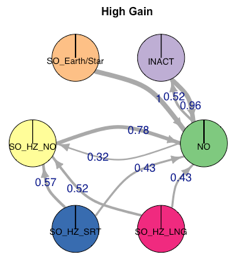
As shown in Figure 2, MCM presented transition probabilities within the same learning gain group. Results revealed that low-learning-gain groups showed a much higher probability for transition SO_HZ_LNG→NO (0.83) among all other potential transitions. Although this transition probability became smaller for low-learning-gain groups (0.5), it still remained larger compared to SO_HZ_LNG→SO_HZ_NO (0.33). Comparably, high-learning-gain groups showed an opposite trend. They had a higher probability for SO_HZ_LNG→SO_HZ_NO (0.52) compared to SO_HZ_LNG→NO (0.43). This means the long-shared view state is more likely to be followed by no shared view in Horizon for high-learning-gain groups. Recall that SO_HZ_LNG→SO_HZ_NO suggests both students continued individual exploration after the long-shared view state, creating opportunities for information exchange and screen coordination later in the session.
Additionally, we applied the L* metric [23] to account for differences in base rates, thus allowing for between-group comparisons. When interpreting L* values, a larger absolute value indicates a stronger dependence between two consecutive states, while the value’s sign (positive or negative) indicates the direction of dependence. As shown in Table 3, for SO_HZ_LNG→SO_HZ_NO, the high-learning-gain groups showed the highest L*, while the no-learning-gain groups showed the lowest L*. This positive value means given the previous state is SO_HZ_LNG, students in this group are more likely than chance to enter the SO_HZ_NO state. Interestingly, SO_HZ_LNG→NO showed the opposite trend, and the only negative value was detected in high-learning-gain groups. This means that, given SO_HZ_LNG as the previous state, the current state is less likely than chance to be NO.
In summary, L* metric can detect transitions occurring more or less frequently than random chance, providing insights about when students intentionally engage those transitions. The overall results suggest that when high-learning-gain groups exit the long-shared view state, they are more likely than chance to follow this state by entering the scene overlapping in Horizon. Similarly, when this group exit the long-shared view state, they are less likely than chance to follow this state with no shared attention at all. In contrast, this transition is around chance level (0.06) for low-gain groups or more likely than chance (0.85) for no-gain groups.
Transition | Group | L* |
|---|---|---|
SO_HZ_LNG → NO | No Gain | 0.85 |
Low Gain | 0.06 | |
High Gain | -0.15 | |
SO_HZ_LNG → SO_HZ_NO | No Gain | -0.11 |
Low Gain | 0. 23 | |
High Gain | 0.35 |
Discussion
Our exploratory analysis identified six JA states to investigate the dynamics of JA, which provide insights into how groups coordinate their attention and solve the simulation task during a CPS process. The results revealed that groups with higher learning gains demonstrated a higher frequency of long and consistent shared view in the early stage. These preliminary findings support the previous studies that showed joint visual attention is associated with quality collaboration and contributes to learning gains (e.g., [18, 33]).
The examination of the sequence of states allowed us to identify different collaboration profiles. We observed an undesirable behavioral pattern that after a group exited a long-shared view state only one student remained active and interacted with the simulation, while another student no longer triggered any event. We perceived such different tendencies as a visual attention leader (the former) and a visual attention follower (the latter) [34, 35]. These two profiles (i.e., leader and follower), captured by the JA state sequence, illustrate the imbalanced responsibility to initiate discussion and level of engagement within the simulation. On the contrary, another sequence transited to individual exploration, which was more likely to occur in the high-learning-gain groups, suggested more balanced engagement and equal responsibility of exploring the simulation environment. This transition aligns with the profile of turn takers [35], which is a more effective collaboration behavior as both participants actively engage in and maintain a joint focus on the task to solve the problem. Overall, high-learning-gain groups were most likely to demonstrate balanced, mutual collaboration while no-learning-gain groups demonstrate imbalanced participation. This detection of asymmetrical participation suggests interesting lines of follow-up inquiry on transitions of other JA states to gain a better understanding of various collaboration profiles in CPS.
The novelty and contributions of this paper lie in the following two aspects. First, we presented an exploratory study of utilizing logs to capture JA to uncover how students collaboratively solve a group task in an immersive learning environment. Understanding how students interact with immersive learning environments can be challenging due to its open-endedness, leading to unstructured interactions. This unconstrained nature of interactions makes it difficult to understand how students navigate the environment and collaborate, leading to limited evidence suggesting what collaboration patterns are associated with learning opportunities [1]. Our study contributed by developing JA metric to investigate how students coordinate their attention across devices. This method allows us to look for dynamic and fine-grained patterns of JA that characterize successful CPS and productive collaboration.
Second, we investigated JA from a process perspective, which was typically studied as aggregative values of a binary event (i.e., whether students have or not have JA) [18, 33, 34]. Our approach revealed that temporal characteristic also matters as high-learning-gain groups demonstrate visual coordination in the early stage of task session. This finding suggests that early visual coordination behavior patterns have the potential to inform the following collaboration quality. Lack of such behaviors in the beginning stage can serve as a signal for early interventions to prevent persistent undesirable or unproductive collaboration. Studies are needed for further explorations of the relationship between early collaboration patterns and following collaboration quality. Sequential analysis allows us to detect asymmetrical participation. This finding supports previous studies [34] that although high-level JVA is correlated with quality collaboration, it may also hide a free-rider effect and thus requires a finer-grained examination on this feature.
Design Implications
One implication is to design learning environments in a way that facilitates the process of obtaining JA, considering the potential of JA to enhance productive collaboration. For example, we can support peer awareness by adding visual pointers like an arrow to pinpoint the direction their peers are looking at, or a coordination shortcut allowing students to synchronize the screens or scenes in the simulation quickly. Such design can facilitate coordination and visual synchronization and consequently yield quality collaboration. This is especially the case when students do not have sufficient domain knowledge to communicate the correct direction to move their screens for a shared problem space for further discussion. Given the nature of the learning environment with immersive technologies, gaze visualizations are more likely to be utilized in linguistically complex environments where it is difficult to describe reference objects or directions to look at [8]. Moreover, visual attention awareness provides evidence that other group members are engaged and indeed getting the information communicated [29]. Such awareness contributes to an improved feeling of presence [2] and encourages learners to maintain JA.
Limitations and Future Research
This work has several limitations that we plan to address in future studies. First, we have a small sample size containing 20 groups. Although our analysis shows interesting patterns across groups, the comparison test does not have enough statistical power to identify significant difference. Second, the L* metric has a typical bias that inflates transition probability as our state sequence does not contain self-transition loops, which impacts the estimation of the base rate. To the best of our knowledge, transition metric for original sequences without self-transition loops is still an open issue. Current methods require the original sequences to contain self-transition loops to calculate base rates before loop removal. We also computed different transition metrics and found that MCM and L* are the most meaningful metrics for our dataset. Our work is exploratory in nature and still in its early stage. Future research will include more participants and combine multiple data sources like video recordings and qualitative codes to better understand how collaboration unfolds.
conclusion
This exploratory study focused on JA, a cornerstone of productive collaboration, to better understand how students regulate and coordinate their attention during CPS in an immersive learning environment. We identified different JA states and key collaboration patterns associated with learning. Specifically, we were interested in long and consistent screen overlapping across devices (i.e., long-shared view state). To advance the understanding of CPS, we applied the following approaches: (1) descriptive analysis (2) sequential analysis on JA state transition utilizing the Markov chain model and L* metric. This preliminary exploration provides evidence that long-shared view state, representing the highest level of JA state, is closely related to students’ positive collaborative learning experiences. More specifically, high-learning-gain groups demonstrate a higher frequency of long and consistent shared view in the early stage. A closer examination of the JA state sequence revealed two different collaboration profiles: attention follow-leader and turn takers. Overall, our findings unravel the complex process of attention dynamics and yield a better understanding of attention coordination during CPS in an immersive learning environment. This understanding consequently informs the design of computer-supported collaborative learning tools and environments to enhance learning.
ACKNOWLEDGMENTS
First, the authors would like to formally recognize other members of our research team, Robb Lindgren, Nathan Kimball, Emma Mercier, James Planey, Taehyun Kim, and Robin Jephthah Rajarathinam. Through their design of the simulation and research insights, their effort has enriched this work significantly. The authors are also grateful to Luc Paquette for many helpful discussions and suggestions on research idea development and analysis methods. Finally, this project was sponsored by the National Science Foundation Grant no:1822796.
REFERENCES
- Akçayır, M. and Akçayır, G. 2017. Advantages and challenges associated with augmented reality for education: A systematic review of the literature. Educational Research Review. 20, (Feb. 2017), 1–11. DOI:https://doi.org/10.1016/j.edurev.2016.11.002.
- Akkil, D., Thankachan, B. and Isokoski, P. 2018. I see what you see: gaze awareness in mobile video collaboration. Proceedings of the 2018 ACM Symposium on Eye Tracking Research & Applications (Warsaw Poland, Jun. 2018), 1–9.
- Bakeman, R. and Adamson, L.B. 1984. Coordinating Attention to People and Objects in Mother-Infant and Peer-Infant Interaction. Child Development. 55, 4 (Aug. 1984), 1278. DOI:https://doi.org/10.2307/1129997.
- Birchfield, D., Megowan-romanowicz, C., Birchfield, D. and Megowan-romanowicz, C. 2009. Earth Science Learning in SMALLab: a Design Experiment for Mixed-Reality. Journal of Computer Supported Collaborative Learning. 4, 4 (2009), 403-421.
- Bosch, N. and Paquette, L. 2021. What’s Next? Sequence Length and Impossible Loops in State Transition Measurement. 13, 1 (2021), 23.
- Bruner, J. 1985. The Role of Interaction Formats in Language Acquisition. Language and Social Situations. J.P. Forgas, ed. Springer. 31–46.
- Chang, C.-J., Chang, M.-H., Chiu, B.-C., Liu, C.-C., Fan Chiang, S.-H., Wen, C.-T., Hwang, F.-K., Wu, Y.-T., Chao, P.-Y., Lai, C.-H., Wu, S.-W., Chang, C.-K. and Chen, W. 2017. An analysis of student collaborative problem solving activities mediated by collaborative simulations. Computers & Education. 114, (Nov. 2017), 222–235. DOI:https://doi.org/10.1016/j.compedu.2017.07.008.
- D’Angelo, S. and Schneider, B. 2021. Shared Gaze Visualizations in Collaborative Interactions: Past, Present and Future. Interacting with Computers. 33, 2 (Mar. 2021), 115–133. DOI:https://doi.org/10.1093/iwcomp/iwab015.
- Dede, C. 2009. Immersive Interfaces for Engagement and Learning. Science. 323, 5910 (Jan. 2009), 66–69. DOI:https://doi.org/10.1126/science.1167311.
- Diederich, M., Kang, J., Kim, T. and Lindgren, R. 2021. Developing an In-Application Shared View Metric to Capture Collaborative Learning in a Multi-Platform Astronomy Simulation. LAK21: 11th International Learning Analytics and Knowledge Conference (Irvine CA USA, Apr. 2021), 173–183.
- Dunleavy, M., Dede, C. and Mitchell, R. 2009. Affordances and Limitations of Immersive Participatory Augmented Reality Simulations for Teaching and Learning. Journal of Science Education and Technology. 18, 1 (Feb. 2009), 7–22. DOI:https://doi.org/10.1007/s10956-008-9119-1.
- Emara, M., Hutchins, N., Grover, S., Snyder, C. and Biswas, G. 2021. Examining Student Regulation of Collaborative, Computational, Problem-Solving Processes in Open-Ended Learning Environments. Journal of Learning Analytics. 8, 1 (Apr. 2021), 49–74. DOI:https://doi.org/10.18608/jla.2021.7230.
- Gabadinho, A., Studer, M., Müller, N., Bürgin, R., Fonta, P.-A. and Ritschard, G. 2022. TraMineR: Trajectory Miner: a Toolbox for Exploring and Rendering Sequences.
- Griffin, P. and Care, E. Educational Assessment in an Information Age. 282.
- Han, A., Krieger, F. and Greiff, S. 2021. Collaboration Analytics Need More Comprehensive Models and Methods: An Opinion Paper. Journal of Learning Analytics. 8, 1 (Apr. 2021), 13–29. DOI:https://doi.org/10.18608/jla.2021.7288.
- Helske, J. and Helske, S. 2021. seqHMM: Mixture Hidden Markov Models for Social Sequence Data and Other Multivariate, Multichannel Categorical Time Series.
- Eduardo, H., Radu, I., Joy, T. and Schneider, B. 2021. Augmented Reality in Collaborative Problem Solving: A Qualitative Study of Challenges and Solutions. International Conference on Computer Supported Collaborative Learning (2021).
- Jermann, P., Mullins, D., Nüssli, M.-A., Dillenbourg, P. and Nuessli, M.-A. 2011. Collaborative Gaze Footprints: Correlates of Interaction Quality. (2011), 8.
- Kang, J., An, D., Yan, L. and Liu, M. Collaborative Problem-Solving Process in A Science Serious Game: Exploring Group Action Similarity Trajectory. (2019), 6.
- Lämsä, J., Hämäläinen, R., Koskinen, P., Viiri, J. and Mannonen, J. 2020. The potential of temporal analysis: Combining log data and lag sequential analysis to investigate temporal differences between scaffolded and non-scaffolded group inquiry-based learning processes. Computers & Education. 143, (Jan. 2020), 103674. DOI:https://doi.org/10.1016/j.compedu.2019.103674.
- Lin, T.-J., Duh, H.B.-L., Li, N., Wang, H.-Y. and Tsai, C.-C. 2013. An investigation of learners’ collaborative knowledge construction performances and behavior patterns in an augmented reality simulation system. Computers & Education. 68, (Oct. 2013), 314–321. DOI:https://doi.org/10.1016/j.compedu.2013.05.011.
- Martinez-Maldonado, R., Yacef, K., Kay, J., Kharrufa, A. and Al-Qaraghuli, A. Analysing frequent sequential patterns of collaborative learning activity around an interactive tabletop. International Conference on Educational Data Mining (EDM 2011) (2011), 111-120.
- Matayoshi, J. and Karumbaiah, S. 2020. Adjusting the L Statistic when Self-Transitions are Excluded in Affect Dynamics. 12, 4 (2020), 23.
- Mercier, E.M. and Higgins, S.E. 2013. Collaborative learning with multi-touch technology: Developing adaptive expertise. Learning and Instruction. 25, (Jun. 2013), 13–23. DOI:https://doi.org/10.1016/j.learninstruc.2012.10.004.
- Moore, C. and Dunham, P.J. 1995. Joint attention: its origins and role in development. Lawrence Erlbaum Associates.
- OECD 2017. Development Co-operation Report 2017: Data for Development. Organisation for Economic Co-operation and Development.
- O’Madagain, C. and Tomasello, M. 2021. Joint attention to mental content and the social origin of reasoning. Synthese. 198, 5 (May 2021), 4057–4078. DOI:https://doi.org/10.1007/s11229-019-02327-1.
- Phelps, E., & Damon, W. (1989). Problem solving with equals: Peer collaboration as a context for learning mathematics and spatial concepts. Journal of Educational Psychology, 81(4), 639–646.
- Qvarfordt, P., Beymer, D. and Zhai, S. 2005. RealTourist – A Study of Augmenting Human-Human and Human-Computer Dialogue with Eye-Gaze Overlay. Human-Computer Interaction - INTERACT 2005. M.F. Costabile and F. Paternò, eds. Springer Berlin Heidelberg. 767–780.
- Richardson, D.C. and Dale, R. 2005. Looking To Understand: The Coupling Between Speakers’ and Listeners’ Eye Movements and Its Relationship to Discourse Comprehension. Cognitive Science. 29, 6 (Nov. 2005), 1045–1060. DOI:https://doi.org/10.1207/s15516709cog0000_29.
- Rodríguez, F.J. and Boyer, K.E. 2015. Discovering Individual and Collaborative Problem-Solving Modes with Hidden Markov Models. Artificial Intelligence in Education. C. Conati, N. Heffernan, A. Mitrovic, and M.F. Verdejo, eds. Springer International Publishing. 408–418.
- Roschelle, J. and Teasley, S.D. 1995. The Construction of Shared Knowledge in Collaborative Problem Solving. Computer Supported Collaborative Learning. C. O’Malley, ed. Springer Berlin Heidelberg. 69–97.
- Schneider, B. and Pea, R. 2013. Real-time mutual gaze perception enhances collaborative learning and collaboration quality. International Journal of Computer-Supported Collaborative Learning. 8, 4 (Dec. 2013), 375–397. DOI:https://doi.org/10.1007/s11412-013-9181-4.
- Schneider, B., Sharma, K., Cuendet, S., Zufferey, G., Dillenbourg, P. and Pea, R. 2018. Leveraging mobile eye-trackers to capture joint visual attention in co-located collaborative learning groups. International Journal of Computer-Supported Collaborative Learning. 13, 3 (Sep. 2018), 241–261. DOI:https://doi.org/10.1007/s11412-018-9281-2.
- Shaer, O., Strait, M., Valdes, C., Feng, T., Lintz, M. and Wang, H. 2011. Enhancing genomic learning through tabletop interaction. Proceedings of the SIGCHI Conference on Human Factors in Computing Systems (Vancouver BC Canada, May 2011), 2817–2826.
- Siposova, B. and Carpenter, M. 2019. A new look at joint attention and common knowledge. Cognition. 189, (Aug. 2019), 260–274. DOI:https://doi.org/10.1016/j.cognition.2019.03.019.
- Wang, H.-Y., Duh, H., Li, N., Lin, T.-J. and Tsai, C.-C. 2014. An Investigation of University Students’ Collaborative Inquiry Learning Behaviors in an Augmented Reality Simulation and a Traditional Simulation. Journal of Science Education and Technology. 23, 5 (2014), 682-691. DOI:https://doi.org/10.1007/s10956-014-9494-8.
- Wayntal, D., Serna, A., Pernelle, P. and marty, jean-charles 2015. Multi-Devices Territoriality to Manage Collaborative Activities in a Learning Game. 9th European Conference on Games-Based Learning (ECGBL 2015) (Steinkjer, Norway, Oct. 2015), 570–578.
- Wu, H.-K., Lee, S.W.-Y., Chang, H.-Y. and Liang, J.-C. 2013. Current status, opportunities and challenges of augmented reality in education. Computers & Education. 62, (Mar. 2013), 41–49. DOI:https://doi.org/10.1016/j.compedu.2012.10.024.
- Zheng, J., Xing, W. and Zhu, G. 2019. Examining sequential patterns of self- and socially shared regulation of STEM learning in a CSCL environment. Computers & Education.
© 2022 Copyright is held by the author(s). This work is distributed under the Creative Commons Attribution-NonCommercial-NoDerivatives 4.0 International (CC BY-NC-ND 4.0) license.