ABSTRACT
Research into "gaming the system" behavior in intelligent tutoring systems (ITS) has been around for almost two decades, and detection has been developed for many ITSs. Machine learning models can detect this behavior in both real-time and in historical data. However, intelligent tutoring system designs often change over time, in terms of the design of the student interface, assessment models, and data collection log schemas. Can gaming detectors still be trusted, a decade or more after they are developed? In this research, we evaluate the robustness/degradation of gaming detectors when trained on older data logs and evaluated on current data logs. We demonstrate that some machine learning models developed using past data are still able to predict gaming behavior from student data collected 16 years later, but that there is considerable variance in how well different algorithms perform over time. We demonstrate that a classic decision tree algorithm maintained its performance while more contemporary algorithms struggled to transfer to new data, even though they exhibited better performance on unseen students in both New and Old data sets by themselves. Examining the feature importance values provides some explanation for the differences in performance between models, and offers some insight into how we might safeguard against detector rot over time.
Keywords
INTRODUCTION
Adaptive systems like intelligent tutoring systems (ITSs) depend on inferential models to understand and respond to individual students. Some of these systems and models have now been applied to modeling knowledge and behavior for decades [7]. For instance, Bayesian Knowledge Tracing (BKT) models have been used in ITSs for almost 30 years [11]. Even the use of more complex machine-learned models now has an extensive history; for example, gaming the system models which predict when students are attempting to find ways other than learning to advance through the system [2, 5, 26], have been in use for 18 years.
Gaming the system models are used for several purposes, including evaluating the quality of content [13, 24], research on the longitudinal impacts of disengagement [1, 34], and automated intervention [3]. Even as ITSs have become more adaptive and user interfaces have become more engaging, students have continued to find ways to disengage from these systems [38].
While BKT models are easily and frequently refit in industrial practice, models of constructs like gaming the system require supplementary data collection beyond the standard logged data stream, in order to create new training labels. As a result, they are expensive to fit and are not refit often. Is this a dangerous practice?
An analogy can be made to code rot, a phenomenon in computer software where over time systems degrade in performance due to their reliance on aging library dependencies, hardware updates, and breakdown in the structural integrity of design patterns [18]. Models developed through machine learning and artificial intelligence (AI) may suffer a similar fate, “detector rot”, where a model stops functioning as expected over time. When a piece of code simply fails to work, it is obvious, but there may be less obvious failure modes for machine learned models. Machine Learning packages change in their functionality over time and become obsolete; just because a model is still runnable does not necessarily imply that it is functioning in the same way. This problem has been noted in machine learning research in general, where many past research results can no longer be reproduced [17].
Furthermore, even if a model is functioning the same way as it did a decade ago, that does not mean that it has not experienced a form of decay. There is more to decay in a model over time than just reproducibility. Take the Cognitive Tutor [31], the system which many of the first models detecting gaming were developed for [2, 6]. The design and interface of Cognitive Tutors have gone through significant changes over the years (and the system has been rebranded MATHia). The changes over time involve both cosmetic changes and changes in pedagogical strategies and content. We elaborate further on these changes in a dedicated section below. Students, teachers, and learning contexts also change over time. In 1995, Janet Schofield reported many students in Pittsburgh skipping lunch and staying after school to use ITSs [35], a behavior not commonly reported in U.S. classrooms today. ITSs are much more prevalent in classrooms than even 10 or 15 years ago, students and teachers are more familiar with instructional technology, and students use technology at-home more often compared to an earlier focus primarily on classroom use [16]. Students today are also much more likely to be comfortable quickly locating information on the internet and may expect this same immediacy in their interaction with ITSs [36]. As such, detector rot may be as much a problem of generalizability as reproducibility -- the model might have been completely valid in 2008, and may even still function exactly the same way, but may not be valid anymore in 2021. As such, we can and should ask: will models trained on older data (in this case, 2005) maintain accuracy when tested on current data (2021)? Beyond this, has student gaming behavior changed over the last 15 years as indicated by different features becoming more/less important when detecting gaming behavior?
This question seems on its surface to be a question about algorithm effectiveness today, based on historical models. But it is also important to ask, do we have any reason to believe our models will work tomorrow? One challenge in answering this question is that the algorithms we use today are different than those used fifteen years ago. Significant advances have occurred in machine learning algorithms over the last 16 years [20]. We can have somewhat more confidence in the potential of today’s algorithms to work tomorrow, by conducting an anachronistic form of analysis -- applying current algorithms to older data and seeing how well they work on contemporary data. One class of algorithm that has seen recent success is gradient boosted descent trees. The eXtreme gradient boosting package (xgboost) [10] has met and surpassed state of the art results across a variety of machine learning applications including the detection of gaming the system [30]. Contemporary machine learning algorithms generally achieve better predictive performance than older algorithms, as the proceedings of this conference over the last few years shows. Will contemporary machine learning models also be more robust over time than older algorithms?
To answer these questions, this paper compares the functioning of gaming detectors over time, using data sets from 2005 and 2021. We will evaluate the effectiveness of a model trained on data from 2005 and tested on data from 2021. We will also compare which features are most important within models trained on the Old data to which features are most important in models trained on the New data, to see whether the behaviors that are predictive remain consistent over time. Additionally, we will then apply a variety of machine learning models including both classic algorithms and contemporary algorithms, to determine if each of these types of algorithms is robust to changes over time.
This paper will begin by discussing how the system being studied (MATHia/Cognitive Tutor) has changed over time, and how these changes may impact the manifestation of gaming behavior. In the methods section we describe the process of obtaining training labels for newer data, the feature set implementation, and the modeling process. Next we present results, comparing models' performance over time and dig deeper into the most important features of the most effective models. We discuss potential implications for practice in the use of detectors in real-world learning systems, and finally conclude with a synthesis of our findings and potential avenues for future research.
Mathia
We studied the issue of detector rot using log data generated by Carnegie Learning’s MATHia (formerly known as Cognitive Tutor – [30]) ITS at two time periods separated by approximately 16 years (2005 and 2021). Throughout their histories, MATHia/Cognitive Tutor has been the software component of a typically blended core curricula for middle school and high school mathematics. In blended, core implementations, Carnegie Learning recommends a mix of collaborative classroom work guided by its paper worktexts (60% of instructional time) as well as individual student work (40% of instructional time) in the ITS. MATHia/Cognitive Tutor presents students with complex, multi-step math problems mapped to fine-grained skills (often also referred to as knowledge components/KCs; [23]. Within each problem, the ITS provides context-sensitive help and feedback, sensitive, for example, to particular solution strategies a student might adopt (e.g., surfacing feedback that an incorrect answer reflects an inappropriate problem-solving strategy).Implementing mastery learning [33], the ITS tracks students’ progress to mastery of KCs using an implementation of Bayesian Knowledge Tracing (BKT; [11]) and presents problems to students until they demonstrate mastery of all KCs associated with each topical lesson or “workspace.” When a student has mastered all KCs in a workspace, they are moved on to the next workspace in an assigned sequence of workspaces, typically corresponding to a course like Algebra I or Grade 6 Math. Within MATHia, the tutor judges a KC as mastered when the student reaches a 0.95 probability estimate for having mastered that KC.
Timestamped log data track student actions (e.g., making a problem-solving attempt, requesting a hint) at each step of problems within each workspace, as well as feedback from the ITS (e.g., a correct response or that an error triggers just-in-time feedback because it reflects a common misconception, etc.). Data also track the input values provided by students, the KC to which a particular problem-step is mapped, and BKT’s ongoing estimation of a student’s probability of having mastered the KC.
Mathia Changes Between 2005 and 2021
In general, the Cognitive Tutor Java application of 2005 was more compartmentalized (with multiple windows displaying problem-solving elements) than the more contemporary web-based delivery of 2021. One prominent difference in the layout of the user interface concerns the extent to which the “skillometer” for visualizing student progress to skill mastery has evolved from a display that was “expanded” by default (displaying skill names and progress to mastery) to a more visually compact representation (circles that “fill” as students make skill progress) that can be expanded by the student to see their progress in more detail.
Changes have more recently been implemented in how BKT tracks student progress to skill mastery, especially related to how the student’s use of hints impacts their knowledge estimates. First, hints are now delivered in MATHia with a delay between “hint levels.” After the student requests an initial hint, which typically re-states the goal for the current problem-solving step, there is a delay of a few seconds before the student can request another hint, which provides detail on how to accomplish the goal. This initial delay and short delays for each additional hint are designed to encourage reflection on the help requested and discourage students from rapidly seeking the “bottom out” hint, which provides the answer [2].In the Cognitive Tutor circa 2005 (and for many subsequent years), a student’s request for a hint on a first attempt at a problem-solving step was treated as an incorrect response, resulting in a decrease in the ITS’s estimate of skill mastery. The 2021 version of MATHia only treats the “bottom out” hint that presents the student with the answer as an incorrect attempt. Correct attempts after an initial hint are now credited (i.e., skill mastery estimates increase) like immediate correct attempts, and correct attempts after mid-level hints now leave the skill mastery estimate unchanged. In addition, MATHia’s BKT parameter estimates for each skill (used to determine the models’ responsiveness to correct and incorrect answers) are now frequently set based on data-driven estimation techniques [32, 39] as opposed to mostly being set according to expert judgment in earlier Cognitive Tutor versions.
Methods
Labeling Gaming Behavior
We obtained the data set used to develop the gaming detector in [6]. This original detector was a J48 (C4.5) decision tree classifier [29] built using training labels developed using text replays. Text replays allow coders to directly label “clips” (segments of log data), presented as a sequence of actions and their context [4]. Text replays have been used in a range of projects as a fast and accurate method to label a range of types of student behavior for classifier development within various types of learning systems [4, 6, 12, 26].
For the older data set [6], we obtained data from the PSLC DataShop [22], data set “Algebra I 2005-2006 (3 schools)”, including both training labels derived using text replays and partially-distilled log data. 18,737 training labels were included in that data set.
The New data set was obtained directly from the Mathia team (this data set is not currently on DataShop, due to government-agency-level contractual restrictions on data sharing). We conducted an identical text replay approach to [6], obtaining the original text replay software from the first author of that earlier work. We used a textual sequence of student activity of a duration of 20 seconds or 8 actions (whichever occurred last) from MATHia’s log data as a clip for labeling. Every clip contained the student ID, timestamp of each action (in relation to the first action in clip), the problem name and step, student’s input, relevant knowledge/skill production and system estimate, and the outcome as assessed by system (correct, a misconception (bug), wrong answer, a request for hint (initial or a deeper level). This set of clips was then coded for gaming the system behavior.
“Gaming the system” behavior was defined as the learner misusing the system’s help and feedback to get correct answers and advance in their trajectory within the ITS [6]. A clip was labeled as gaming the system when a learner asked for hints in quick and repeated successions until the system revealed the answer, or systematically input answers rapidly until they got the correct one. For example, a student entering a sequence like "1,2,3,4,5,6,7,8" in rapid succession would be labeled as engaging in gaming behavior. For further detail on the behaviors treated as gaming the system in the coding process, please see [27].
For the more recent data set, two coders (2nd & 3rd authors) initially labeled 60 text replays to establish inter-rater reliability, and attained a kappa of 0.62, comparable to the original data set [6], and over the 0.6 cut-off often treated as standard for coding ill-defined constructs such as disengaged behavior [25]. Subsequently, the first coder labeled a total of 600 clips from which 6 were removed as unclassifiable. Out of the 594 labels, 31 were coded as ‘gaming’, and the remaining 563 as ‘not gaming’. Thus, around 5% of the total clips were coded as gaming for this data sample, which is in alignment with previously observed proportions of gaming behavior in ITS [6].
Feature Engineering
The features developed for this research are based on the original research published in [6]. In order to maintain fidelity with the original work we followed the process of creating the original features as closely as possible, but in order to make sure the features were comparable across data sets, we re-distilled the features for the original data set. The features are described in table 1.
All features were engineered on the full data-set of student log data, and then aggregated for the labeled clips. Each clip consists of a series of actions so the features were aggregated together to create a single row of data labeled as either gaming behavior or not. The aggregate columns created for each feature were: Count of non-null values, Mean, Standard Deviation, Minimum, 25th percentile, 50th percentile (median), 75th percentile, Maximum, Sum. In total, 17 features were distilled at the transaction level, and each of these 17 features was aggregated in 9 ways in the final training data. The final training data had 17*9 = 153 features.
Feature Name | Description |
|---|---|
assess_CORRECT | correct answer |
assess_BUG | error tracked by MATHia for just-in-time context-sensitive feedback (e.g., a known misconception, a number as input that appears in the problem but is incorrect); typically |
assess_ERROR | error not tracked for feedback, i.e. less common mistakes |
assess_INITIAL_HINT | first-level hint provided |
assess_HINT_LEVEL_CHANGE | a "deeper" level of hint provided |
pknow | The probability estimate that the student knows this skill based on internal Bayesian Knowledge |
pknow_direct [8] | If the current action is the student’s first attempt on this problem step, then pknow-direct is equal to pknow, but if the student has already made an attempt on this problem step, then pknow-direct is -1. |
duration | How many seconds the action took |
duration_sd | duration expressed in standard deviations from the mean time taken for this problem step across all problems |
duration sd_prev{3,5} | sum of duration_sd for |
wrong_attempts | total number of times a student has gotten this problem step wrong |
error_perc | percentage of past problems the student has made errors on this same |
help_and_errors_count | number of times the student asked for help or made errors on this skill across all previous |
num_steps | count of attempts on this step for this problem |
help_attempts_last8 | How many times has the student asked for help in their last 8 actions |
error_count_last5 | How many errors the |
problem_step_count_last5 | how many of the last 5 |
Modeling
As in [6], we modeled gaming detection as a binary classification problem - a clip with gaming the system was labeled as 1, and without as 0. We conducted three overall types of comparisons. First, we trained models on the Old data and tested them on the Old data (Old to Old). Second, we trained models on the New data and tested them on the New data (New to New). For the Old to Old and New to New comparisons, we used a 4-fold student-level cross validation in which we left out 25% of students from each training set. We then tested each model on the left-out set of students, pooled the labels from each split, and calculated metrics on the pooled labels. In our third comparison, we took a model trained using all of the Old data and tested it on all of the New data (Old to New), using the entire training set since there was no risk of any students being present in both data sets, given the 16 year gap. We did not train a model on the New data and test it on the Old data, as doing so would not answer our research questions. There are cases where it may be of interest to conduct the ahistorical analysis of training on newer data and testing on legacy data -- such as cases where labels cannot be obtained for past data -- but it is not relevant to this use case, since text replays can be conducted on legacy data.
There was considerable imbalance between the classes in the labeled data. 5.5% of clips in the Old data set were labeled as gaming behavior, and 5.2% of clips in the New data set were labeled as gaming behavior. In order to account for this imbalance, we oversampled the minority class to achieve a 50-50 balance between the classes, in the training sets only (not in the test sets). For oversampling the minority class we used Synthetic Minority Oversampling Technique (SMOTE) [9] to synthesize new training data, without undersampling the majority class, to preserve all data. We used the area under the receiver operating characteristic curve (AUC ROC) to evaluate not just the predictive accuracy of our models but also the performance of our model at all classification thresholds. AUC ROC is thought to be better at evaluating classifiers in cases with strong imbalance [19], as is seen here. Gaming detection probabilities are frequently used in research involving detectors [28, 30] rather than using a single threshold; AUC ROC indicates how effective a model is across confidence levels.
We applied a variety of classic (available at the time of the original publication of the gaming detector [6]) and contemporary machine learning models on both the Old and New data sets. We were uncertain that the specific original algorithm used in [6], the WEKA J48 implementation of C4.5 incorporated into RapidMiner 4.6, could be replicated exactly at this point, so scikit-learn’s DecisionTreeClassifier, which implements the similar algorithm CART (Classification and Regression Trees), was selected as a close substitute. Scikit-learn’s implementations of Neural Networks, Random Forest, and XGBoost were also used. Of these, only XGBoost was completely unavailable in 2008 [10]. All code for this research is available for reference on github at https://anonymous.4open.science/r/CogTutorGamingDetectors-627E.
Results
Model Performance
The results of our analyses evaluating different classification models in our three training-testing scenarios are shown in Table 2. In the table columns, we can see the different combinations of training and testing.
All of the classifiers performed well when trained on the Old data and also tested on the Old data (Old to Old). The best performance was obtained by Random Forest, achieving an AUC ROC of 0.784. XGBoost was second-best with an AUC ROC of 0.763, and Decision Tree was third-best, performing 0.048 worse than Random Forest. We evaluated the statistical significance of the difference between Random Forest and Decision Tree (the algorithm closest to the original paper), using the method outlined in [14] to conduct a Z test to compare the area under two ROCs. In this case, Random Forest was a statistically significant improvement over Decision Tree, Z = 2.334, two-tailed p < 0.05.
When detectors were developed for the New data and tested on the New data (New to New), performance was generally higher than for Old to Old, rising above 0.85 for Random Forest, XGBoost, and Neural Network. However, for Decision Tree the improvement was negligible, rising from 0.736 to 0.738. Random Forest still obtained the best performance out of any of the models -- an AUC ROC of 0.929 for New to New, statistically significantly better than the 0.784 obtained in the Old to Old model, Z=3.764, two-tailed p<0.001. Decision Tree, the algorithm closest to the algorithm used in the original paper, was the only model which did not improve significantly in performance on the New to New data set, Z=0.03, two-tailed p=0.973.
Model | Trained on Old Tested on Old | Trained on New Tested on New | Trained on Old Tested on New |
|---|---|---|---|
Decision Tree | 0.736 | 0.738 | 0.716 |
Random Forest | 0.784 | 0.929 | 0.509 |
Neural Net | 0.649 | 0.879 | 0.398 |
XGBoost | 0.763 | 0.921 | 0.333 |
Our primary research question was whether gaming detector models would degrade over time. This would be shown if the Old models achieved poorer performance when applied to New data (Old to New), compared to the within-year Old to Old and New to New comparisons. All three newer models showed some degradation in performance, but there was substantial difference in degradation between algorithms. The Old to New performance for Decision Tree (AUC ROC = 0.716) appeared to have a small decline in performance relative to Old to Old (AUC ROC = 0.738, a 0.022 decline) but the difference was not statistically significant, Z=0.360, two-tailed p = 0.719. The Old to New performance for Decision Tree (AUC ROC = 0.716) was also not significantly lower than the New to New performance (AUC ROC = 0.736), Z=0.241, two-tailed p=0.810, though again there was some appearance of slightly poorer performance.
By contrast, the Old to New performance for Random Forest (AUC ROC = 0.509) was statistically significantly worse than the Old to Old Performance (AUC ROC = 0.929), Z=6.948, two-tailed p<0.0001. It was also significantly worse than the New to New performance for that algorithm (AUC ROC = 0.784), Z=3.380, two-tailed p<0.001. The Old to New performance for Neural Network (AUC ROC = 0.398) was significantly worse than Old to Old Performance (AUC ROC = 0.649), Z=4.445, two-tailed p<0.001. It was also significantly worse than the New to New performance for that algorithm (AUC ROC = 0.879), Z=6.826, two-tailed p<0.001. The Old to New performance for XGBoost (AUC ROC = 0.333) was the worst of all, significantly worse than the Old to Old Performance (AUC ROC = 0.763), Z=6.498, two-tailed p<0.001. It was also significantly worse than the New to New performance for that algorithm (AUC ROC = 0.921), Z=7.926, two-tailed p<0.001.
All four algorithms were able to achieve much better than chance performance in the Old to Old as well as the New to New scenarios, but the three newer algorithms struggled to make predictions about the New data when trained on the Old data. Decision Tree was the only model able to transfer from Old Data to the New without dropping substantially in performance. Decision Tree’s performance was essentially equal when applied to unseen students in the same data set and unseen students in a new data set, suggesting that it may not have overfit to the features of the learning system/population it was being applied to. The other three algorithms (all of them less conservative algorithms than Decision Tree) performed significantly worse when comparing Old to Old performance and Old to New performance. The drops in performance on newer models and the relative robustness of the more classic decision tree model indicates that not all algorithms may be equally prone to detector rot.
Feature Importance
To understand how gaming the system is associated with student behavior in the logs, and whether this differs between time periods, we examined the feature importances of XGBoost, the algorithm with the worst drop in performance (also the newest) and Decision Tree, the algorithm with the least drop in performance (also the closest to the original paper). In doing so, we compared the models trained on the Old data and New data. Doing so can also provide evidence on how student behaviors have changed or remained consistent over time. The XGBoost algorithm calculates the importance of each feature as the 'gain', i.e. "the improvement in accuracy brought by each feature across all splits the feature is used in" [39]. In the figure below we can see the top 15 features ranked by gain in both the Old and New models, for XGBoost.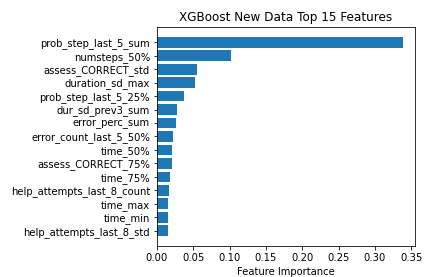
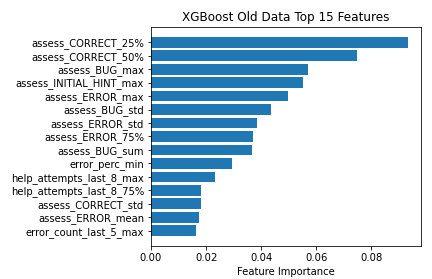
For XGBoost, in the Old Data we see that the majority of the predictive power is taken up by the features generated by the ITS’s response to the student based on the answer the student has given. In particular, we see that rates of correct (assess_CORRECT) responses and incorrect (assess_ERROR, assess_BUG) responses throughout a clip are strong predictors of gaming behavior, as well as the use of hints.
In the XGBoost model for New data, we see features that are more related to time. The sum of the trailing count of how many of the last 5 steps were on the same problem (prob_step_last_5_sum) was the most important feature. This feature indicates that a student is taking many actions on the same problem step, which could indicate that they are trying to game the system by attempting to guess the correct answer. In the other top features, we see the average time spent on the previous 5 actions in standard deviation units based on the distribution of time spent on these problems by all students (dur_sd_prev5_mean), the minimum time spent on any action within the clip (time_min), and the average time spent on each action in standard deviation units (duration_sd_mean). This is more in line with features developed in previous gaming detectors [4, 3]. Additionally, we see more of a focus on student behavior features, like error counts and wrong attempts. This represents a contrast to the XGBoost model trained on the Old Data, where most of the features were derived from the correctness of student responses and whether their errors reflect common errors (perhaps reflecting genuine errors) or rarer ones (perhaps reflecting systematic guessing). The features around bugs may be vulnerable to change over time, as the list of bugs (and the messages in response to them) has changed over the years. Features around hints could also have been impacted by changes in hint message content (which may impact learning and therefore how often they are used by non-gaming students) and by the changes to credit given to non-bottom-out hints.
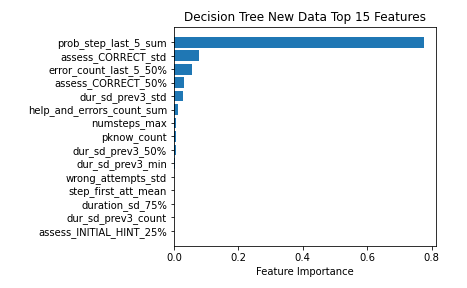
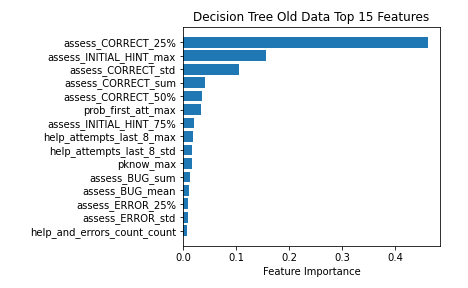
By comparison, when we look at the features used by Decision Tree, we see a very different pattern. In figure 2 we see that although features such as student rates of within-clip correct, incorrect, and bugs are relevant within the Decision Tree model for the Old data (as with XGBoost), the variety of types of features being used by the Decision Tree model built on Old data is broader than for XGBoost. For instance, we see a feature representing whether or not this is the student's first time attempting a particular problem step attempt on a problem within the clip (prob_first_att_max) in the top 6. We also see the 8th most important feature was pknow-max, assessing how high the student’s mastery of the best-known KC in the clip is. These features, which are not present in the XGBoost model of the Old data, are helpful in understanding the student's relationship with the problems they are facing in a given clip.Overall, comparison of feature importances indicates that the decision tree was making predictions from more disparate features than XGBoost.
When trained on the New data, the Decision Tree focused on a very small group of features that were similar to the features most important to XGBoost when trained on the New data. Again, we see the sum of the trailing count of how many of the last 5 steps were on the same problem step (prob_step_last_5_sum) as the most important feature in the New data. In the case of the Decision Tree trained on New data, this feature was the most important by a wide margin. In the next four features there are two related to evaluating the correctness of student responses (assess_CORRECT) and two that are related to the number of errors made by students in the clip (error_count_last_5_50%, error_perc_sum). These features also showed up in the XGBoost feature importance table, although at slightly different positions. The relatively stable performance of Decision Tree may be due to the stability in the meaning of the correctness assessments as opposed to the bug and error assessments (which may have shifted more in meaning between versions, with errors becoming bugs as more errors were identified).
Discussion and Conclusion
Our primary research question was the degree to which models of a complex educational phenomena such as gaming the system can be trusted over time. To investigate this question, we analyzed whether gaming detectors built on data from over 15 years ago can make reliable predictions for contemporary data. To our pleasant surprise, an older model (Decision Tree) trained on older data (from 17 years ago) still functioned well on contemporary data. However, newer, less-conservative algorithms performed much more poorly when trained on older data and tested on newer data, a phenomenon we term “detector rot”. Across all of our newer models, we observed significant rot -- significant degradation in prediction -- when training on Old data and predicting on New data.
Initial findings conducted with training and test sets from the same year initially looked positive for the newer algorithms. More specifically, Random Forest and XGBoost were able to outperform the other algorithms in both the Old to Old and New to New scenarios. This corresponds to other findings that contemporary machine learning models can offer a better fit and better cross-validated performance for gaming detection e.g. [29]. However, XGBoost was the worst-performing algorithm when trained on Old data and tested on New data. This result (plus the considerable degradation seen for the Neural Network algorithm) raises the concern that more advanced models may generally have more difficulty when applied to future samples or data drawn from different contexts.
This set of findings has important implications for detectors of complex phenomena currently in place, for the detectors being developed today, and for best practices when retraining models. We suggest the community should be cautious in using newer machine learning models -- they may initially be more accurate (even for unseen students) but may become less accurate more quickly over time than simpler models. At minimum, models developed using contemporary algorithms may need to be re-checked more often than models using classic algorithms. However, it is not yet clear how often new data should be collected or whether old and new data should be combined (see, for instance, [20]).
In our modeling attempts most features were not important to the models. Future research might look to analyze these features and remove some of the redundancy to reduce overfitting. It is possible that this method of reducing overfitting may reduce some of the overfit to specific years, but the prominence of specific features involving student errors in the model suggests that changes in semantics between the 2005 and 2021 datasets may have been a bigger part of the explanation for the observed detector rot. It is important to acknowledge that it is not clear from our findings which changes between the Old and New data sets resulted in the detector rot observed. Across the span of 17 years, changes in the user interface, updates to the content of the ITS, and changes in student behavior may have impacted the ability of the gaming detectors to transfer. It may be worth attempting to directly identify how specific design changes impact detector performance -- for instance, by collecting text replays from right before and right after a design change. This might help understand exactly how feature importance and model functional form shifts due to this type of change, eventually helping us develop detectors resistant to these shifts and understand which design changes may reduce the effectiveness of existing detectors.
Our findings open a broad range of questions to further research on detector rot. Gaming the system is one of many classification tasks in educational data mining research and practice. Future research should investigate whether other important EDM classification problems such as drop-out/stop-out prediction and affect detection are impacted by detector rot. There is already evidence for one form of detector rot in the case of MOOC stop-out: classifiers trained on the first session of a MOOC can be less effective in later sessions [8, 36]. However, this finding may be due to differences in the populations of students who choose to take a MOOC in its first session, rather than the degradation of detectors over time -- i.e. selection bias rather than detector rot. Studying what systems and detection tasks are most prone to detector rot would be an important contribution to the practical use of detectors in real-world settings.
One of the exciting aspects of educational data mining over the last decade has been the rapid developments in the algorithms available for us to use. Newer algorithms offer the promise of better predictive performance on long-standing problems. There is a temptation to always go with the newest, most exciting algorithm available, and to focus on cross-validated performance or a held-out test set from the current data set, rather than looking at replication and generalizability (see discussion in [14]). However, our findings suggest some of our predictive models may be aging, and this may be a more serious problem for contemporary algorithms which achieve higher initial performance. Future work can help us understand which changes in learning systems and student populations result in detector rot, and how to develop adaptive and future resistant models that will support learners now and for years to come.
ACKNOWLEDGMENTS
We thank Carnegie Learning for providing us the newer data set for analysis, and thank the school district for agreeing to our use of the data and supporting our research. We also thank the PSLC DataShop for making earlier data available. We thank the NSF for their support of this research through grant #DUE-2000405.
REFERENCES
- Almeda, M.V. and Baker, R.S. 2020. Predicting Student Participation in STEM Careers: The Role of Affect and Engagement during Middle School. 12, 2 (2020), 15.
- Baker, R.S., Corbett, A.T., Koedinger, K.R. and Wagner, A.Z. 2004. Off-Task Behavior in the Cognitive Tutor Classroom: When Students “Game the System.” 6, 1 (2004), 8.
- Baker, R.S.J. d., Corbett, A.T., Koedinger, K.R., Evenson, S., Roll, I., Wagner, A.Z., Naim, M., Raspat, J., Baker, D.J. and Beck, J.E. (2006), Adapting to When Students Game an Intelligent Tutoring System. Intelligent Tutoring Systems. M. Ikeda, K.D. Ashley, and T.-W. Chan, eds. Springer Berlin Heidelberg. 392–401.
- Baker, R. S., Corbett, A. T., & Wagner, A. Z. (2006). Human classification of low-fidelity replays of student actions. In Proceedings of the educational data mining workshop at the 8th international conference on intelligent tutoring systems (Vol. 2002, pp. 29-36).
- Baker, R., Walonoski, J., Heffernan, N., Roll, I., Corbett, A. and Koedinger, K. 2008. Why Students Engage in “Gaming the System” Behavior in Interactive Learning Environments. 19, 2 (2008), 185–224.
- Baker, R.S. and de Carvalho, A. 2008. Labeling student behavior faster and more precisely with text replays. Educational Data Mining. (Jun. 2008), 38.
- du Boulay, B. 2019. Escape from the Skinner Box: The case for contemporary intelligent learning environments. British Journal of Educational Technology. 50, 6 (Nov. 2019), 2902–2919. DOI:https://doi.org/10.1111/bjet.12860.
- Boyer, S. and Veeramachaneni, K. 2015. Transfer Learning for Predictive Models in Massive Open Online Courses. Artificial Intelligence in Education. C. Conati, N. Heffernan, A. Mitrovic, and M.F. Verdejo, eds. Springer International Publishing. 54–63.
- Chawla, N.V., Bowyer, K.W., Hall, L.O. and Kegelmeyer, W.P. 2002. SMOTE: Synthetic Minority Over-sampling Technique. Journal of Artificial Intelligence Research. 16, (Jun. 2002), 321–357. DOI:https://doi.org/10.1613/jair.953.
- Chen, T. and Guestrin, C. 2016. XGBoost: A Scalable Tree Boosting System. Proceedings of the 22nd ACM SIGKDD International Conference on Knowledge Discovery and Data Mining (San Francisco California USA, Aug. 2016), 785–794.
- Corbett, A.T. and Anderson, J.R. 1995. Knowledge tracing: Modeling the acquisition of procedural knowledge. User Modelling and User-Adapted Interaction. 4, 4 (1995), 253–278. DOI:https://doi.org/10.1007/BF01099821.
- DiCerbo, K.E. and Kidwai, K. 2013. Detecting Player Goals from Game Log Files. (2013), 2.
- Fancsali, S.E., Li, H., Sandbothe, M. and Ritter, S. 2021. Targeting Design-Loop Adaptivity. (2021), 8.
- Fogarty, J., Baker, R. S., & Hudson, S. E. (2005, May). Case studies in the use of ROC curve analysis for sensor-based estimates in human computer interaction. In Proceedings of Graphics Interface 2005 (pp. 129-136).
- Gardner, J., Yang, Y., Baker, R. and Brooks, C. 2018. Enabling End-To-End Machine Learning Replicability: A Case Study in Educational Data Mining. arXiv:1806.05208 [cs, stat]. (Jul. 2018).
- Gray, L. 2020. Teachers’ Use of Educational Technology in U.S. Public Schools: 2009, First Look. (2020), 70.
- Gundersen, O.E. and Kjensmo, S. 2018. State of the Art: Reproducibility in Artificial Intelligence. 32, 1 (Apr. 2018), 8.
- Izurieta, C. and Bieman, J.M. 2013. A multiple case study of design pattern decay, grime, and rot in evolving software systems. Software Quality Journal. 21, 2 (Jun. 2013), 289–323. DOI:https://doi.org/10.1007/s11219-012-9175-x.
- Jeni, L.A., Cohn, J.F. and De La Torre, F. 2013. Facing Imbalanced Data--Recommendations for the Use of Performance Metrics. 2013 Humaine Association Conference on Affective Computing and Intelligent Interaction (Geneva, Switzerland, Sep. 2013), 245–251.
- Jordan, M.I. and Mitchell, T.M. 2015. Machine learning: Trends, perspectives, and prospects. Science. 349, 6245 (Jul. 2015), 255–260. DOI:https://doi.org/10.1126/science.aaa8415.
- Karumbaiah, S., Lan, A., Nagpal, S., Baker, R.S., Botelho, A. and Heffernan, N. 2021. Using Past Data to Warm Start Active Machine Learning: Does Context Matter? LAK21: 11th International Learning Analytics and Knowledge Conference (Irvine CA USA, Apr. 2021), 151–160.
- Koedinger, K.R., Leber, B. and Stamper, J. 2010. A Data Repository for the EDM community: The PSLC DataShop. (2010), 43–56.
- Koedinger, K. R., Corbett, A. T., & Perfetti, C. (2012). The Knowledge‐Learning‐Instruction framework: Bridging the science‐practice chasm to enhance robust student learning. Cognitive science, 36(5), 757-798.
- Muldner, K., Burleson, W., Van de Sande, B. and VanLehn, K. 2011. An analysis of students’ gaming behaviors in an intelligent tutoring system: predictors and impacts. User Modeling and User-Adapted Interaction. 21, 1–2 (Apr. 2011), 99–135. DOI:https://doi.org/10.1007/s11257-010-9086-0.
- Ocumpaugh, J., Baker, R.S. and Rodrigo, M.M.T. 2015. Baker Rodrigo Ocumpaugh Monitoring Protocol (BROMP) 2.0 Technical and Training Manual. (2015), 73.
- Owen, V.E., Anton, G. and Baker, R. 2016. Modeling User Exploration and Boundary Testing in Digital Learning Games. Proceedings of the 2016 Conference on User Modeling Adaptation and Personalization (Halifax Nova Scotia Canada, Jul. 2016), 301–302.
- Paquette, L. and Baker, R.S. 2019. Comparing machine learning to knowledge engineering for student behavior modeling: a case study in gaming the system. Interactive Learning Environments. 27, 5–6 (Aug. 2019), 585–597. DOI:https://doi.org/10.1080/10494820.2019.1610450.
- Paquette, L., Baker, R.S. and Moskal, M. 2018. A System-General Model for the Detection of Gaming the System Behavior in CTAT and LearnSphere. Artificial Intelligence in Education. C. Penstein Rosé, R. Martínez-Maldonado, H.U. Hoppe, R. Luckin, M. Mavrikis, K. Porayska-Pomsta, B. McLaren, and B. du Boulay, eds. Springer International Publishing. 257–260.
- Quinlan, J.R.. (1993) C4. 5: programs for machine learning. Thousand Oaks, CA: Morgan Kauffmann.
- Richey, J.E., Zhang, J., Das, R., Andres-Bray, J.M., Scruggs, R., Mogessie, M., Baker, R.S. and McLaren, B.M. 2021. Gaming and Confrustion Explain Learning Advantages for a Math Digital Learning Game. Artificial Intelligence in Education. I. Roll, D. McNamara, S. Sosnovsky, R. Luckin, and V. Dimitrova, eds. Springer International Publishing. 342–355.
- Ritter, S., Anderson, J.R., Koedinger, K.R. and Corbett, A. 2007. Cognitive Tutor: Applied research in mathematics education. Psychonomic Bulletin & Review. 14, 2 (Apr. 2007), 249–255. DOI:https://doi.org/10.3758/BF03194060.
- Ritter, S., Harris, T. K., Nixon, T., Dickison, D., Murray, R. C., & Towle, B. (2009). Reducing the Knowledge Tracing Space. International Working Group on Educational Data Mining.
- Ritter, S., Yudelson, M., Fancsali, S. E., & Berman, S. R. (2016, April). How mastery learning works at scale. In Proceedings of the Third (2016) ACM Conference on Learning@ Scale (pp. 71-79).
- Sao Pedro, M.A., de Baker, R.S.J., Gobert, J.D., Montalvo, O. and Nakama, A. 2013. Leveraging machine-learned detectors of systematic inquiry behavior to estimate and predict transfer of inquiry skill. User Modeling and User-Adapted Interaction. 23, 1 (Mar. 2013), 1–39. DOI:https://doi.org/10.1007/s11257-011-9101-0.
- Schofield, J. W. (1995). Computers and classroom culture. Cambridge University Press.
- Twenge, J.M., Martin, G.N. and Spitzberg, B.H. 2019. Trends in U.S. Adolescents’ media use, 1976–2016: The rise of digital media, the decline of TV, and the (near) demise of print. Psychology of Popular Media Culture. 8, 4 (Oct. 2019), 329–345. DOI:https://doi.org/10.1037/ppm0000203.
- Whitehill, J., Mohan, K., Seaton, D., Rosen, Y. and Tingley, D. 2017. Delving Deeper into MOOC Student Dropout Prediction. arXiv:1702.06404 [cs]. (Feb. 2017).
- Xia, M., Asano, Y., Williams, J.J., Qu, H. and Ma, X. 2020. Using Information Visualization to Promote Students’ Reflection on “Gaming the System” in Online Learning. Proceedings of the Seventh ACM Conference on Learning @ Scale (Virtual Event USA, Aug. 2020), 37–49.
- Yudelson, M., Fancsali, S., Ritter, S., Berman, S., Nixon, T., & Joshi, A. (2014, July). Better data beats big data. In Educational data mining 2014.
- XGBoost developers. (2021). Python API Reference. XGBoost Documentation. Retrieved February 13, 2022, from https://xgboost.readthedocs.io/
© 2022 Copyright is held by the author(s). This work is distributed under the Creative Commons Attribution-NonCommercial-NoDerivatives 4.0 International (CC BY-NC-ND 4.0) license.