ABSTRACT
Although badges are among the most-used game elements in gamified education, studies about their optimal features to motivate learning are scarce. How should a badge be designed to represent an incentive for a specific goal like optimal exam preparation? This study examines usage data of a higher education learning app to determine whether the used badges have the intended motivational effect. The preliminary results suggest that the badges that were initially implemented in the app have the intended effect in most cases, but the stages of the multi-level badges could be optimized. The methodological framework used in this study can be transferred to usage data of other similar learning tools. With the help of easy-to-interpret outputs of decision trees, researchers and practitioners alike can work towards an optimal badge design.
Keywords
1. INTRODUCTION
Badges are among the most used elements in game-based learning [1, 18, 14]. Yet, little is known about their optimal design in the educational domain. I define a design in this context as optimal if a badge can only be earned by following a learning strategy that leads to improved learning outcomes. The inspiration for the design of badges in game-based learning often comes from entertainment games [3, 22]. However, the goals of such games are usually different from those of learning tools used in school or higher education [20]. This difference also applies to commercial learning apps such as Duolingo. In Duolingo, for example, it is possible to earn a badge called “Weekend Warrior” if you use the app on a Saturday or Sunday and a badge called “Photogenic” if you upload a profile picture1. These two badges are presumably intended to maximize usage time or identification with the app and are not necessarily aimed at an optimal learning strategy. Since designers of game-based learning tools may use such commercial apps as a blueprint, they run the risk of copying badges that motivate non-optimal learning strategies. This study should help educators that use badges in their learning tools to evaluate whether their chosen design motivates learning strategies that lead to better learning outcomes.
Empirical studies that investigate optimal badge design in learning contexts are rare. Easley and Ghosh [9] analyzed optimal badge design with a game-theoretic approach from a general but not an educational point of view. Antonaci et al. [1] link the effects of different game elements on learning outcomes in their literature review to investigate the question of which game elements cause which effects. They find that some game elements can have either a positive or a negative effect depending on the context (e.g., specific setting, other game elements used and the personality of the students). This result is also confirmed by recently conducted meta-studies [2, 15, 24]. They all report an overall positive significant small to medium effect size of game-based learning on learning outcomes. However, it is still unclear which factors contribute most to the success or failure of game-based education. In addition, the meta-studies above shed light only on the overall effects of combinations of different game elements. A more in-depth analysis of different badge designs (or other single game elements) does not exist yet. Facey-Shaw et al. [12] provide an overview of different badge designs and their functions in various educational applications. Still, they do not link the different designs to the achieved effects on the learning outcomes. The present study will contribute to this research gap.
The data set used in this study consists of usage data from a gamified learning app that has been in use for four semesters in an accounting lecture at a large European university. Among other game elements, the app uses badges to motivate the students to learn. The required achievements to earn the badges include specific amounts of consecutive usage days or answered questions. The corresponding goals were developed based on learning theories and practical experiences from past lectures but without any empirical validation. The goal of this study is to answer the question of whether students who aligned their learning strategy to the given badge goals performed better on the exam. Based on the results, the basic features but also the levels of the badges can be discussed. For example, the badge awarded for the amount of answered questions in the data set has three levels. The highest level is earned when a student answers 1,000 questions. Unless a large proportion of the top students answered that many questions in the app, you could conclude that the threshold might be too high. If the level is too high, earning that badge could even be a predictor for a bad performance in the exam, i.e., students who answer too many questions might overestimate the app as a learning tool and neglect other learning materials. The following two research questions will be answered in this study to contribute to the discussed research gap:
RQ1: Do the badges that were initially implemented in the gamified learning app incentivize a learning strategy that leads to good exam results?
RQ2: Are the levels of the multi-level badges optimally set?
2. RESEARCH SETTING
2.1 Lecture and App
The research subject of this study is data from a gamified learning app that was used in an undergraduate accounting course at a large public university in Europe. The course is usually taken by approximately 600 students per semester (see Table 1) and consists of a weekly lecture and bi-weekly tutorials and small group exercises. Attendance at the classes is voluntary. The learning materials consist of a script, a collection of exercises and a trial exam. In addition, a textbook and the corresponding exercise book are recommended for further study. Apart from the written exam at the end of the semester, there is no other formal assessment. In evaluations of past semesters, students often commented that there was no contemporary way to engage with the subject matter in addition the aforementioned traditional learning materials. As a result, the responsible chair applied for funding and planned to develop a smartphone app with gamification elements.
The launch of the app took place in the summer semester of 2019. Like attendance at the classes, the use of the app is voluntary and no formal advantages for the exam can be gained by using the app. The app is widely accessible, as in addition to an app version in Google Play Store and Apple App Store, it is also available as a web version that can be accessed via the browser. Over 550 questions were developed for the quiz app, covering all nine chapters of the course. There are four question types in the app: single and multiple-choice, as well as sorting and cloze text tasks. Students can use the app in three different modes: Chapter Mode, Random Mode, and Weekly Challenge. In Chapter Mode, students can choose to be shown only questions from a specific chapter. When they master a chapter, the next chapter is unlocked. The current status in a chapter is visualized by a progress bar. The corresponding progress is measured by the so-called Skill Level Indicator (SLI), which was designed based on Ebbinghaus’s forgetting curve [10]. When a question is answered correctly, the SLI increases to 100%. The result is that the corresponding question is no longer displayed for the time being. However, over time, the SLI decreases again to indicate that the content of the question may have been forgotten. After a certain duration (which becomes increasingly longer after answering the same question several times), the question is displayed again to check whether it is still correctly answered. In the second mode, Random Mode, questions are randomly drawn from the pool that have already been unlocked by the student. In the third mode, the Weekly Challenge, students can answer 25 randomly selected questions once a week from chapters that have already been covered in the lecture. They can then compare their performance with that of fellow students on a leaderboard. The more questions students answer, the more learning points they earn in the app and level up accordingly. Moreover students can earn the before mentioned badges for certain achievements (see Figure 2). A detailed description of the initial badge set is outlined in Section 2.4 and more information about the app in general and its usage can be found in [19].
2.2 Data Sources
The collected data in this study consists of three different sources over four semesters (see Table 1): the exam results of every enrolled student, the app usage data and responses from a survey conducted each semester.
| SS19 | WS19 | SS20 | WS20 | |
|---|---|---|---|---|
| App | 559 | 595 | 447 | 546 |
| Exam | 575 | 648 | 616 | 644 |
| Survey | 127 | 108 | 114 | 167 |
| App+Exam | 230 | 243 | 190 | 190 |
The collected usage data from the app consists of various details, including the exact time a question was answered, the answer given, and whether it was correct or incorrect. The functions and design of the app did not change in any of the four semesters considered in this study. Since no laboratory conditions prevail in the present setting, it was important to keep as many parameters constant as possible [5, 11]. In addition to the app version, the instructors, the learning materials, and the type of exam were not changed over the entire observation period. In each semester, the exam consisted mainly of arithmetic problems and contained three major tasks, each worth 30 points, which were divided into smaller sub-tasks. Even though the style of the exam remained identical over the semesters, it cannot be guaranteed that the level of difficulty remains the same between semesters. This circumstance is considered in the evaluation and assignment of grades, i.e., a specific number of points can result in a different grade in different semesters. Therefore, the analysis in this study uses grades rather than points as the dependent variable to control for the effect of varying difficulty. Grades in this setting range from 1.0 (very good) to 5.0 (failed).
One limitation regarding the analysis of the data is that I need the students’ matriculation numbers to be able to connect the data points from the app and the exam. Due to data protection rules, I was was obliged to ask the students for their matriculation number in the app on a voluntary basis. As not every student provided his or her matriculation number, I am only able to connect the data of the two data sources for a limited number of students (see Table 1). Therefore, I cannot analyze the app’s influence on every exam result because I do not know for every student in the exam score list to which extent they used the app. To address this issue, a later section of this paper will examine whether students who gave consent for their data to be used for research purposes differ significantly from students who withheld consent.
The third data source is a survey that was conducted every semester. Although the average response rate of the survey (26%) is comparable with similar prior studies [25, 17, 26], I decided not to connect the survey answers to the other two data sources for the present study. To be able to connect the survey answers, the students also needed to submit their matriculation number with the survey answers. As only a small fraction followed this request, the sample size with information from all three data sources would be significantly smaller than the sample size with data only from the app and the exam (see Table 1). However, Table 2 shows with data from the survey that the four cohorts did not differ significantly in the major demographics and can therefore be considered comparable for this study.
| SS19 | WS19 | SS20 | WS20 | |
|---|---|---|---|---|
| Male | 59.05% | 53.70% | 47.30% | 49.18% |
| Female | 40.95% | 46.30% | 52.70% | 50.82% |
| Age | 21.82 | 21.10 | 21.81 | 21.24 |
| Semester | 3.73 | 3.27 | 3.61 | 3.41 |
2.3 Methodology
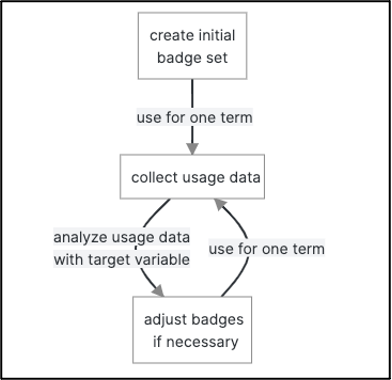
To analyze the badges implemented initially, the badges and the corresponding learning metrics are discussed below in a first step. In a second step, to answer the first research question, I will analyze whether students who followed the learning strategy motivated by the badges performed better in the exam by comparing the average grades. To answer the second research question, a decision tree is built to illustrate the influence of certain limits of the previously mentioned learning metrics on the average grades. The decision tree method is used because its results are easy to interpret and explain. This advantage is significant if the results and the corresponding analysis framework are to be used in practice. For this, especially the graphical representation method is very suitable, especially in comparison to a traditional regression output. The disadvantages of the method are the lower predictive accuracy (e.g., compared to random forests) and the fact that they are less robust than other approaches [16]. However, from my point of view, the advantages outweigh the disadvantages for the chosen purpose. All analyses for this study were conducted in R (4.1.1) and to create the decision tree the packages rpart (4.1-15) and rpart.plot (3.1.0) were used. The resulting flow chart of a decision tree can be used to evaluate and adjust the limits of the multi-level badges to increase the motivational effect if necessary. In practice, the optimized badge set would then be used for another term and afterwards the resulting usage data would again be evaluated with regards to the target variable. This general iterative process can be summarized as outlined in Figure 1.
2.4 Initial Badge Design
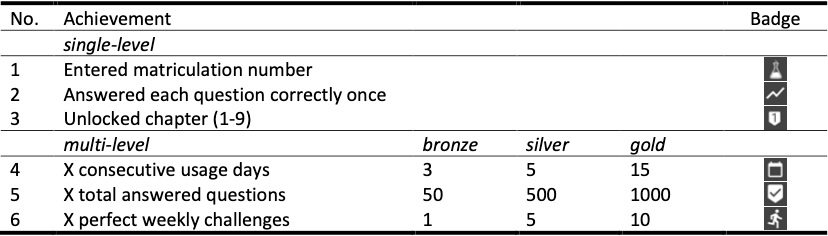
The initial badge set included badges in six categories (see Figure 2). The badges can be divided into single-level badges (one learning metric results in one single badge) and multi-level badges (one learning metric results in multiple badges divided into different stages). The first badge was awarded for students entering their matriculation number to share their usage data for research purposes. Since this is not a learning strategy or a measure of learning success, this badge will not be discussed further in this study. The remaining five badge categories and the corresponding learning metrics are discussed in the following sections.
2.4.1 Unique Questions
The second badge in Figure 2 is awarded if a student answered every question in the database correctly once. The influence of this badge is evaluated with the learning metric “Unique Questions”. This metric measures how many different questions a user has answered. As explained in Section 2.1, the SLI ensures that a question that has been answered correctly is only displayed again after a certain time. Nevertheless, each question can in principle be answered multiple times, which is why “Unique Questions” provides valuable information. The further a user has worked through the chapters, the higher this metric will be. If a student uses the app regularly, but only answers questions from the first chapter, this may result in a high number of total answers, but probably does not reflect a meaningful learning strategy. A user with the same number of total answered questions but more unique questions presumably has learned more and therefore a higher probability for a good exam performance.
2.4.2 Maximal Chapter
As described in Section 2.1 the rules of the app require a user to work through one chapter at a time. This means that each student starts in the first chapter and must master it to a certain degree to unlock the second chapter. This process continues until the final chapter nine. When a chapter is unlocked, the corresponding badge is awarded to the student. The learning metric “Maximal Chapter” measures the highest chapter a user has unlocked. As discussed in the previous section, a learning strategy that covers higher chapters is presumably more successful regarding exam preparation than an intensive usage only in lower chapters. A student with the same number of answers but a higher number of different chapters likely prepared better for the exam than a student with the same (or a higher) number of questions that only cover the topics of the first chapters.
2.4.3 Highest Streak
According to prior research, the sequence of learning days can play a decisive role in determining learning success [21]. Continuous learning is considered to be better suited for knowledge retention than concentrating the same learning time on a few days. The goal of the badge in the fourth category in Figure 2 was to promote a continuous learning strategy. Using the app for several continuous days can manifest a habit, making it easier to learn for the days to come. The extent to which this learning strategy was used is measured by the learning metric “Highest Streak”. It states the highest number of consecutive usage days of a user in each semester. The intention of this badge was that a higher streak would lead to a better exam result. This badge is the first multi-level badge in Figure 2. The three stages are 3, 5, and 15 consecutive days.
2.4.4 Total Answers
The number of total answers given provides a basic estimate of the quantitative intensity of app usage. If a student has used the app frequently, this is necessarily indicated by a high number of answered questions. In comparable studies with data from learning management systems, such a conclusion is not so simple, since, for example, documents can also be read, but the actual reading time is not necessarily reflected in the log data [8, 13]. The click on a document in an LMS is captured, but usually there is no data about how long (and focused) the document was read. However, since there is no information to be passively consumed in the app other than feedback messages after a question, there is no reason to believe that a student remains studying at a single question for an extended time after answering it. If a student uses the app more, it presumably means that he or she learns more in general. On the one hand, it is proof of the fact that the student learns directly in the app. On the other hand, more intensive app use can also be a proxy for the fact that the student generally learns more and, for example, also engages more with the other learning materials. Nevertheless, this metric is a purely quantitative measurement without a qualitative assessment of the learning strategy. For example, a student with a certain number of answers that are all false has the same value of this learning metric as a student with exclusively right answers. However, as more learning time is considered to lead to better performance, this badge was designed to motivate a higher degree of usage time [4, 27]. This badge is the second multi-level badge in Figure 2 and is awarded for the stages of 50, 500, and 1000 answers.
2.4.5 Weekly Challenges
Competitive students are considered to be more motivated to achieve a better result in the final exam [6]. Therefore, the last badge in Figure 2 should motivate to participate in the Weekly Challenge. As the Weekly Challenge is entirely voluntary and no real rewards can be earned, an intensive use of this mode is considered a good proxy for a student to be highly competitive. The influence of this badge is analyzed with the learning metric “Weekly Challenges”, measuring the number of Weekly Challenges a student participated in. This multi-level badge is awarded for the stages 1, 5, and 10 Weekly Challenges.
3. RESULTS
3.1 Evaluating Initial Badges (RQ 1)
The following analyses examine whether the badges initially implemented in the app motivate successful learning strategies. For this purpose, I examine whether the students who earned the badges achieved a better grade on average than the students who did not.
| Badge | Grade Average | n |
|---|---|---|
| No | 2.84 | 799 |
| Yes | 1.95 | 53 |
| Badge | Grade Average | n |
|---|---|---|
| 0 | 3.37 | 137 |
| 1 | 3.34 | 87 |
| 2 | 3.21 | 88 |
| 3 | 3.22 | 79 |
| 4 | 2.74 | 54 |
| 5 | 2.54 | 43 |
| 6 | 2.61 | 27 |
| 7 | 2.92 | 25 |
| 8 | 2.56 | 45 |
| 9 | 2.13 | 267 |
| Highest Streak | Total Answers | Weekly Challenges
| ||||
|---|---|---|---|---|---|---|
| Badge | Grade Average | n | Grade Average | n | Grade Average | n |
| none | 3.00 | 539 | 3.38 | 226 | 3.13 | 432 |
| bronze | 2.43 | 200 | 2.94 | 284 | 2.55 | 335 |
| silver | 2.41 | 108 | 2.36 | 134 | 1.93 | 56 |
| gold | 2.46 | 5 | 2.21 | 208 | 2.07 | 29 |
Tables 4 and 5 show the average grades of the students who received the different badges based on the learning metrics “Unique Questions” and “Maximal Chapter”. In Table 4, it can be seen that the average grade of the students who answered all 551 questions is better than that of the comparison group. A similar picture emerges for the learning metric “Maximal Chapter”. The general trend shows that the more chapters have been unlocked, the better the average grade of the students. Although the trend is not ascending in every chapter step but has a small bump at chapters 3, 6, and 7, the result suggests that students who unlock more chapters perform better in the exam.
The following analyses examine the multi-level badges in the initial badge set (see Table 5). Students are divided into four groups: Those who did not achieve even the smallest stage, and those who achieved at least bronze, silver, or gold, respectively (see Figure 2). Here, too, the average grades in the final exam are compared group by group. Again, the trend for all three badges is that the higher a student climbs on the badge levels, the better the average grade on the exam. However, the effect size differs from badge to badge. For the badge “Highest Streak” the average grade improves by 0.54 to 0.59 depending on which stage was reached. Nevertheless, it should be noted that the gold stage was only achieved by 5 students. This already indicates that the highest stage may have been set too high. The average grade difference between the students who did not achieve any badge in the category “Total Answers” and those who achieved gold status is exceptionally high. Students who have not achieved any of the three levels obtained an average grade of 3.38 while students with a gold badge had an average grade of 2.21. The badge “Weekly Challenges” also shows that students at the higher levels tend to have better average grades. However, students with a gold badge have a slightly lower average grade (2.07) than students with a silver badge (1.93). The analysis of this badge also shows (although not quite as strongly as “Highest Streak”) that the higher levels were only achieved by comparatively few students suggesting that the thresholds were set too high. In summary, however, all initially created badges seem to motivate learning strategies that lead to better grades. The first research question (see Section 1) can therefore be answered affirmatively.
3.2 Evaluating Stages of Multi-Level Badges (RQ 2)
Still, as indicated in the previous analyses, the designs of initial badges should be further investigated to answer the second research question. Since the thresholds of the multi-level badges were based on common sense but not empirically validated due to a lack of data, I analyze in the next step, whether other stages are more appropriate to provide an optimal motivational effect. For this purpose, a decision tree will be generated with the app usage data as independent variables and the exam grades as dependent variable. The idea of such a decision tree is to determine the boundaries of the learning metrics that are best suited to divide the group into different subgroups. In other words, at what level of the metrics is the difference between the group that exceeds the level to the group that does not exceed the level the greatest. For example, if all students who answered more than 3,000 questions have a 1.0 on the exam, it would seem to make little sense to include another stage at 4,000 answered questions. Since the discussed learning metrics are at least partially related (e.g., higher maximum chapter necessarily results in higher unique questions), all learning metrics are examined simultaneously. Moreover, all badges and not only the ones originally created as multi-level are considered in the calculations. This will allow to identify whether there are reasonable thresholds for single-level badges as well, and whether they should therefore be converted into multi-level badges. The result of the corresponding decision tree is shown in Figure 3.
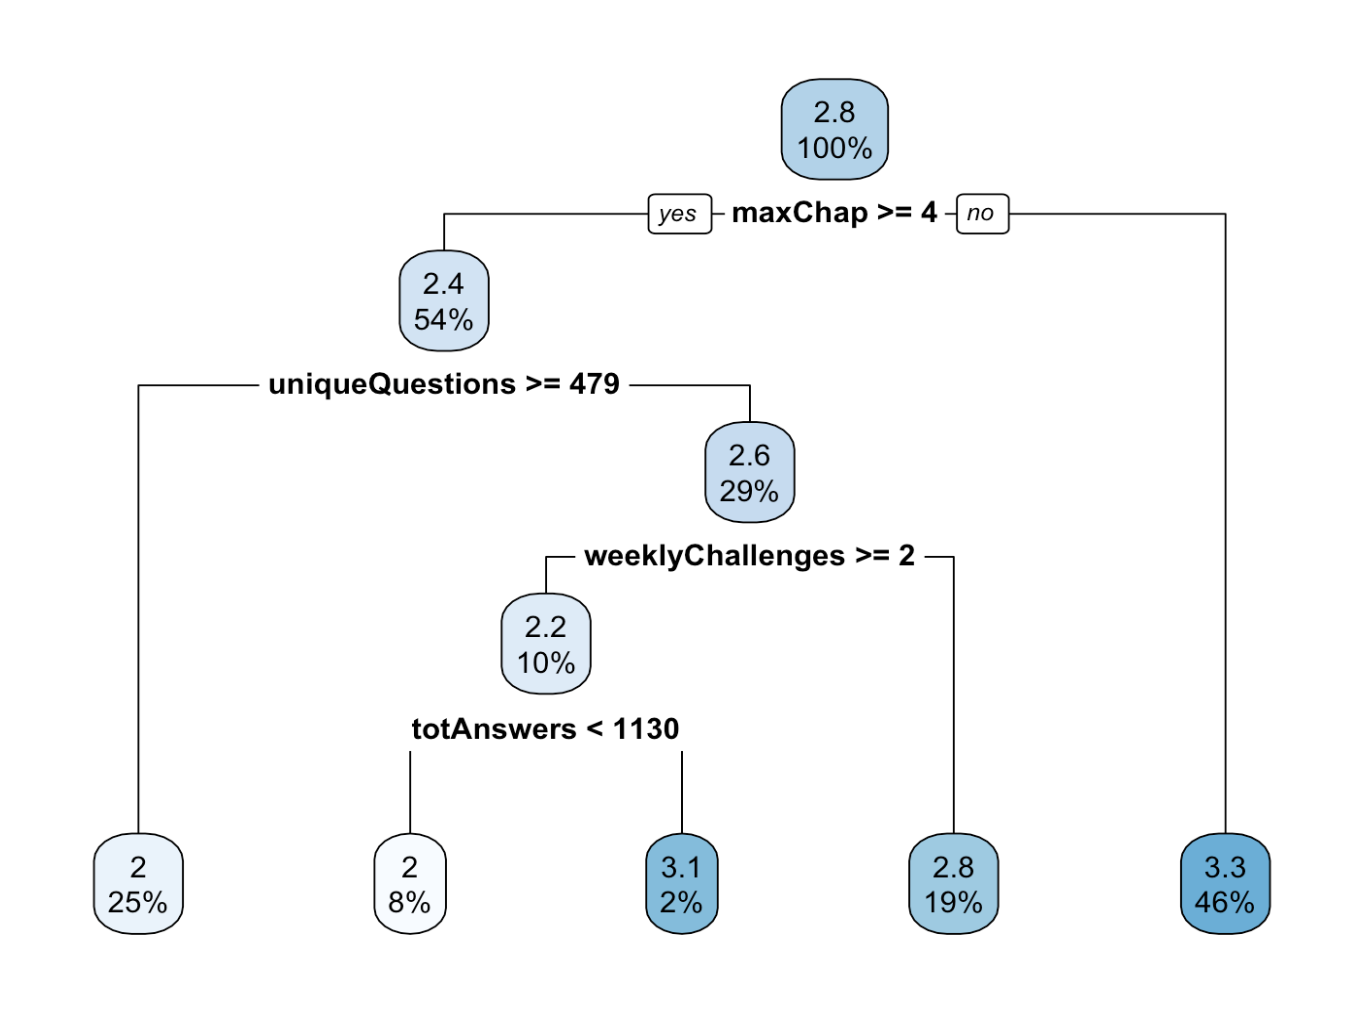
The decision tree can be interpreted as follows. “Maximum Chapter” is the most important learning metric for group classification in the data set. The average grade for all students is 2.8. For students who have only worked on chapters 1 to 3, the grade average is 3.3, and for students who have worked on at least chapter 4, the grade average is 2.4. The result can be interpreted in such a way that, for example, the badge for chapter 4 should be particularly highlighted, as it seems to mark an important threshold. In the next step, the learning metric “Unique Questions” is used for further subdivision. If students have answered at least 479 unique questions, the grade average improves to 2.0, if not, it declines to 2.6. The badge for “Unique Questions” has so far only been awarded if all questions, i.e. 551, have actually been answered. The data show that a change should be considered, and the badge should be changed from a single-level to a multi-level badge with one level at around 479. In the next step, the group with less than 479 unique questions is subdivided according to the metric “Weekly Challenges”. If a student participated in less than 2 Weekly Challenges, the average grade worsens from 2.6 to 2.8. If the number of Weekly Challenges is at least 2, the average grade increases to 2.2. Since the smallest level of this multi-level badge was 1, the result not necessarily indicates a need for action at this point. In the last step, the group is subdivided based on the “Total Answers”. However, the subdivision goes in the opposite direction at this point. The average score improves to 2.0 if less (!) than 1,130 questions were answered. If more than 1,130 questions are answered, the average grade deteriorates to 3.1. Therefore, it does not seem to be a good strategy to simply answer as many questions as possible. However, it should be emphasized that this advice includes all the subdivisions made previously, so the limit of 1,130 answers should not be considered in isolation. In addition, it should be emphasized that “Highest Streak” was also included in the analysis but is apparently not suitable as a criterion for subdividing the groups.
3.3 Group Comparison
As discussed in Section 2.2, the data used in this study only comes from students who gave consent to sharing their usage data for research purposes. As all other usage data cannot be connected to exam results, it is omitted from the analyses in this study. This circumstance entails the risk that the corresponding results can only be interpreted considering a selection bias. Table 6 contains the result of the group comparison regarding the learning metrics of all active users that gave consent to share their usage data with the students who did not:
| Yes | No | |
|---|---|---|
| Consent | (n=838) | (n=1,023) |
| Unique Questions | 254.13 | 170.08 |
| Maximal Chapter | 5.42 | 4.04 |
| Highest Streak | 2.77 | 2.22 |
| Total Answers | 649.81 | 405.38 |
| Weekly Challenges | 1.79 | 0.95 |
The results show that there is a substantial difference between the two groups. An evaluation of every difference with a two-sided t-test showed a high significance in each comparison (p < 0.01). Users who have entered their matriculation number in the app and thus consented to the use of their data for research purposes are more active in the app than those who have withheld this consent. As the analyses in the preceding sections only contain the data from the subgroup who gave consent to the usage of their data, the effects of the learning metrics on exam score from the examined subsample cannot be unconditionally generalized to the whole sample due to a selection bias.
4. DISCUSSION
The objective of the present study was to develop an approach to test the design of badges in a gamified learning app with respect to the motivation of optimal learning strategies. In the first step, I examined whether the badges developed for the launch of the app motivate learning strategies that lead to better grades. This could be affirmed. In the second step, I evaluated whether the levels of multi-level badges were optimally selected. A decision tree was developed for this purpose. The result of this analysis was that the originally selected levels could be optimized. However, as the decision tree output suggests a single threshold for each badge, a still open question is whether this threshold should be a replacement or if the future badge should only have two stages. This result could be considered in one of the next updates and in the following semester it could be checked if the newly chosen levels are optimal. This iterative process can also be applied to other learning applications. The major advantage of a decision tree here is that the results are very easy to interpret and transfer into practice. In my view, this advantage outweighs the disadvantages of this method (e.g., lower accuracy).
While the proposed process can be applied to other learning applications, the specific results for this project must be interpreted with caution. Due to the strict data protection rules at the university, I could not evaluate the data of all users, but only of those who gave us their permission to do so. This leads to a selection bias in the results. Thus, the effect of the badges cannot be confirmed for the entire cohort and therefore any adjustments to the badge architecture have to be made taking this issue into account. As previously described, one result of the study is that the levels of multi-level badges should be reconsidered. However, it could also be that certain learning strategies are not represented at all by the currently implemented badges. Therefore, in a future study, other learning strategies and the corresponding learning metrics will be developed and it will be examined whether these led to better exam results. If so, designing a corresponding badge to motivate the learning strategy would need to be considered. Until now, for example, the temporal aspect of the learning process has not been taken into account. Theoretically, the usage measured with most of the previously determined learning metrics could have taken place on one single day of the semester. More realistic are probably multiple days, but these could have been, e.g., shortly before the exam (indicating a cramming behavior) or directly at the beginning of the semester. A large body of research suggests that spaced repetition is best for optimal learning success [7]. If a student follows this strategy, he or she will have used the app on more days than a student who only started studying shortly before the exam and therefore followed a cramming strategy. This fact could be measured by a metric that states how many days in the semester a student has answered at least one question. In principle, it can be assumed that on average more learning days lead to a better performance in the exam. However, since there may also be an upper limit above which the marginal benefit decreases, a multi-level badge could be a suitable solution. Moreover, an early start could be decisive for successful course completion [23]. Therefore, the first use of the app in relation to the exam date could be measured in days. The extent of usage is measured by the metrics already discussed but this metric would measure whether a student started to use the app early in the semester. Therefore, students with an extreme cramming strategy, i.e., with the intention to start learning shortly before the exam would have a low expression of this figure. An implementation of this learning metric into the decision tree would show if there is a certain starting date that should be incentivized by a badge.
5. REFERENCES
- A. Antonaci, R. Klemke, and M. Specht. The effects of gamification in online learning environments: a systematic literature review. In Informatics, volume 6, page 32. Multidisciplinary Digital Publishing Institute, 2019. Issue: 3.
- S. Bai, K. F. Hew, and B. Huang. Does gamification improve student learning outcome? Evidence from a meta-analysis and synthesis of qualitative data in educational contexts. Educational Research Review, 30:100322, 2020. Publisher: Elsevier.
- L. Blair. What video games can teach us about badges and pathways. Digital Badges in Education: Trends Issues and Cases, pages 62–70, 2016.
- B. S. Bloom. Time and Learning. American Psychologist, 29(9):682–688, 1974. Publisher: ERIC.
- A. G. Brink. The Impact of pre-and post-lecture quizzes on performance in intermediate accounting II. Issues in Accounting Education, 28(3):461–485, 2013.
- N. E. Cagiltay, E. Ozcelik, and N. S. Ozcelik. The effect of competition on learning in games. Computers & Education, 87:35–41, 2015.
- S. K. Carpenter, N. J. Cepeda, D. Rohrer, S. H. Kang, and H. Pashler. Using spacing to enhance diverse forms of learning: Review of recent research and implications for instruction. Educational Psychology Review, 24(3):369–378, 2012. Publisher: Springer.
- R. Conijn, C. Snijders, A. Kleingeld, and U. Matzat. Predicting student performance from LMS data: A comparison of 17 blended courses using Moodle LMS. IEEE Transactions on Learning Technologies, 10(1):17–29, 2016. Publisher: IEEE.
- D. Easley and A. Ghosh. Incentives, gamification, and game theory: an economic approach to badge design. ACM Transactions on Economics and Computation (TEAC), 4(3):1–26, 2016.
- H. Ebbinghaus. Memory: A contribution to experimental psychology. Annals of neurosciences, 20(4):155–156, 2013. Publisher: SAGE Publications.
- S. Einig. Supporting students’ learning: The use of formative online assessments. Accounting Education, 22(5):425–444, 2013.
- L. Facey-Shaw, M. Specht, P. Van Rosmalen, D. Brner, and J. Bartley-Bryan. Educational functions and design of badge systems: A conceptual literature review. IEEE Transactions on Learning Technologies, 11(4):536–544, 2017. Publisher: IEEE.
- D. Gašević, S. Dawson, T. Rogers, and D. Gasevic. Learning analytics should not promote one size fits all: The effects of instructional conditions in predicting academic success. The Internet and Higher Education, 28:68–84, 2016. Publisher: Elsevier.
- J. Hamari. Do badges increase user activity? A field experiment on the effects of gamification. Computers in human behavior, 71:469–478, 2017.
- R. Huang, A. D. Ritzhaupt, M. Sommer, J. Zhu, A. Stephen, N. Valle, J. Hampton, and J. Li. The impact of gamification in educational settings on student learning outcomes: a meta-analysis. Educational Technology Research and Development, 68(4):1875–1901, 2020. Publisher: Springer.
- G. James, D. Witten, T. Hastie, and R. Tibshirani. An introduction to statistical learning. Springer, 2021.
- M. D. Kaplowitz, T. D. Hadlock, and R. Levine. A comparison of web and mail survey response rates. Public Opinion Quarterly, 68(1):94–101, 2004. Publisher: Oxford University Press.
- J. Koivisto and J. Hamari. The rise of motivational information systems: A review of gamification research. International Journal of Information Management, 45:191–210, 2019. 160 citations (Crossref) [2021-04-21].
- J. Langenhagen. The Use of a Gamified Learning App in Accounting Education: Exploring the Impact of COVID-19. In International Workshop on Higher Education Learning Methodologies and Technologies Online, pages 156–169. Springer, 2021.
- C. S. Loh, Y. Sheng, and D. Ifenthaler. Serious games analytics: Theoretical framework. In Serious games analytics, pages 3–29. Springer, 2015.
- D. Malekian, J. Bailey, and G. Kennedy. Prediction of students’ assessment readiness in online learning environments: the sequence matters. In Proceedings of the Tenth International Conference on Learning Analytics & Knowledge, pages 382–391, 2020.
- R. McDaniel. What we can learn about digital badges from video games. In Foundation of digital badges and micro-credentials, pages 325–342. Springer, 2016.
- S. Palmer. Modelling engineering student academic performance using academic analytics. International Journal of Engineering Education, 29(1):132–138, 2013. Publisher: International journal of engineering education.
- M. Sailer and L. Homner. The Gamification of Learning: a Meta-analysis. Educational Psychology Review, 32(1):77–112, 2020. Publisher: Springer Nature BV.
- L. J. Sax, S. K. Gilmartin, and A. N. Bryant. Assessing response rates and nonresponse bias in web and paper surveys. Research in Higher Education, 44(4):409–432, 2003. Publisher: Springer.
- T.-H. Shih and X. Fan. Comparing response rates in e-mail and paper surveys: A meta-analysis. Educational Research Review, 4(1):26–40, 2009. Publisher: Elsevier.
- J. Stallings. Allocated academic learning time revisited, or beyond time on task. Educational Researcher, 9(11):11–16, 1980. Publisher: Sage Publications Sage CA: Thousand Oaks, CA.
1https://duolingo.fandom.com/wiki/Achievements
© 2022 Copyright is held by the author(s). This work is distributed under the Creative Commons Attribution-NonCommercial-NoDerivatives 4.0 International (CC BY-NC-ND 4.0) license.