ABSTRACT
This study applied a problem-based learning framework to visualize students’ problem-solving patterns using sequential log data. Comparing the theory-informed visualization with a graph without theoretical guidance proved that problem-solving visualizations with a theoretical foundation were more interpretable for researchers and educators. The presentation of the graph was more explicit, and the outcomes can be generalizable to other related PBL studies. Besides, the theory-informed visualization can also be used by teachers to provide differentiated scaffoldings to support different groups of students when facilitating problem-based learning activities.
Keywords
BAckground & INTRODUCTION
Problem-based learning (PBL) is an instructional method in which students learn through facilitated problem solving that centers on an ill-structured problem [8]. It is a constructivist educational strategy and should be performed via a student-centered pedagogical approach [6]. In other words, when engaging in a PBL activity, learners should take a more active role in obtaining knowledge and skills [9]. Instructors need to serve as facilitators who provide individualized instructions to accommodate students’ diverse progress [17].
In a constructivist activity like PBL, students would be at different paces and engage in various tasks. Thus, to better facilitate students’ problem-solving, it is vital to monitor their progress [6]. Only after educators or researchers tracked students’ different progress successfully and precisely, then they could provide individualized instructions to facilitate students [13].
The recent advancement of virtual PBL environments provided researchers opportunities to track students’ problem-solving progress [3]. When students were engaging with virtual PBL environments, a large number of usage clickstream log data would be generated. The clickstream log data is time-stamped and captures students’ fine-grained behaviors [18]. Researchers and educators can employ these data to monitor students’ real-time progress or to provide just-in-time interventions.
The collected log data is often large amounts and consists of multiple features including student ID, timestamp including start time, end time, the name of accessed tool, tool use actions such as tool open or close, and so on. Collecting the clickstream log is just the first step, a more crucial step is how researchers and educators process the log data to make it interpretable for further educational practices. In this case, educational theories are needed in guiding researchers to process the collected log data and make it interpretable and relevant to educators.
purpose of study
The research involving collecting, analyzing, and reporting learners’ usage log data is considered learning analytics studies (LA). Researchers have been exploring and refining the approaches of incorporating educational theories when conducting LA studies [2]. For instance, a study [7] incorporated the framework of engagement in processing student-generated log data on MOOCs. Researchers applied exploratory and confirmative factor analysis upon collected log data, and related the outcome factors to three engagement constructs: affective, cognitive, and behavioral engagement. This theory-informed data processing allowed researchers better to interpret the association between usage logs and learner performance. For example, learners’ video watching duration is associated with final scores because they were positively correlated with the behavioral and cognitive engagements. In another study [15], researchers mapped usage logs on learning management systems to self-regulated learning (SRL) phases. For instance, students’ actions of accessing objectives or lesson overviews were associated with the Forethought phase of SRL. These actions reveal the traces of learners’ goal-setting behaviors, an important component of the forethought phase. Following the SRL framework, researchers could draw a clear path between nuanced learning analytics features and the nuances of learning theories. In return, the framework provided a solid theoretical foundation for further instructional practices and the future designs of the learning platforms. Although researchers have taken initiatives of involving theories to process log data generated from various educational platforms. However, selfdom studies have focused on incorporating theories to process problem-solving behavioral logs. Although previous studies applied LA techniques to analyze problem-solving logs [3, 12], however, to produce inferable and generalizable research findings for future PBL research, more theory-based log processing approaches are needed.
In addition, data visualization was widely applied in representing log data outcomes, especially when the amount of data is large [11]. LA studies can be benefited from data visualization techniques is because the visualizations can represent the large amount of data in a compact format without losing essential information [1]. For example, a study [4] extracted student log data from a virtual geometry game to visualize their problem-solving patterns. These graphs helped researchers to examine students’ problem-solving patterns explicitly, they were able to see whether students were on the expected path during the activity. In another study [14], researchers used area graphs to represent students’ different tool usage frequencies in a virtual PBL environment. These graphs allowed researchers to efficiently identify the different usage patterns between different groups of students. Using log data to create data visualizations brings researchers larger flexibility to examine user behavior patterns from different aspects. The outcomes of the visualizations could also be used in the classroom to inform teachers about providing just-in-time supports [16].
Considering the advantage of data visualization and the need to incorporate educational theories in processing log data, especially in the PBL context. The purpose of this study is to merge the gap by providing a theory-informed LA method to process sequential behaviors generated in a PBL activity. Then, by visualizing the sequential outcomes, the ultimate goal of proposing this approach is to (1) generate theory-based interpretable sequential patterns for researchers and (2) assist teachers in being better informed about students’ progress to support their PBL facilitation.
Method
Research Context
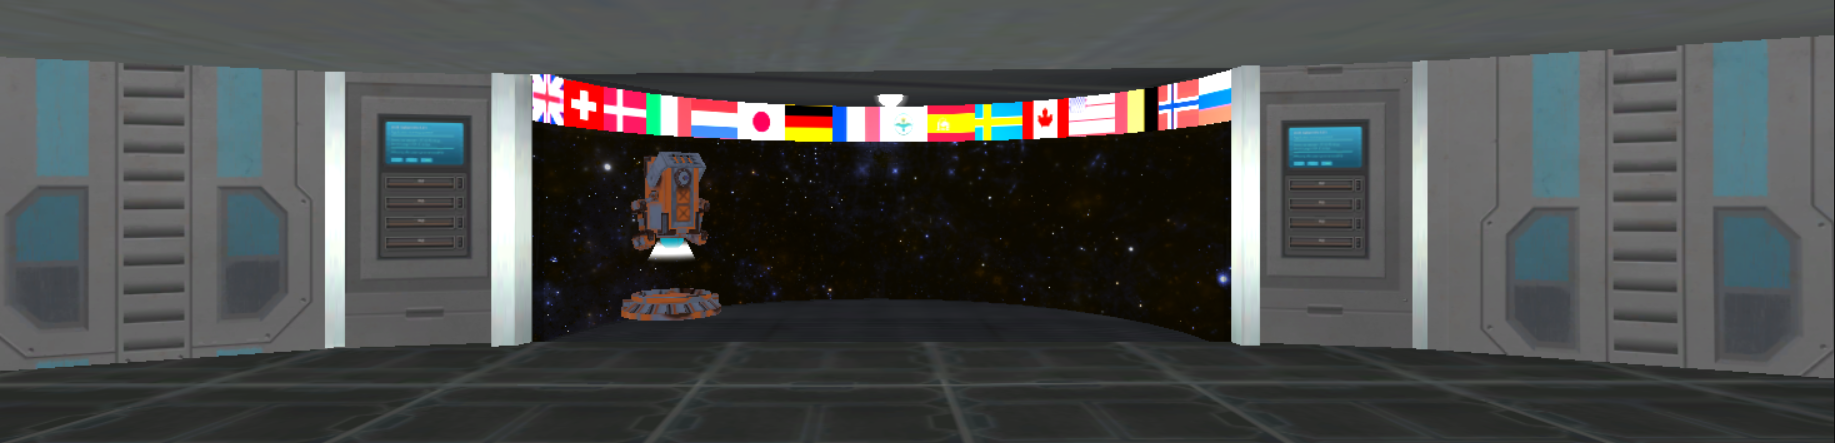
The PBL environment applied in this study is called Alien Rescue (AR). In this environment, students play the role of scientists to help six alien species to relocate to our solar system. By solving the problem of which species can survive on which planet or moons in our solar system, students would gain related scientific knowledge aligned with 6th-grade science standards.
Figure 1 presents the screenshots of the AR environment. It is a 3D immersive problem-solving platform, and there are ten different cognitive tools embedded for students to use. These tools, like the Solar system database or Notebook, can provide students with needed information and scaffoldings to find the solutions.
Participants and Data Source
A total of 114 six grade students engaged with the AR PBL environment through 15 class sessions. More specifically, 61 students conducted this activity virtually at home, and 53 students conducted this activity in-person at school.
In all, 45554 lines of behavioral log data generated by participants were collected for data processing and analysis. The features of the collected log data include:
- Student ID.
- Activity start time (by second).
- Activity end time (by second).
- The name of the accessed tool.
- Tool usage actions such as tool open or close.
Theory-Informed Data Processing
To track and analyze students’ problem-solving behaviors and present generalizable outcomes, the framework of PBL process was applied [8]. Based on the framework, problem-solving usually consists of multiple phases, including identifying facts (IF) and Knowledge deficiency (IKD), generating hypotheses (GH), and Solutions (GS). Learners perform the phases iteratively or in different order until solutions are produced. To better interpret students’ problem-solving patterns using log data and related to the framework, 28 different kinds of behavioral log actions in AR were connected with several problem-solving phases based on the concept of each phase [8]. Table 1 presents an example of the alignment. The first phase in the framework is the activities for students to understand the problem scenario. AR environment provides several tools such as Alien or Concept Databases for students to collect the information they need for solving the problem. Thus, the access to these tools aligns with the idea of Identify Facts (IF) phase. Plus, students needed to generate possible hypotheses as they gathered more information. The probe sending feature in AR is a critical component that students can actively obtain information to generate hypotheses. Thus, the actions related to sending probes were aligned with Generate Hypothesis (GH) phase. Moreover, AR provided students with a Notebook tool to organize collected information and identify missing pieces, which resonates with the phase Identify Knowledge Deficiency (IKD). Plus, Notebook also allows students to generate possible solutions via a Comparing Notes feature. This feature lets students conveniently compare the information they obtained in the environment to decide which place is suitable for which alien. In this case, actions relevant to comparing notes were aligned with Generate Solution (GS) phase.
Log Activities in AR | Phases in PBL Cycle | Definition |
|---|---|---|
Alien Database: Click Concept Database: Click | Identify Facts (IF, index = 1) | Students identify the relevant facts from the environment, which helps them represent the problem. |
Probe Design: Change Probe Name; Click Back Button | Generate Hypothesis (GH, index = 2) | Students take the initiative to generate possible hypotheses as they understand the problem better. |
Notebook: Click; Create; Delete; Edit | Identify Knowledge Deficiency (IKD, index = 3) | Students identify the knowledge that is gathered against knowledge that is still needed. |
Notebook: Compare; Edit | Generate Solutions (GS, index = 4) | Students use the obtained knowledge to produce solutions. |
Ultimately, all log data were transformed into 1789 sequences that reflect students’ problem-solving sequential patterns. Table 2 presents an example of processed outcomes. For instance, the first row indicates the sequence performed by student 1 in May. 25th is IF, IKD, GH, IF, IKD, and GS, which is different from the sequence the student conducted in May. 26th. These sequences were then used for sequential analysis and creating visualizations to examine student problem-solving patterns.
Student | Date | Activity Sequence |
|---|---|---|
Student 1 | May.25th | [1, 3, 2, 1, 3, 4] |
Student 1 | May.26th | [1, 3, 1, 3, 1, 4, 1, 4, 1] |
Student 2 | May.25th | [1, 2, 1, 3, 2, 1, 3, 1, 2, 3] |
Note. 1 = Identify Facts (IF), 2 = Generate Hypothesis (GH), 3 = Identify Knowledge Deficiency (IDF), 4 = Generate Solutions (GS)
Data Visualization Techniques
Problem-solving is a sequential activity that consists of multiple phases such as Identify Facts or Generate Hypothesis. The paths students go through during these phases are not always linear. In fact, during a PBL activity, students usually go iteratively or circle among different problem-solving phases [8]. The Sankey graph is a type of graph that symbolizes sequential activities. It can mimic users’ iterative sequential behaviors. More importantly, the graph can also present the strength of each sequential path: the wider the path between two phases, the larger proportion of the sequential activity between two phases among all sequences in the graph. Thus, Sankey graphs were used to visualize the iterative manner of students’ problem-solving efforts.
results & discussion
Theory-informed visualization
Figure 2 was created to represent students’ problem-solving behavioral patterns. For instance, the label 20% on the top of the figure means, among all the paths performed by students, 20% of the sequential actions were from Identify Knowledge Deficiency (IKD) to Identify Facts (IF) phase.
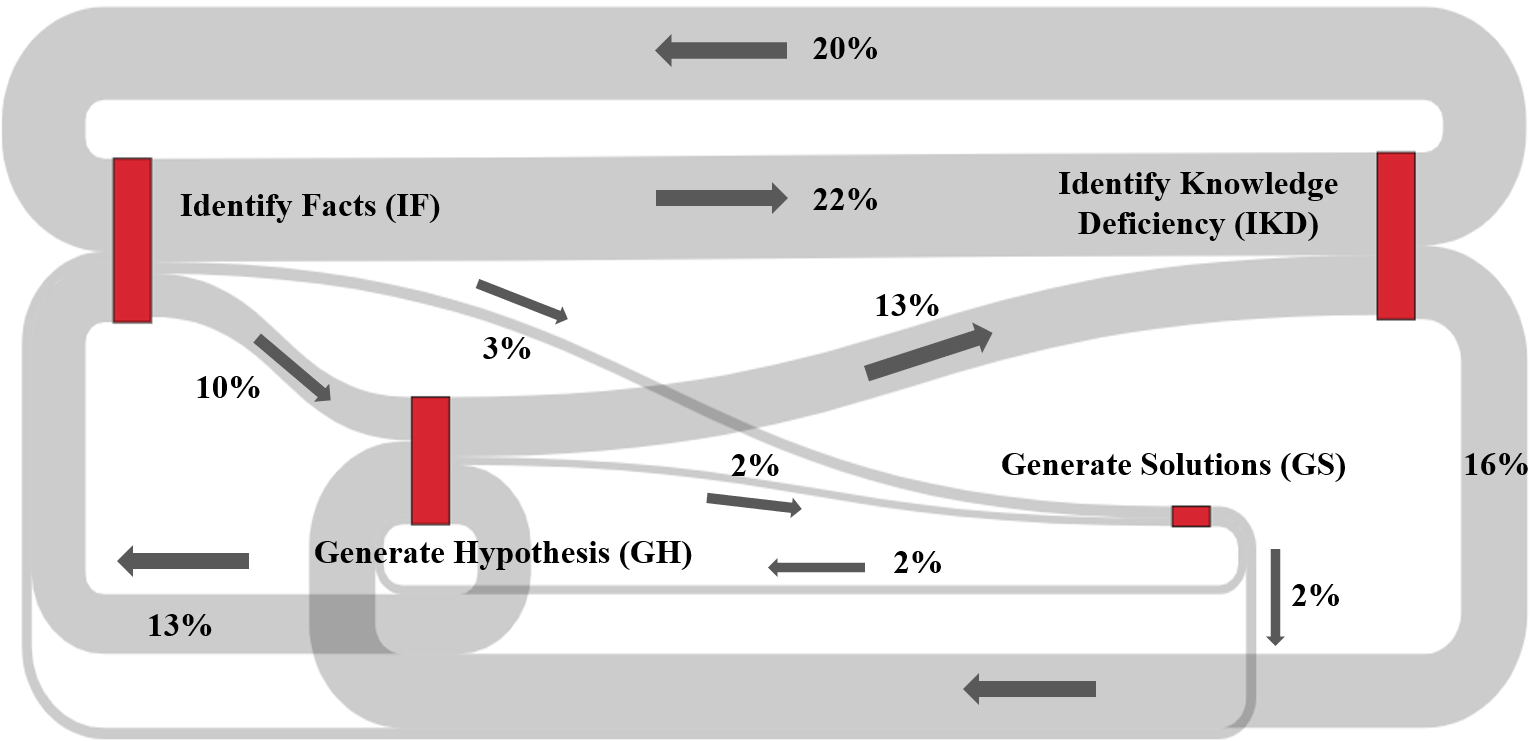
Based on Figure 2, following highlights can be extracted:
- Relatively large proportions of the sequential behaviors were conducted between IKD and IF phases (20%, 22%). It means students were inclined to keep seeking information until they figured out what information was obtained and what was missing, and they would find out the ones they needed.
- The paths involving Generate Solutions (GS) were relatively smaller among all the paths (e.g., IF to GS is 3%; GH to GS is 2%). These outcomes indicate GS is more of an end of problem-solving activity instead of a mean. It is aligned with the PBL environment setting. In the GS phase, students just needed to submit their solutions to a console in the environment, the action itself does not enhance or intervene in their problem-solving progress. In total, students are required to compose six solutions; that’s why the GS phase paths are smaller. To be noted, there were some paths coming out from GS phase; it means students were reconfirming their solutions either by going back to IF (2%) to examine some information, or to GH phase (2%) to refine their hypothesis.
- The paths among IF, GH, and IKD occupy medium proportions compared to the above two findings. For instance, 16% of the actions were from IKD to GH. GH phases involve the actions that students were sending probes to narrow down their hypothesized solutions. Students may or may not have a solution ready after the GH phase, which explains why the proportion of paths from GH to GS is relatively small (2%).
In all, figure 2 presents the problem-solving sequential patterns performed by students during a PBL activity. This graph provided an overview of how students conducted problem-solving in an iterative manner across multiple PBL phases. More importantly, this graph provided a theory-informed representation of the sequential problem-solving patterns generated by a group of middle school 6th-graders in a science PBL activity. Because the paths presented the actions transiting across different PBL phases, this outcome would be informative for other PBL research that is either in a similar or a different educational context.
In fact, to examine the benefits of theory-informed visualizations, Figure 3 was created by the authors for providing a contrast to figure 2. Figure 3 is also a Sankey graph but without aligning the problem-solving actions and the PBL phases. All nodes presented were different tools provided in the PBL environment, and all paths were students’ sequential paths across each tool. For instance, from this figure, we can find out relatively large proportions of sequential actions were performed among Notebook, Solar System Database, and Alien Database. These three tools are all essential features provided in the environment for students to solve the problem. Indeed, it provided a fine-grained visualization of how students transited across different tools in the environment. However, figure 3 could be less interpretable than figure 2 in the following two aspects.
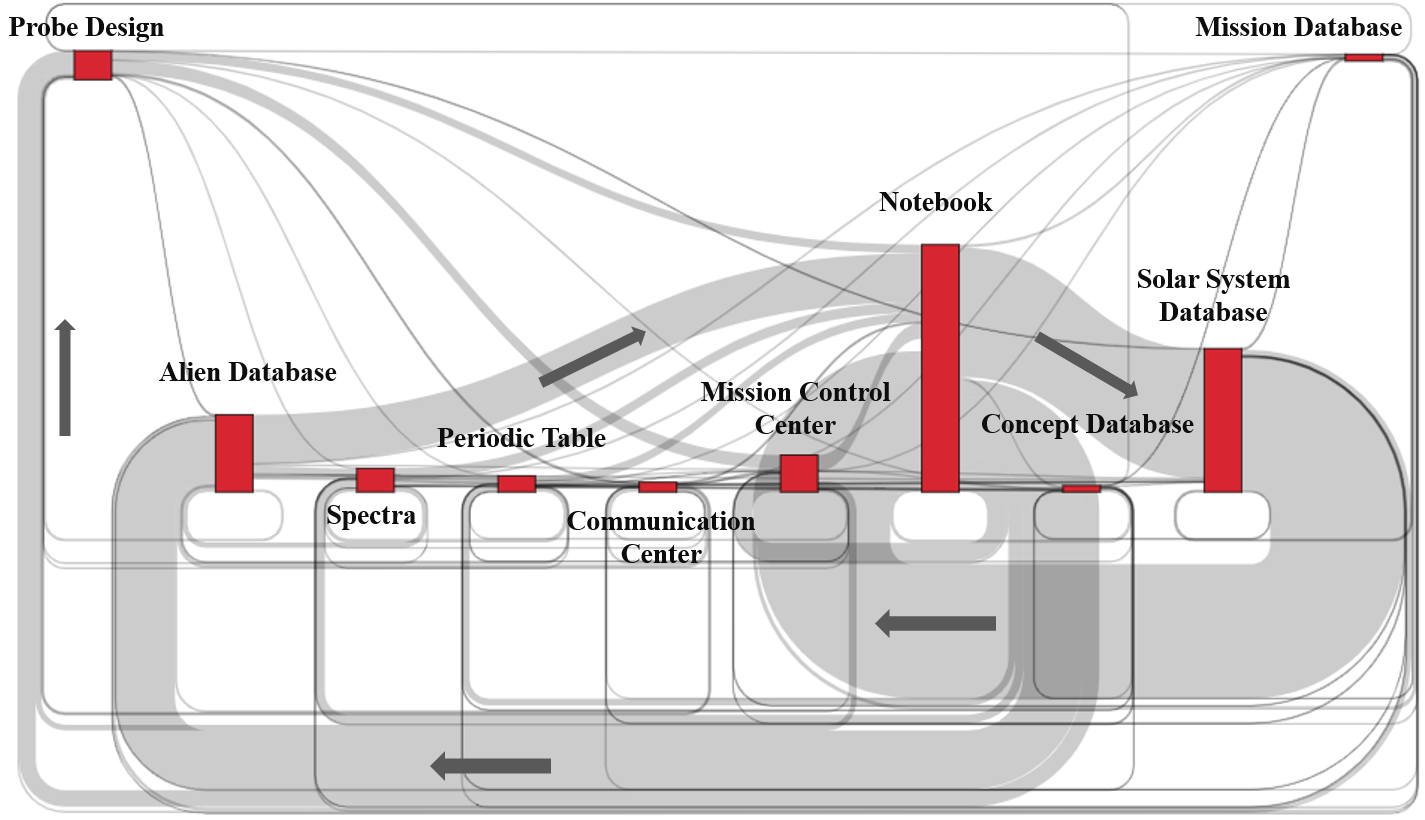
The first aspect is information presentation. In the AR PBL environment, there are a total of 10 different tools. A graph that presents students' problem-solving patterns in such an environment should incorporate all the actions among these ten tools. Compared to figure 2, which only contains four nodes, figure 3 brings a larger amount of information or cognitive load for readers to process [1]. Plus, the presentation of this graph is already congested even without the authors inputting direction and percentage for each path. In fact, many current PBL environments, such as River City [10] or Crystal Island [5], involve more than ten tools or features that students need to access. Even though a fine-grained graph that includes all tools can reveal detailed sequential behaviors and is informative to readers familiar with the environment, it might be challenging for both researchers and readers to interpret those less acquainted.
The second aspect is generalizability. A fine-grained graph like figure 3 can indeed reveal exact sequential action performance by students. For example, after accessing Probe Design, the figure shows students would engage with a series of tools such as Alien Database or Spectra. However, what do these actions mean in terms of problem-solving patterns in general? It may be more informative for developers of this environment than researchers conducting PBL studies in different contexts. Whereas for figure 2, since the Probe Design is aligned with the GH phase (see Table 1), the figure shows 13% of actions afterward were to IDF, and 13% were to IF. These outcomes provide a more explicit picture of how students performed their PBL paths and strategies, since it is aligned with the PBL framework [8]. Other studies that also applied this framework could compare and contrast the outcomes with this study and draw inferences. In addition, researchers or educators who are contemplating conducting PBL studies or activities could pick up the information that depicts students’ problem-solving patterns easily from the theory-informed graphs to apply to their future PBL design or activities.
Uses of the theory-informed visualization
Expect for interpretation, the theory-informed visualizations also present in-depth outcomes for researchers and educators about students’ problem-solving patterns based on conditions. Since participants engaged in the AR PBL environment under virtual or in-person modes, the theory-informed visualizations can also provide a comparison between these two groups.
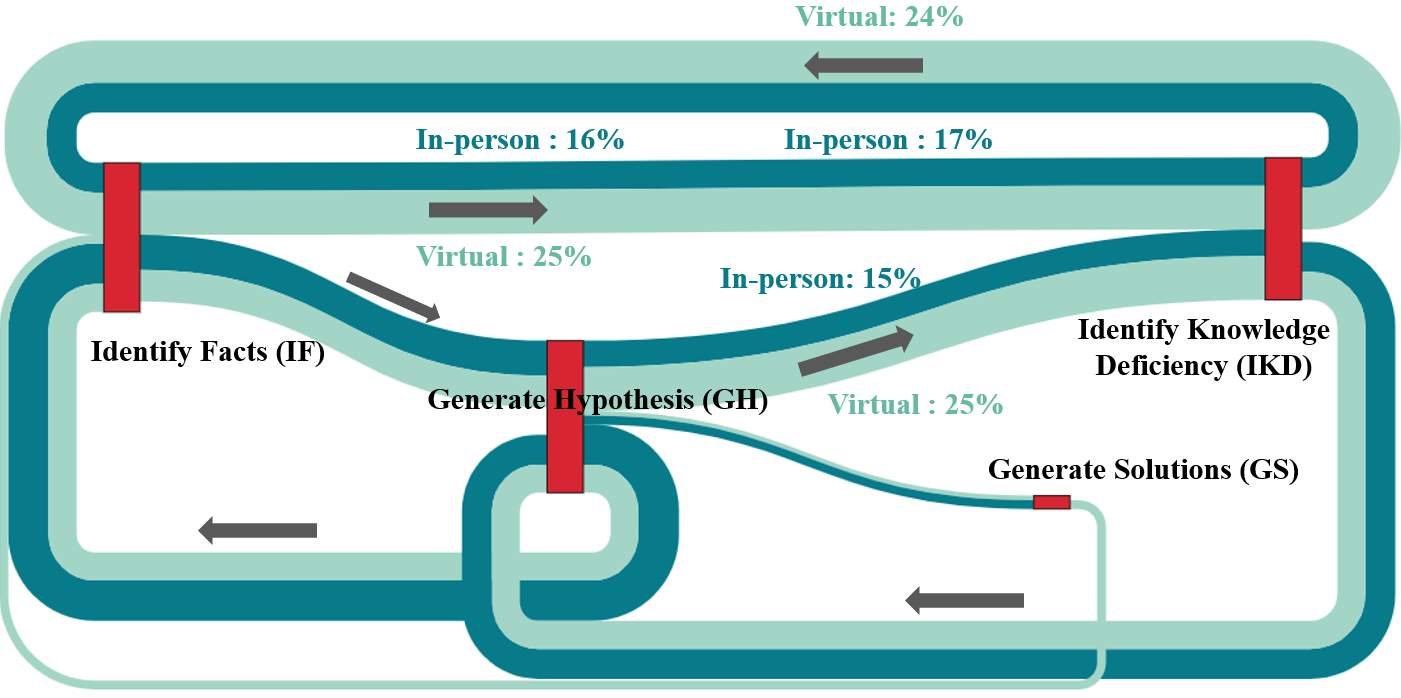
A Sankey graph was made with light blue representing the paths conducted by students in the virtual mode and dark blue representing the paths by students in the in-person mode (see Figure 4). The statistical results showed that students in the virtual mode (M = 106, M = 97) performed significantly more paths from Identify Facts (IF) to Identify Knowledge Deficiency (IKD) phase (U = 901. 00, z = 3.86, p < .01), and from Identify Knowledge Deficiency (IKD) back to Identify Facts (IF) phase (U = 829. 00, z = 4.28, p < .01) than their in-person mode peers (M = 82, M = 72), these statistical outcomes are resonated with the Sankey graph that light blue path is wider than dark blue paths. Moreover, as indicated in Figure 4, students in the virtual mode (M = 8) were more inclined to use the generated hypothesis to assist their knowledge deficiency identification process (U = 879. 50, z = 2.16, p < .05) than students in the in-person mode (M = 12). Based on these results, the students in the virtual mode appeared to be more careful when identifying knowledge deficiency by organizing their collected information on Notebook. They were more likely to collect information from different databases (ID) or draw results from the probes they sent (GH) first, then input the information on Notebook for further uses. In fact, carefully identifying sufficient information from different databases and collecting returned data from probes are expected problem-solving sequential paths that would provide students with better solution outcomes [8].
IIn addition, the graph also showed that students in the in-person mode did not perform the paths from Generate Solutions (GS) to Identify Facts (IF), the dark blue path is missed between these two phases. To conceptualize and finalize robust solutions, it would be helpful for students to check with different databases to ensure the correct information supported the solution. Therefore, the above outcomes indicate that students in the virtual mode would perform the problem-solving actions close to the expected path, leading to better problem-solving outcomes. These results presented that students under different learning modes performed distinctive problem-solving strategies. It indicates that when teachers facilitate PBL activities, different scaffoldings instructions should be provided based on students’ learning mode. For example, teachers can encourage in-person students to identify what information they still need before generating hypothesis, or remind them to examine the facts before submitting their final solutions.
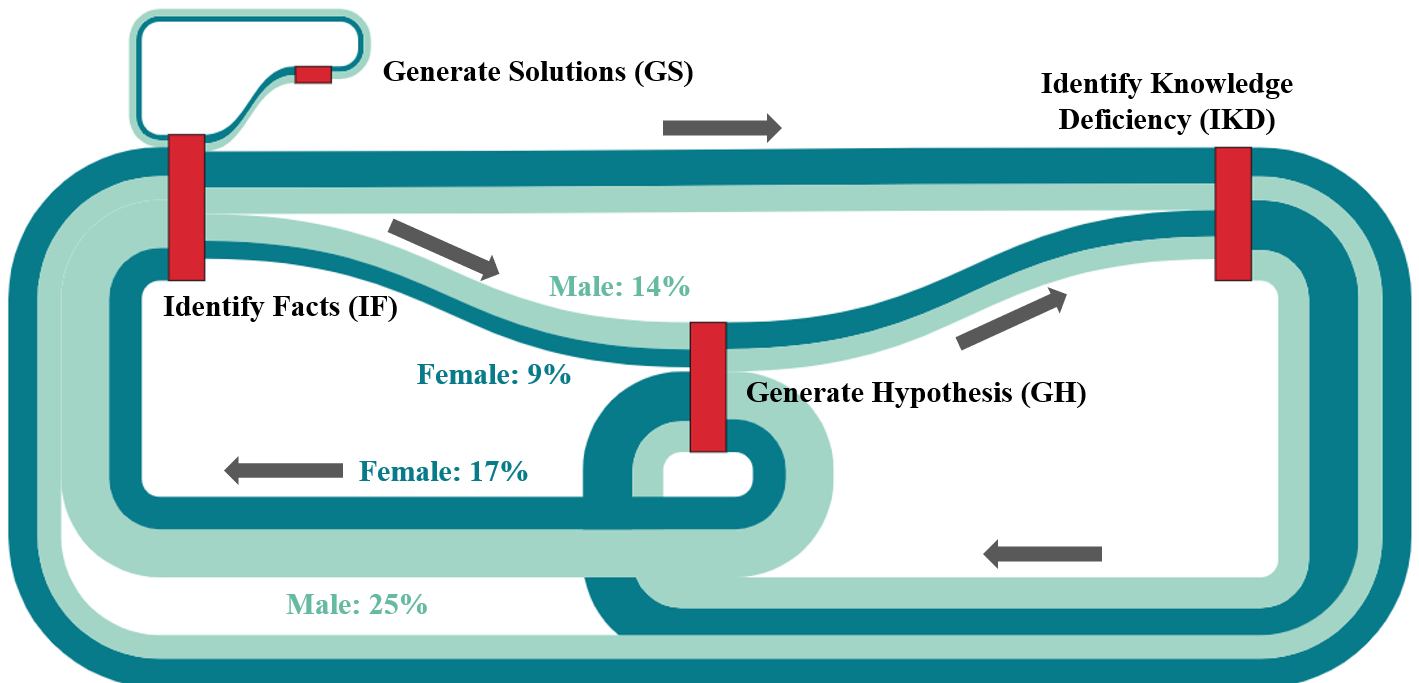
In addition, the gender variable can also be incorporated by the theory-informed visualization. Figure 5 was made to visualize the different problem-solving sequential patterns between genders. The light blue color represents the paths conducted by male students, and the dark blue color represents female students. It is noticeable that from Identify Facts (IF) to Generate Hypothesis (GH) phase, the light blue path is wider than the dark blue path. A similar pattern could be observed from Generate Hypothesis (GH) back to Identify Facts (IF) phase as well. Statistical results showed that under condition A, male students (M = 13, M = 17) performed significantly more paths from Identify Facts to Generate Hypothesis (GH) phase (U = 1027. 00, z = 3.14, p < .01), and from Generate Hypothesis back to Identify Facts (IF) phase (U = 1137. 00, z = 2.50, p < .05) than their female peers (M = 8, M = 12). These results indicate that male students dedicated more efforts to generating hypotheses directly after collecting information from different databases (see Table 1), and these actions were presented in a repeated manner. On the other hand, female students might be more cautious when generating hypotheses, as indicated on the graph, female students (dark blue) were more likely to generate hypotheses after identifying knowledge deficiency than male students (light blue). Although this path is not significantly different by gender, it still reveals nuanced sequential differences between genders. Therefore, teachers can provide scaffoldings to different students based on gender accordingly. For instance, teachers can remind male students not to make prompt hypotheses right after identifying facts from databases. But instead, they can check what information is missing and what they already have to draw better hypotheses.
Conclusion
In conclusion, this study's findings revealed that theory-informed visualizations could provide more interpretable outcomes when examining students' sequential activities during problem-solving activities. The overall presentation of the visualization would be more explicit and generalizable to other relevant studies.
Moreover, the theory-informed visualizations can also demonstrate students' patterns based on different conditions such as learning modes or genders. These nuanced outcomes can inform teachers' differentiated scaffoldings when facilitating PBL activities.
REFERENCES
- Alhadad, S.S.J. 2018. Visualizing Data to Support Judgement, Inference, and Decision Making in Learning Analytics: Insights from Cognitive Psychology and Visualization Science. Journal of Learning Analytics. 5, 2 (Aug. 2018), 60-85. DOI:https://doi.org/10.18608/jla.2018.52.5.
- de Barba, P.G., Kennedy, G.E. and Ainley, M.D. 2016. The role of students’ motivation and participation in predicting performance in a MOOC: Motivation and participation in MOOCs. Journal of Computer Assisted Learning. 32, 3 (Jun. 2016), 218–231. DOI:https://doi.org/10.1111/jcal.12130.
- Belland, B.R. 2017. Instructional Scaffolding in STEM Education. Springer International Publishing.
- Ceccon Ribeiro, P., Biles, M.L., Lang, C., Silva, C. and Plass, J.L. 2018. Visualizing log-file data from a game using timed word trees. Information Visualization. 17, 3 (Jul. 2018), 183–195. DOI:https://doi.org/10.1177/1473871617720810.
- Cloude, E.B., Dever, D.A., Wiedbusch, M.D. and Azevedo, R. 2020. Quantifying Scientific Thinking Using Multichannel Data With Crystal Island: Implications for Individualized Game-Learning Analytics. Frontiers in Education. 5, (Nov. 2020), 572546. DOI:https://doi.org/10.3389/feduc.2020.572546.
- English, M.C. and Kitsantas, A. 2013. Supporting Student Self-Regulated Learning in Problem- and Project-Based Learning. Interdisciplinary Journal of Problem-Based Learning. 7, 2 (Sep. 2013), 128-150. DOI:https://doi.org/10.7771/1541-5015.1339.
- Fincham, E., Whitelock-Wainwright, A., Kovanović, V., Joksimović, S., van Staalduinen, J.-P. and Gašević, D. 2019. Counting Clicks is Not Enough: Validating a Theorized Model of Engagement in Learning Analytics. Proceedings of the 9th International Conference on Learning Analytics & Knowledge (Tempe AZ USA, Mar. 2019), 501–510.
- Hmelo-Silver, C.E. 2004. Problem-Based Learning: What and How Do Students Learn? Educational Psychology Review. 16, 3 (Sep. 2004), 235–266. DOI:https://doi.org/10.1023/B:EDPR.0000034022.16470.f3.
- Hung, W. 2011. Theory to reality: a few issues in implementing problem-based learning. Educational Technology Research and Development. 59, 4 (Aug. 2011), 529–552. DOI:https://doi.org/10.1007/s11423-011-9198-1.
- Ketelhut, D.J., Clarke, J. and Nelson, B.C. 2010. The Development of River City, a Multi-User Virtual Environment-Based Scientific Inquiry Curriculum: Historical and Design Evolutions. Designs for Learning Environments of the Future. M.J. Jacobson and P. Reimann, eds. Springer US. 89–110.
- Liu, M., Kang, J., Zilong, P., Zou, W. and Lee, H. 2017. Exploring Data Visualization as an Emerging Analytic Technique. Proceedings of E-Learn: World Conference on E-Learning in Corporate, Government, Healthcare, and Higher Education 2017 (Vancouver, British Columbia, Canada, Oct. 2017), 1681–1690.
- Liu, M., Li, C., Pan, Z. and Pan, X. 2019. Mining big data to help make informed decisions for designing effective digital educational games. Interactive Learning Environments. 27 (Jul. 2019), 1–21. DOI:https://doi.org/10.1080/10494820.2019.1639061.
- Liu, M., Shi, Y., Pan, Z., Li, C., Pan, X. and Lopez, F. 2021. Examining middle school teachers’ implementation of a technology-enriched problem-based learning program: Motivational factors, challenges, and strategies. Journal of Research on Technology in Education. 53, 3 (Jul. 2021), 279–295. DOI:https://doi.org/10.1080/15391523.2020.1768183.
- Liu, S. and Liu, M. 2020. The impact of learner metacognition and goal orientation on problem-solving in a serious game environment. Computers in Human Behavior. 102, (Jan. 2020), 151–165. DOI:https://doi.org/10.1016/j.chb.2019.08.021.
- Schumacher, C. and Ifenthaler, D. 2018. The importance of students’ motivational dispositions for designing learning analytics. Journal of Computing in Higher Education. 30, 3 (Dec. 2018), 599–619. DOI:https://doi.org/10.1007/s12528-018-9188-y.
- Vieira, C., Parsons, P. and Byrd, V. 2018. Visual learning analytics of educational data: A systematic literature review and research agenda. Computers & Education. 122, (Jul. 2018), 119–135. DOI:https://doi.org/10.1016/j.compedu.2018.03.018.
- Wijnia, L., Loyens, S.M.M., van Gog, T., Derous, E. and Schmidt, H.G. 2014. Is there a role for direct instruction in problem-based learning? Comparing student-constructed versus integrated model answers. Learning and Instruction. 34, (Dec. 2014), 22–31. DOI:https://doi.org/10.1016/j.learninstruc.2014.07.006.
- Winne, P.H. 2020. Construct and consequential validity for learning analytics based on trace data. Computers in Human Behavior. 112, (Nov. 2020), 106457. DOI:https://doi.org/10.1016/j.chb.2020.106457.
© 2022 Copyright is held by the author(s). This work is distributed under the Creative Commons Attribution-NonCommercial-NoDerivatives 4.0 International (CC BY-NC-ND 4.0) license.