ABSTRACT
We propose a distance measure between instructor-recommended and learners’ learning pathways and discuss how it may be used. The context of this study is a 15-week undergraduate course. The digital learning activities consisted in reading materials, interactive videos, quizzes and worksheets. They allowed the collection of many time-stamped digital traces. The course instructor recommended to engage in the activities regularly and prior to attending weekly synchronous tutorials. However, learning was largely self-regulated. This led to different learning strategies, which were captured and visualised in the form of learning pathways. Several patterns emerged: “regular learners” followed the recommendations; “irregular/selective learners” tended to engage in some activities only and irrespectively of the timing of the tutorials; and “late learners” waited until the end of the course to start engaging. We have formulated a distance measure (D) between the students’ and the instructor-recommended learning pathways and found D to be a good indicator of a learner’s time management and self-regulation skills. D was also found to have a moderate negative correlation (r = -0.6087) with exam marks, implying that the visualisation of learning pathways combined with a distance measure could be useful to raise students’ awareness of their lack of self-regulation skills.
Keywords
INTRODUCTION
In Self-Directed Learning (SDL), the responsibility to learn shifts from an external source (typically a teacher) to the individual learner. In its broadest meaning, SDL describes a process by which individuals take the initiative in identifying their learning needs, formulating goals, identifying resources for learning, choosing and implementing appropriate strategies, and evaluating learning outcomes [15]. Many consider self-direction to be a fundamental difference between children and adults in a learning situation; and many argue that higher education is where and when learners should be given the tools to become independent self-directed learners, and educators should move away from an authoritative position to take a role of facilitator of learning.
The goal of SDL is not necessarily to become a fully autonomous learner. In a formal learning situation such as a university course, it should be seen as a collaborative process between the instructor and the learner [11]. SDL is multidimensional and can be perceived through the notions of control [7] and personal responsibility [6] along a continuous scale. When the learning tasks are generated by the instructor, it may be more appropriate to talk about self-regulation [24], a notion that is close to self-direction and encompassed by it [16][18]. Self-Regulated Learning (SRL) strategies include rehearsal, elaboration, organisation, critical thinking, time management, effort regulation, peer learning and seeking help [4].
The design of learning materials and activities in a Learning Management System (LMS) can affect learners’ self-regulation strategies [12]. There is convincing evidence that people who are given some initiative in their learning learn more and learn better than people who are passively being taught [10][14]. In online learning settings characterised with autonomy, such as Massively Open Online Courses (MOOCs), self-regulation becomes a critical factor for success [1][2][8]. When comparing online and blended learner’s SRL strategies, Broadbent [5] has found that they differed in their use, but that overall predictors of grade were equivalent: time management, elaboration and rehearsal strategies were found to be key predictors. There seems to be general agreement among researchers that effective time management especially is an essential element of SRL [22].
Time management can be short-range and focus on the day-to-day planning and organisation of time or be long-range and used to regulate effort [3][17]. Studies exploring the academic procrastination (i.e., the intentional delay of an intended course of action) of undergraduate students have highlighted the relationships between procrastination tendencies and poor self-efficacy for self-regulation and low academic achievements, e.g., [19] [13]. In [9], procrastination is described as “self-regulation failure of performance”. Negative relationships between procrastination, self-control and self-esteem [21], as well as health, wealth and happiness [23] have also been demonstrated.
Poor SRL and time management (such as procrastination) typically result in a learning pathway that is significantly different from the optimal or instructor-recommended pathway [20], where a learning pathway is defined as the route taken by a learner through a range of learning activities, which allows them to build knowledge progressively. In this paper, we present a study to understand if students’ chosen learning pathways can be indicators of poor SRL skills and be predictors of course performance when they differ significantly from the instructor-recommended pathway. With this objective in mind, we have formulated a distance measure (D) between the students-generated and the instructor-recommended learning pathways.
method
Participants and Context
The context of the study is a 15-week course on Multimedia Fundamentals, delivered online during the Autumn 2021 to a rather large class of 234 3rd year undergraduate students on a Telecommunication Engineering programme. The learning objectives for this course are: (1) to be able to discuss and compare multimedia data representations; (2) to relate data properties, representation, and size; (3) to apply digital signal processing techniques for the compression of multimedia data; and (4) to describe modern multimedia standards and formats. It covers the following nine topics: digitisation, colour models, image, sound and video representations, lossless compression techniques, JPEG, MPEG, perceptual encoding (MP3), and digital broadcasting.
The students were all Chinese nationals, between 20- and 21-year-old, enrolled on a 4-year UK-China transnational programme delivered in China. About 40% of the students are female. For the duration of the course, the students were physically on campus in Beijing, while the instructor was in another country.
The digital learning activities made available on the LMS consisted in reading materials, short interactive videos (H5P technology), quizzes and exercise worksheets. In each interactive video, various exercises were embedded, which encouraged active learning and served as formative assessment: multiple choice questions, drag and drop exercises, fill in the blank exercises, select the right words exercises, etc. For each topic, further formative assessment was provided in the form of a 5-question quiz. The questions were randomly taken from a question bank, and each attempt could retrieve a different set of questions from the bank. Students were encouraged to attempt the quizzes several times to be exposed to a greater variety of questions. In addition, exercise worksheets could be downloaded, completed, and submitted again to the LMS. These worksheets could not be automatically marked, so no marks were allocated to them, but marks gained from the video embedded exercises and the quizzes were visible to the students and used for formative assessment only. At the end of the course, students would get 2 marks for completing at least 66% of the online learning activities (which included accessing the reading materials, interacting with the videos, answering the quizzes and uploading the completed worksheets), 1 mark for completing between 33% and 65% of these activities, and 0 mark if 32% or less had been completed. A total of 65 digital learning activities were proposed for which time-stamped digital traces could be collected, as summarised in Table 1.
In addition, weekly online synchronous tutorials were scheduled to answer students’ questions, give live demonstrations, explain some of the topics in more detail, and discuss the quiz questions and worksheet exercises. Each week, an open-ended question was posted in a discussion forum for students to debate between themselves. Two mandatory labs were also scheduled, in week 4 and 10 respectively, for which reports had to be submitted as part of the summative assessment. In the first lab, students used Matlab to create audio spectrograms and observe various sound signals; in the second lab, they programmed a simple JPEG encoder and decoder. By the end of the course, the summative assessment was made of 80% final closed-book examination; 13% lab reports; 5% in-class test (a 20-question quiz generated from the same question bank as the weekly quizzes); and 2% for completion of the online activities.
The learning activities (reading material, interactive videos, quiz and worksheet) were released on a weekly basis, the week before the corresponding tutorial. For example, the introduction material was released in week 0 and covered in the week 1 tutorial; the digitisation topic activities were released in week 1 and covered in the week 2 tutorial, etc. An activity released on the LMS would then remain available until the end of the course and could be attempted as many times as desired, including during the revision period (weeks 12 to 14) and until the final examination, scheduled in week 15.
The lecturer recommended to engage in learning activities weekly, prior to attending the tutorials. However, the learning was mostly self-regulated as students could choose when to engage in the learning activities, or even not to engage at all. Two hours a week was the recommended time to engage in the learning activities, and time and space were scheduled in the students’ timetable for self-studying, but attendance at these sessions was not mandatory nor recorded. Most students chose to engage at different times and in their private space. The responsibility given to the students for their learning led to various strategies, which, thanks to the digital traces could be captured in the form of various learning pathways.
Topic (week) | Reading | Videos | Quiz | Worksheet | TOTAL |
|---|---|---|---|---|---|
Introduction (w1) | 2 | 0 | 0 | 0 | 2 |
Digitisation (w2) | 1 | 3 | 1 | 1 | 6 |
Colour (w3) | 1 | 4 | 1 | 1 | 7 |
Images (w4) | 1 | 3 | 1 | 1 | 6 |
Video/Sound (w5) | 1 | 5 | 1 | 1 | 8 |
Compression (w7) | 0 | 4 | 1 | 1 | 6 |
JPEG (w8) | 1 | 5 | 1 | 1 | 8 |
MPEG (w9) | 1 | 6 | 1 | 1 | 9 |
MP3 (w10) | 1 | 7 | 1 | 1 | 10 |
Broadcasting (w11) | 1 | 0 | 1 | 1 | 3 |
TOTAL | 10 | 37 | 9 | 9 | 65 |
Data Collection and Analysis
Each week and for each student the following data were collected: (1) date of latest engagement or attempt in each available learning activity on the LMS; and (2) updated video and quiz marks (students could improve their marks by re-engaging in the activities). The data were then anonymised: students names and email addresses were removed from the records, only student enrollment numbers were preserved to be able to track a student’s activity across the duration of the course.
Data collection was constrained by the fact that, at any point in time, only one time-stamped digital trace would remain on the LMS for each activity: a new attempt at the same activity would overwrite the previous trace. It was thus important to carefully plan the timing of the data collection and to collect data repeatedly and regularly. We collected data the day before each weekly tutorial, when the material related to that tutorial had already been available on the LMS for a week. That way, we could capture whether a student had engaged in the learning activities before (as recommended) or after the corresponding tutorial. Data were collected weekly until the date of the final examination in week 15.
results
Learning Pathways
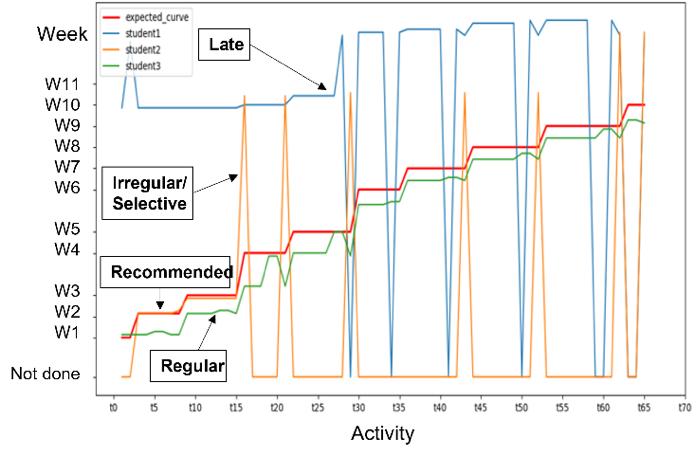
Figure 1 shows several examples of learning pathways. On the horizontal axis, the 65 learning activities are plotted in chronological order. The vertical axis shows all the teaching weeks of the semester. The gaps between weeks 3 and 4 and between weeks 5 and 6 correspond to weeks with no scheduled tutorial. The graphs indicate when a learning activity has been completed for the first time. The recommended pathway represents the lecturer’s intent, where each learning activity has been completed by the time of the corresponding tutorial.
Several patterns emerged as illustrated in the examples of Figure 1. Regular learners are students who followed the lecturer’s recommendations. Their pathway is typically just below the recommended pathway, showing that they have engaged in the learning activities within the week preceding the tutorial. Irregular or selective learners tended to choose the type of activities they engaged in (e.g., some students used only the videos, others only the quizzes) and often did this irregularly and irrespectively of the timing of the tutorials. Finally, the late learners are students who seldom engaged during the semester and typically used the learning activities at the end of the course to prepare for the final examination (i.e., combining massing and procrastination).
Distance Measure
We have formulated a distance measure (D) between a student’s and the lecturer-recommended learning pathways. It is calculated by adding together all the differences (in number of days) between when an activity was due and when it has been completed for the first time (see equation below). When an activity has not been completed, the maximum distance between the expected day and the end of the course (date of the examination in week 15), plus one day, is added to the sum. The sum is then normalised, dividing it by the maximum distance value (corresponding to a student who has not completed any of the activities) and multiplying by 100. D ranges from 2.38 (minimum distance found) to 96.9 (maximum distance found). The mean value of D is 31.61 (std = 25.95). Using K-means clustering (k = 3), the pathways were then grouped into three clusters.
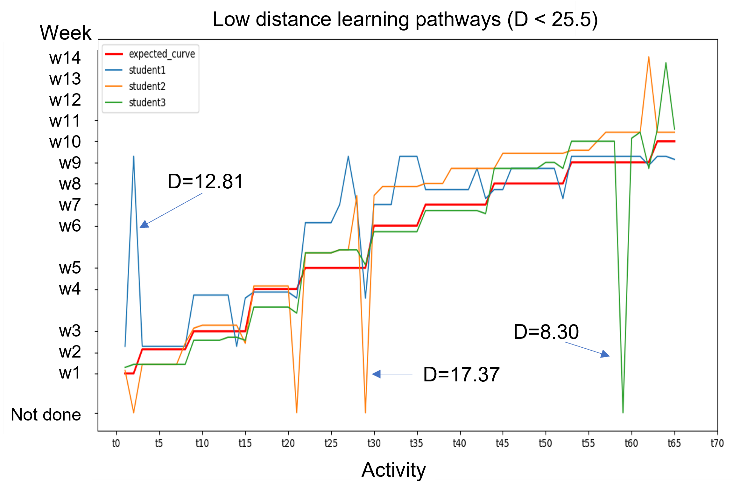
The first (low distance) cluster contains 47 pathways (20% of the students). These students can be classified as regular learners (see Figure 2). The maximum value of D in this cluster is 25.5, which can be used as a threshold value to “qualify” as a regular learner. All the pathway examples of Figure 2 follow the recommended pathway fairly closely, but each present a few “glitches”. The pathway with distance D = 8.30 shows that one of the latest activities has been missed, while another activity has been a bit delayed: until week 11 (final topic of the course) this student had been a very regular learner. The pathway with distance D = 12.81 shows that one of the early activities has been completed with a significant delay, while a few other activities were slightly delayed. It is possible that this student joined the course a bit late, did not understand what was demanded of them at first, or that it took them a bit of time to adopt the correct strategy (some “catch up” seems to have been done around week 9). The pathway with distance D = 17.37 is characterised by three undone activities, and one significantly delayed activity. The distance measure in this cluster seems to be a good indicator of the number and gravity of the “glitches”.
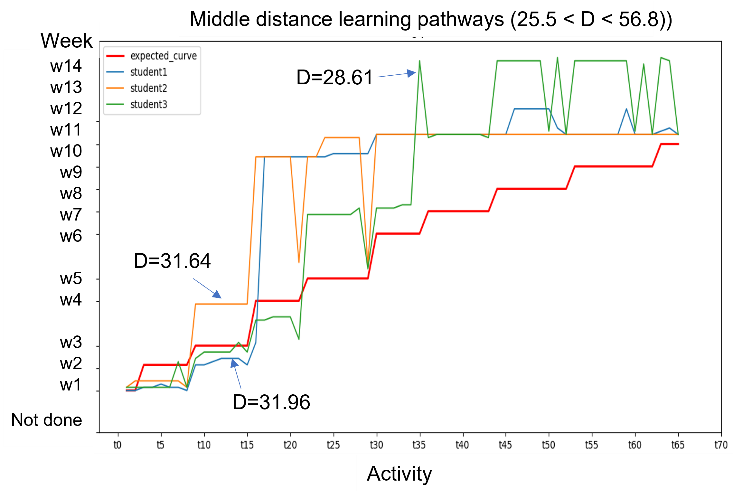
The second (middle distance) and largest cluster contains 128 pathways (55% of the students). The value of D in this cluster ranges between 25.5 and 56.8 (see examples in Figure 3). The examples of Figure 3 show that the students started as regular learners, but they shifted to selective or late learner profiles after some time (around week 5). Although the three values of D are close (28.61, 31.64 and 31.96 respectively), the pathways look quite different. The distance measure does not allow us to precisely discriminate between the selective and the late learners, so more work is needed in this respect. However, a student in this cluster may be described as an “irregular learner”.
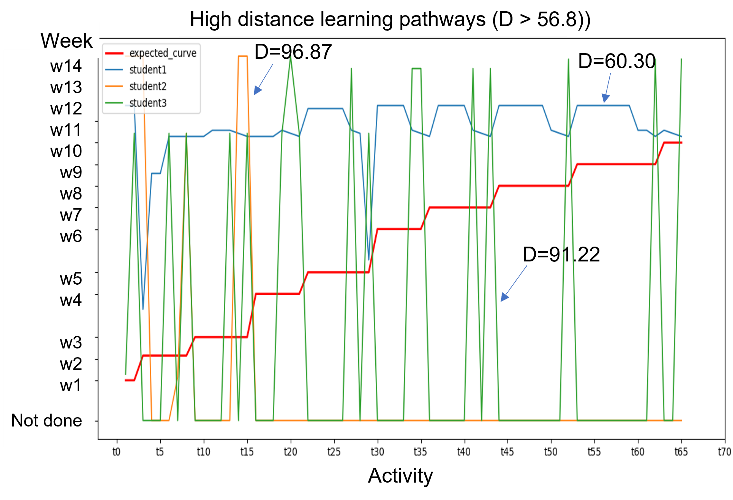
Finally, the third (high distance) cluster contains 59 pathways (25% of the students) (see Figure 4). In this cluster, the students adopted either a selective or a late learning strategy from the start of the course. Some of these students concentrated on one type of activity only, others did all the activities, but very late in the semester, i.e., when they started revising for the final examination. The pathway with distance D = 60.30 is characteristic of a late learner: all the activities have been completed but were all seriously delayed. The pathway with the highest distance (D = 96.87) is characteristic of a learner who almost never engaged in any of the activities. The pathway with a slightly lower distance (D = 91.22) shows a learner who is both selective and late. A high distance measure seems to be a good indicator of poor time management and lack of engagement.
Finally, we found D to have a moderate but significant negative correlation (r = -0.6087) with the students’ final examination marks.
discussion
The negative correlation (r = -0.6087) between exam performance and the distance to the recommended learning pathway confirms that regular learning is conducive to deeper learning. There could be several reasons for this: (1) having studied the learning material before attending a tutorial allows students to make the best of the time they have with the lecturer as they can prepare questions and better understand the additional content provided in the tutorial; (2) students have more time to assimilate and reflect on their learning before sitting the final examination; (3) it shows better time management skills, which are likely to have been effective also when preparing for the final examination.
As future work, we plan to test if, at the level of each student, the visualisation of their learning pathway combined with the distance measure D, may effectively raise their awareness of their lack of time management and self-regulation skills. Another possible application may be to use this information to nudge students who do not follow the recommended pathway and provide them with regular, timely, and personalised feedback.
At course level, a dashboard providing weekly information about the mean distance between the students’ pathways and the recommended pathway, could be useful to alert the instructor about a worrying students’ disengagement trend. A constantly high distance value could be indicative of a flaw in the course design, for example with respect to the amount of effort required from the students. A sudden increase of the distance measure could be indicative of a particularly challenging topic which causes disengagement from the students. It could also indicate that the students have a busy schedule forcing them to make undesirable choices concerning their time and effort allocations.
Our study suffers from several limitations. First, the data was collected on a weekly basis, where daily collection would have provided more accurate time stamps. This is easy to correct, and more data will be collected for the future cohorts of students. Second, in its current formulation, the distance measure does not allow us to precisely discriminate between the different learner profiles (selective, late, irregular, etc.). One possibility, which is under investigation, would be to use different weightings for different types of activity and to vary the weightings as the semester advances. Another possibility would be to formulate different distance measures, each measure being designed to capture a particular learner profile. Better discrimination between the different types of learners will enable the formulation of more accurate and pertinent nudging.
We have a lot of data that we have not yet exploited. Future work includes calculating correlations between different types of activity (completion and scores) and course performance. We have also started to work on the design of different dashboards for students and for instructors.
REFERENCES
- Ally, M. 2004. Foundations of educational theory for online learning. In The theory and practice of online learning, ed. T. Anderson, 15–44. Edmonton, CA: Athabasca University Press.
- Barnard, L., Lan, W.Y., To, Y.M., Paton, V.O. and Lai, S.L. 2009. Measuring self-regulation in online and blended learning environments. The Internet and Higher Education, 12, 1-6.
- Britton, B. K. and Tesser, A. 1991. Effects of time management and practices on college grades. Journal of Educational Psychology, 83, 405–410.
- Broadbent, J., and Poon, W. L. 2015. Self-regulated learning strategies & academic achievement in online higher education learning environments: A systematic review. The Internet and Higher Education, 27, 1-13. http://dx.doi.org/10.1016/j.iheduc.2015.04.007
- Broadbent, J. 2017. Comparing online and blended learner's self-regulated learning strategies and academic performance. The Internet and Higher Education, 33, 24-32.
- Brockett, R. G. and Hiemstra, R. 1991. Self-direction in Adult Learning: Perspectives on theory, Research, and Practice, Routledge, New York, NY, USA.
- Candy, P. C. 1991. Self-direction for Lifelong Learning: A Comprehensive Guide to theory and Practice, Jossey-Bass, San Francisco, CA, USA.
- Crosslin, M. 2018. Exploring self-regulated learning choices in a customisable learning pathway MOOC. Australasian Journal of Educational Technology, Vol. 34 No. 1, 131-144. https://doi.org/10.14742/ajet.375.
- Ferrari, J. R. 2001. Procrastination as self-regulation failure of performance: effects of cognitive load, self-awareness, and time limits on ‘working best under pressure’. European journal of Personality, 15(5), 391-406.
- Garrison, D. R. 1992. Critical thinking and self-directed learning in adult education: an analysis of responsibility and control issues, Adult Education Quarterly, vol. 42, no. 3, pp. 136–148.
- Garrison, D. R. 1997. Self-directed learning: toward a comprehensive model, Adult Education Quarterly, vol. 48, no. 1, pp. 18–33.
- Gleadow, R., Macfarlan, B., & Honeydew, M. (2015). Design for learning - a case study of blended learning in a science unit. F1000Research, 4:898, 1-17.
- Klassen, R. M., Krawchuk, L. L., and Rajani, S. 2008. Academic procrastination of undergraduates: Low self-efficacy to self-regulate predicts higher levels of procrastination. Contemporary Educational Psychology, 33(4), 915-931.
- Knowles, M. S. 1975. Self-directed Learning: A Guide for Learners and Teachers, Association Press, New York, NY, USA.
- Loeng, S. 2020. Self-Directed Learning: A Core Concept in Adult Education, Education Research International, vol. 2020, 1-12. https://doi.org/10.1155/2020/3816132
- Loyens, S. M. M., Magda, J. and Rikers, S. M. M. 2008. Self-directed learning in problem-based learning and its relationships with self-regulated learning, Educational Psychology Review, vol. 20, no. 4, pp. 411–427.
- Macan, T., Shahani, C., Dipboye, R. L., & Phillips, A. P. 1990. College students' time management: Correlations with academic performance and stress. Journal of Educational Psychology, 82, 760–768.
- Pintrich, P. R. 1999. The role of motivation in promoting and sustaining self-regulated learning. International Journal of Educational Research, 31, 459-470.
- Senécal, C., Koestner, R. & Vallerand, R.J. 1995. Self-Regulation and Academic Procrastination. The Journal of Social Psychology, 135:5, 607-619.
- Tam, V., Lam, E.Y. & Fung, S.T. 2014. A new framework of concept clustering and learning path optimization to develop the next-generation e-learning systems. J. Comput. Educ. 1, 335–352.
- Uzun, B., LeBlanc, S., & Ferrari, J. R. 2020. Relationship between academic procrastination and self-control: the mediational role of self-esteem. College Student Journal, 54(3), 309-316.
- Wolters, C.A., Won, S. & Hussain, M. 2017. Examining the relations of time management and procrastination within a model of self-regulated learning. Metacognition Learning 12, 381–399.
- Zacks, S. & Hen, M. 2018. Academic interventions for academic procrastination: A review of the literature, Journal of Prevention & Intervention in the Community, 46:2, 117-130.
- Zimmerman, B. J., & Schunk, D. H. (Eds.). 2001. Self-regulated learning and academic achievement: Theoretical perspectives. Routledge.336 pages. ISBN 9780805835618
© 2022 Copyright is held by the author(s). This work is distributed under the Creative Commons Attribution-NonCommercial-NoDerivatives 4.0 International (CC BY-NC-ND 4.0) license.