ABSTRACT
This paper proposes to discover which data fusion approach and classification algorithm produced the best results from smart classrooms data, and how useful would be the prediction models for detecting University students at risk of failing or dropout. The results showed that the best predictions were produced using ensembles and selecting the best attributes approach with discretized data; the REPTree algorithm demonstrated the highest prediction values. The best predictions also show the teacher what set of attributes and values are the most important for predicting student performance, such as the level of attention in theory classes, scores in Moodle quizzes and the level of activity in Moodle forums.
Keywords
INTRODUCTION
Nowadays, new learning models are used in Higher Education such as Blended learning, Smart Learning and Multimodal learning. Blended learning (b-learning) is an approach to learning and instruction that combines online educational materials and opportunities for interaction online with traditional place-based classroom methods, although the terms "blended learning", "hybrid learning", "technology-mediated instruction", "web-enhanced instruction", and "mixed-mode instruction" are often used interchangeably in research literature [5][6]. Its rise is due to the fact that there are some disadvantages to current e-learning environments such as inhibiting socialization resulting in a lack of face-to-face communication [7]. Otherwise, EDM has been widely used to improve and enhance learning quality, as well as in the pursuit of pure research objectives, which tend to improve our understanding of the learning process [8]. In this context, it is still a challenge to predict student learning achievement in blended learning environments combining online and offline learning [1, 6], making data fusion techniques necessary.
Smart learning environments (SLEs) have been recently defined [9] as learning ecologies wherein students perform learning tasks and/or teachers define them with the support provided by tools and technology. SLEs can encompass physical or virtual spaces in which a system senses the learning context and process by collecting data, analyzes the data, and consequently reacts with customized interventions that aim at improving learning [9].
In Multimodal Learning Analytics (MLA), learning traces are extracted not only from log-files but also from digital documents, recorded video and audio, pen strokes, position tracking devices, biosensors, and any other data source that could be useful for understanding or measuring the learning process. One important question in MLA is how to combine, or fuse, the data extracted from different modalities in order to provide a more comprehensive view of learners’ outer and inner processes [1].
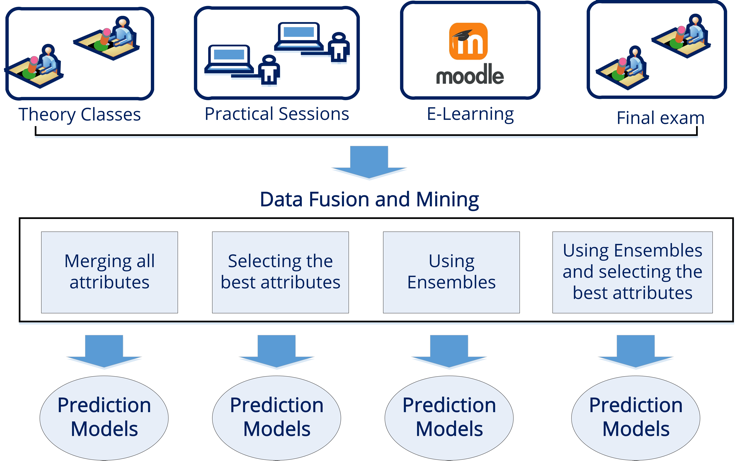
In this study we propose applying different data fusion approaches and classification algorithms to data gathered from several sources (theory classes, practical sessions, online sessions, and final exams) in a blended, smart, multimodal course in order to predict the students’ final academic performance [11]. Data fusion, or information fusion, is the study of efficient methods for automatically or semi-automatically transforming information from different sources and different timepoints into a representation that provides effective support for human or automated decision making. Specifically, data fusion can reduce the size and dimensions of data, optimize the amount of data and extract useful information [10]. There are different types of multimodal fusion approaches such as: feature-level or early fusion, decision-level or later fusion and Hybrid fusion.
EXPERIMENTS
We used information from 57 first-year electrical engineering students at the University of Cordoba (Spain) in the Introduction to Computer Science course during the first semester of academic year 2017-2018. We have gathered all the information from four data sources: theory classes, practical classes, on-line sessions and final exam. The first three data sources gave us the input attributes and the final exam, the output attribute or class to predict. The students all gave their written consent to being recorded, after being informed about the study, and to have their data from practical and online sessions in Moodle collected for the study.
We have used four different data fusion approaches (merging all attributes; selecting the best attributes; using ensembles; and using ensembles and selecting the best attributes) and several white-box classification algorithms with the datasets. Then, we compare the predictions produced by the models (%Accuracy and ROC Area) to discover the best approach and classification model so that it is used for predicting students’ final performance.
Experiment 1: Merging all attributes
In experiment 1 we applied the classification algorithms to a single file with all the attributes merged. Firstly, we fused the different values of the 6 attributes collected in the theory and practical sessions in order to have just one single value for each attribute. In our case, we had 15 values (15 lectures) for each one of the 4 attributes collected in the face-to-face theory classes and 10 (10 sessions) and 5 (5 practicals) values respectively for each of the 2 attributes for face-to-face practice sessions. Fusing the 4 values about the on-line sessions was not necessary because the specific tool that we used for preprocessing the Moodle logs gave a single value for each attribute directly.
Table 1 shows that the best results (highest values) were produced by Nnge (80.45 %Acc) and Part (80.45%Acc and 0.91 AUC) algorithms. On average, most of the algorithms exhibited slightly improved performance in both measures when using discretized data.
This prediction model (see Table 2) consists of 5 rules that show that the students who pass the course are students who have medium scores in Moodle quizzes and also pay attention in theory classes, or students who simply have high scores in Moodle quizzes. The students who drop out from the course are students who pay little attention in theory classes and also show low activity in the Moodle forum. The students who fail the course are the students who get low scores in the Moodle quizzes. The remaining students are classified as passing.
Experiment 2: Selecting the best attributes
The selection of characteristics is important in the classification process by reducing not only the dimensions of the characteristic set but also the additional calculation time required for the classification algorithms. We used the well-known CfsSubsetEval (Correlation-based Featured Selection) method [11] provided by the WEKA tool [36]. It evaluates the worth of a subset of attributes by considering the individual predictive ability of each feature along with the degree of redundancy between them. Starting from our initial 10 input attributes, we produced two sets of 3 different optimal attributes for the numerical and discretized datasets (see Table 3).
Table 2 shows that the best results (highest values) were produced by Jrip (82.45%Acc), Nnge (80.45 %Acc), and J48 (82.45 %Acc and 0.92 AUC) algorithms. Again, on average most of the algorithms exhibited slightly improved performance in both measures when using discretized data.
This prediction model (see Table 4) is a decision tree with 9 leaves that can be transformed into 9 prediction rules. These rules show that the students who pass the course are students who have medium scores in Moodle quizzes and also pay medium to high attention in theory classes, or students who simply have high scores in Moodle quizzes. The students who drop out from the course are students who have low scores in Moodle quizzes, show low activity in the Moodle forum, and also pay little attention in theory classes. In addition, students who fail are the students that have low scores in Moodle quizzes, show low activity in the Moodle forum and pay medium to high attention in theory classes. There are also other failing student profiles: students who have medium scores in Moodle quizzes and also pay little attention in theory classes; students who have low scores in Moodle quizzes, show low activity in the Moodle forum, and pay medium to high attention in theory classes.
Experiment 3: Using ensembles
In experiment 3 we applied an ensemble of classification algorithms to each different source of data. However, instead of merging all of the attributes from the 4 data sources into a single file, we added the students’ final academic performance to each dataset. This produced three sets of datasets (6 files in total): two files (numerical and discrete version) for the theory classes with 4 input attributes and 1 output attribute or class; two files (numerical and discrete version) for the practical session with 2 input attributes and 1 output attribute or class; and two files (numerical and discrete version) for the online Moodle sessions with 4 input attributes and 1 output attribute or class.
A classifier is accurate if it works better than a random prediction of the data; sets perform better when base models are unstable with output undergoing significant changes in response to small changes in training data. We used the well-known Vote [4] automatic combining machine learning algorithm provided by WEKA. It produces better results than individual classification models, if the classifiers of the sets are accurate and diverse. Vote adaptively resamples and combines so that resampling weights are increased for those cases more often misclassified and the combination is done by weighted vote.
Table 5 shows that the best results (highest values) were produced by Jrip (85.96 %Acc and 0.93 AUC). Once again, on average most of the algorithms exhibited slightly improved performance in both measures when using discretized data
This prediction model (see Table 6) the students who regularly attend theory classes pass the course; the students who exhibit low attendance finally drop out. The students who regularly attend practical classes and exhibit high performance in those practical classes then pass the entire course. In contrast, the students who rarely attend practical classes and have low performance in practicals then fail the entire course. The students who upload a moderate number of activities to the Moodle platform or get high scores in Moodle quizzes are students who pass the course; and logically, the students who upload a low number of activities to the Moodle platform and get low scores in Moodle quizzes are students who fail the course, but the students with medium performance in quizzes and low contributions to the forum also fail.
Experiment 4: Using ensembles and selecting the best attributes
In experiment 4 we applied an ensemble of classification algorithms to the best attributes from each different source of data. Firstly, we selected the best attributes for each of the three different sets of datasets (6 files in total) generated in experiment 3. For that, we again used the well-known CfsSubsetEval attribute selection algorithm. The best result with our data was obtained when combining a weight of 1 for Theory and Practical with a weight of 2 for Moodle by using the average as combination rule for weights. We executed the six classification algorithms as base or individual classification models of our Voting method for the 6 previously generated summary datasets (see Table 7).
Table 7 shows that the best results (highest values) were produced by REPTree (87.47 %Acc and 0.94 AUC). Again, on average, most of the algorithms exhibited slightly improved performance in both measures when using discretized data.
This prediction model (see Table 8) is also a combination of three models that show differential student behavior related to theory, at the same time, students exhibiting medium or high attention, or medium to high Moodle forum participation fail; those demonstrating medium practical attendance or high practical attendance plus low or medium practice score also fail. The students that demonstrate high practical attendance and performance pass, as do the students with medium to high scores in Moodle quizzes.
In general, we can see that these white-box models are very useful for explaining to the teacher how the predictions of pass, fail or dropout are arrived at. The teacher can discover what the main predictive attributes and values are directly from the background of the IF-THEN rules.
CONCLUSIONS
This paper proposes to use four different data fusion approaches and six white-box classification algorithms to predict university students’ academic performance, from multiple-source and multimodal data in smart learning environments. We carried out 4 experiments to answer two research questions as conclusion:
- Which data fusion approach and classification algorithm produce the best results from our data? The REPTree classification algorithm produced the best results in this approach from discretized summary data.
- How useful are the prediction models we produce to help teachers detect students at risk of failing courses or dropping out? The white-box models we produced give teachers very understandable explanations (IF-THEN rules) of how they classified the students’ final performance or classification.
In the future, we intend to carry out more experiments in order to improve our process and to overcome some limitations:
- Analyzing the video automatically rather than manually or semi-automatically. Processing the video recordings automatically would gather information more efficiently compared to manual coding with the multiple modalities that characterize the classroom[1].
- Using raw data and other specific data fusion techniques. We used a basic Naïve and knowledge-based fusion method that uses summary data. However, there are many mathematical theories for fusing data [2] such as Probability-based methods (PBM) and Evidence reasoning methods (EBM) that we can use with raw data.
- Using more sources of information, including videos of practicals and on-line session interaction with Moodle; audio from theory classes and practicals, text analytics or text mining of what students write during theory classes, practicals or in Moodle.
ACKNOWLEDGMENTS
This work would not have been possible without the funding from the Ministry of Sciences and Innovation I+D+I PID2020-115832GB-I00 and PID2019-107201GB-I00.
REFERENCES
- Chan, M.C.E., Ochoa, X. and Clarke, D. 2020. Multimodal Learning Analytics in a Laboratory Classroom. Machine Learning Paradigms. M. Virvou, E. Alepis, G.A. Tsihrintzis, and L.C. Jain, eds. Springer International Publishing. 131–156.
- Ding, W., Jing, X., Yan, Z. and Yang, L.T. 2019. A survey on data fusion in internet of things: Towards secure and privacy-preserving fusion. Information Fusion. 51, (Nov. 2019), 129–144. DOI:https://doi.org/10.1016/j.inffus.2018.12.001.
- Jo, I.-H., Park, Y., Kim, J. and Song, J. Analysis of Online Behavior and Prediction of Learning Performance in Blended Learning Environments. 18.
- Kuncheva, L.I. 2014. Combining pattern classifiers: methods and algorithms. Wiley.
- Maarop, A.H. and Embi, M.A. 2016. Implementation of Blended Learning in Higher Learning Institutions: A Review of Literature. International Education Studies. 9, 3 (Feb. 2016), 41. DOI:https://doi.org/10.5539/ies.v9n3p41.
- Martyn, M. The Hybrid Online Model: Good Practice. 2003. 26(1), 18–23.
- Moskal, P., Dziuban, C. and Hartman, J. 2013. Blended learning: A dangerous idea? The Internet and Higher Education. 18, (Jul. 2013), 15–23. DOI:https://doi.org/10.1016/j.iheduc.2012.12.001.
- Romero, C. and Ventura, S. 2020. Educational data mining and learning analytics: An updated survey. WIREs Data Mining and Knowledge Discovery. 10, 3 (May 2020). DOI:https://doi.org/10.1002/widm.1355.
- Tabuenca, B., Serrano-Iglesias, S., Carruana-Martin, A., Villa-Torrano, C., Dimitriadis, Y. A., Asensio-Perez, J. I., & Kloos, C. D. 2021. Affordances and core functions of smart learning environments: A systematic literature review. IEEE Transactions on Learning Technologies. 14(2), 129–145.
- Worsley, M. 2014. Multimodal Learning Analytics as a Tool for Bridging Learning Theory and Complex Learning Behaviors. Proceedings of the 2014 ACM workshop on Multimodal Learning Analytics Workshop and Grand Challenge (Istanbul Turkey, Nov. 2014), 1–4.
- Zacharis, N. 2016. Predicting Student Academic Performance in Blended Learning Using Artificial Neural Networks. International Journal of Artificial Intelligence & Applications. 7, 5 (Sep. 2016), 17–29. DOI:https://doi.org/10.5121/ijaia.2016.7502.
© 2022 Copyright is held by the author(s). This work is distributed under the Creative Commons Attribution-NonCommercial-NoDerivatives 4.0 International (CC BY-NC-ND 4.0) license.