ABSTRACT
Educational process data, i.e., logs of detailed student activities in computerized or online learning platforms, has the potential to offer deep insights into how students learn. One can use process data for many downstream tasks such as learning outcome prediction and automatically delivering personalized intervention. In this paper, we propose a framework for learning representations of educational process data that is applicable across different learning scenarios. Our framework consists of a pre-training step that uses BERT-type objectives to learn representations from sequential process data and a fine-tuning step that further adjusts these representations on downstream prediction tasks. We apply our framework to the 2019 nation’s report card data mining competition dataset that consists of student problem-solving process data and detail the specific models we use in this scenario. We conduct both quantitative and qualitative experiments to show that our framework results in process data representations that are both predictive and informative.1
Keywords
1. INTRODUCTION
Student modeling [14] is a key research area in educational data mining since it produces estimates of individual factors that affect learning outcomes, including knowledge factors and psychosocial factors such as affect and interest, and informs personalization. There exist a wide range of student models, from those that analyze student responses to questions, such as item response theory [12] and models for knowledge tracing [3], to those that analyze student activity within digital learning platforms [1, 15, 16].
Educational process data, i.e., data that logs detailed student activity in digitized learning/testing environments, offers us an opportunity to look deeper into the process of learning for each individual student. One can use this process data in many ways: First, standalone process data, especially data from intelligent tutoring systems, learning management systems, or massive open online courses (MOOCs), can help us capture student behavioral patterns and predict future learning outcomes [9] or help prevent early dropout [6]. Second, process data during assessments, such as the dataset used in the 2019 nation’s report card (NAEP) data mining competition [11], can help us reconstruct the exact process behind how students construct their response to a question. This reconstructed process can potentially help us improve our estimate of student knowledge levels more than using only observed response [2].
One key challenge in educational process data analysis is how to represent process data. Creating good representations is key to improving performance in downstream tasks, as evident in recent advances in other fields, such as pre-trained language models like BERT [4] in natural language processing. The idea is simple: since we often lack a large amount of labels on the variable of interest in the prediction task, e.g., student learning outcomes, using these labels to learn representations of student process data in a supervised learning setup is insufficient and can lead to overfitting. Instead, we start with using the rich process data itself in a pre-training step to learn representations through self-supervised learning before fine-tuning these representations in the actual downstream prediction task.
1.1 Contributions
In this paper, we propose a generic framework for representation learning from educational process data and apply it to the NAEP Competition dataset [11]. First, we detail how to learn process data representations in a pre-training setup using objectives similar to those used in BERT. We then detail how to fine-tune these representations and use them in a downstream supervised learning task, e.g., predicting learning outcomes. Second, we apply our framework to problem-solving clickstreams as students take an online NAEP assessment and detail our modeling designs. Third, we conduct quantitative experiments to show that our framework is competitive with existing methods in multiple learning outcome prediction tasks. We also conduct qualitative experiments to show that our framework is able to learn meaningful process data representations.
2. METHODOLOGY
In this section we describe our framework, as well as apply it to several learning outcome prediction tasks using the NAEP 2019 competition dataset [11]. The basic ideas behind our framework follow from those in natural language processing (NLP) research but are adapted for student learning process data. There are three main technical components in our framework: 1) the process model, which takes a student’s process data as input and produces its latent representation vectors as output, 2) the pre-training objectives, which are a series of prediction tasks that we use in a self-supervised pre-training phase on the process data to learn its representations via the process model, and 3) the transfer function, which adapts the output of the process model, i.e., the latent representations of process data, for use in a downstream learning outcome prediction task.
2.1 Dataset
The dataset contains clickstream logs from students working on two blocks of online NAEP assessments, referred to as blocks A and B. Students are given a time limit of 30 minutes per block, in which they can complete questions in any order. The questions vary in type, including multiple choice, matching, fill in the blank, and “mixed” types. Each event in the log represents a single student action, such as selecting an option in a multiple choice question, typing a character into an answer field, opening the calculator tool, etc. Each raw event in the log contains the student ID, question ID, question type, event type, timestamp, and possibly additional event-specific information such as the target of a click event or the field and character of a key press event. To apply our framework to the NAEP assessment scenario, we process each event so that it has the form , where is the event type, is the number of seconds since the student started the test, is an identifier for the current question, and is a response status, which is either correct, incorrect, or incomplete. We additionally define a visit as a contiguous sequence of events that are part of the same question, as students may return to previously visited questions within a block. The sequences we provide to the process model each comprise all events of a single student working on a single question across all visits to that question.
2.2 Process Model and Pre-training
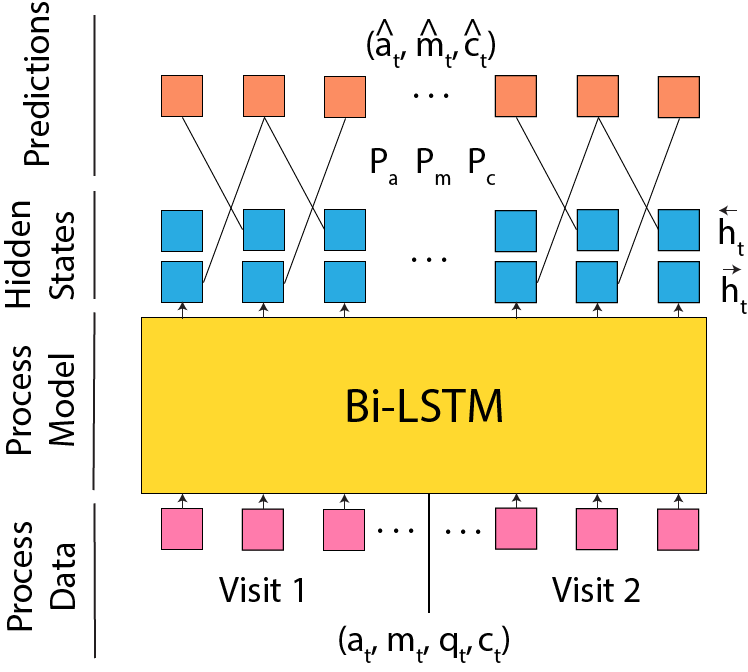
We now detail our process model, as well as the objectives used to pre-train it before it can be used on downstream tasks. Our process model is a Bi-LSTM [7], which contains two LSTM’s that run in parallel; one processes the sequence in order, and the other processes it in reverse. The hidden state of the forward LSTM at time step , \(\overrightarrow{\mathbf{h}}_t\), contextualizes . Similarly, the hidden state of the backward LSTM at time step , \(\overleftarrow{\mathbf{h}}_t\), contextualizes , for sequences of length . As input to the model, we use a vectorized form of each event, , which contains the concatenation of , learnable embeddings of and , and a one-hot encoding of .
To pre-train the model, we design separate objectives to predict the event type, timestamp, and response status of each event in a student’s process data for a question. By learning to predict these features of the input using context, as we will show, the model becomes able to make inferences about the data, which will be useful for making predictions in downstream tasks. Note that we don’t include a pre-training objective for because it is the same for every event in a question. The flow of data from input sequence to prediction is shown in Figure 1.
We predict the properties of event at each time step by leveraging its full context, which includes all preceding and following events, i.e., . Since \(\overrightarrow{\mathbf{h}}_{t-1}\) uses on information from and \(\overleftarrow{\mathbf{h}}_{t+1}\) uses on information from , we use \(\mathbf{z}_t=(\overrightarrow{\mathbf{h}}_{t-1},\overleftarrow{\mathbf{h}}_{t+1})\) as the encoded context that will be used for prediction. We predict by passing through a linear prediction head, , using the softmax function [5] to get a probability distribution over possible event types, and use cross-entropy to calculate the loss. We predict in the same way. We design a similar objective for , except that we predict an alternate target, , which represents the portion of time between the prior and following events when occurs. This value is bounded by 0 and 1, which allows us to use binary cross-entropy as the loss function. The advantage to this method over mean-squared error is that because time lapses between student events can vary greatly, the loss for each event is treated more equally. The final pre-training loss for the sequence, , is the sum of the prediction loss for , , and for each event in the sequence. My minimizing , the process model learns to reconstruct events based on surrounding context in a self-supervised setup, thus encoding relevant information in its latent states as a result.
2.3 Transfer Learning
We now detail a transfer function, , that produces a fixed-size output for a downstream prediction task, given the latent states of the process model as input. For the purpose of transfer learning, we define the outputs of the process model to be \(\mathbf{z}_1,\ldots,\mathbf{z}_T=((\overrightarrow{\mathbf{h}}_1, \overleftarrow{\mathbf{h}}_1),\ldots,(\overrightarrow{\mathbf{h}}_T, \overleftarrow{\mathbf{h}}_T))\). This setup results in each containing contextualized information that is relevant to the input at time step , as was ensured by the pre-training process. We combine these outputs using a learnable attention module [5], which assigns a weight to each output latent state of the process model, and then uses the weights to combine all outputs into a single vector. We define the weight vector as , where is a learnable linear projection. We then generate a single vector to represent the entire sequence: .
We can now use this representative vector in a several ways to solve downstream tasks. In the simple case, where we predict the learning outcome at the level of a single question, e.g., the correctness of the student’s response to the question, we can generate the prediction , where is a learnable linear projection. Additionally, we may want to predict the learning outcome at the level of a student, e.g., the student’s score on a future test, which requires us to combine the representative vectors for each question in the student’s process data. To achieve this, we define a feed-forward neural network , and generate predictions using the concatenation of the representative vectors for each question: , where corresponds to the representation of the student’s activity on question and is the total number of questions. In either case, each in the transfer function can be trained by using an appropriate loss function on the predicted label. In the next section, we show an example of how the transfer function can be used to enhance a separate prediction task.
2.4 Item Response Theory
A popular framework for making predictions at the question level is item response theory (IRT) [8]; we now detail how to enhance it with behavioral data. The 1PL version of IRT learns an ability value for each student and a difficulty value for each question, which are used to predict the probability that a student will answer a question correctly. We introduce a new behavior term, which will adjust the model’s prediction based on the student’s process data for the question. We derive the term using the transfer function: , where is the representative vector for student ’s process data on question , as generated by the process model and the attention module. The predicted probability of a student getting a question correct is defined as , where is an indicator of the correctness of the student’s response, is the learned student ability, is the learned question difficulty, and is the sigmoid function. By minimizing the binary cross-entropy loss of the prediction with the actual correctness label, the model can jointly learn , , and . Note that for this task, we must remove all indications of response status from the data and not perform the response status pre-training objective, since including them would leak information that could infer the label directly.
3. EXPERIMENTS
In this section, we present the experimental results of our framework applied to the NAEP competition data on two learning outcome prediction tasks. We compare our framework to existing baselines for both the NAEP process data and other process datasets. We finally investigate the interpretability of the process model’s latent representations using visualizations and qualitative analysis.
3.1 Baselines
We use two baselines to compare our framework against. The first is Feature Engineering (FE), for which we used the method of the 2nd place submission from the NAEP 2019 competition [10]. Their technique calculates a large number of features for each student activity sequence, uses a genetic algorithm (GA) to select the best set of features for a target prediction label, and then trains a model ensemble to produce a final prediction for the task. We re-ran their GA and ensemble algorithms to obtain predictions for our per-student prediction label. The second baseline is Clickstream Knowledge Tracing (CKT), for which we adapted the technique developed in [2], which uses student problem solving process data for the downstream task of knowledge tracing (KT). Their technique uses an autoencoder pre-training setup where question-level process data is encoded, passed through a bottleneck vector, and reconstructed. We use the bottleneck vector as input to downstream prediction tasks.
3.2 Per-Student Label
We first evaluate our method on a per-student label, referred to as the score label, which is a binary indicator of if a student scored above or below average in the second block (B) of the exam. We predict this label by observing process data exclusively from the first block (A).
For our model and the CKT baseline, we perform a multi-phase cross-validation experiment. For each fold, using the questions in the training split, we pre-train the process model, and then train the transfer function on the score label. For both of these, we use the validation split for early stopping. Finally, we evaluate the model on the test set, which is fixed across folds. We measure area under the receiver operating characteristic curve (AUC), and report the average and standard deviation of the AUC on the test set over all folds. Note that the FE baseline only returns a single set of predictions for the ensemble.
| Model | Test AUC | Test AUC without |
|---|---|---|
| FE | 0.828 | – |
| CKT | ||
| Ours |
As shown in the second column of Table 1, both CKT and our model outperformed the FE baseline. This observation fits our expectation: since sequential neural models have direct access to the raw process data, they are able to pick up on subtleties that may not be captured by human-engineered features. Our method slightly outperforms CKT on this label, indicating that our process model and transfer function are able to capture more information that is indicative of student performance than CKT. We also examine the ability of the models to predict performance strictly using behavioral information, without any indication of correctness. To do this, we repeat the experiments but remove the response status from the input and do not perform the associated pre-training objective. We see from the third column of Table 1 that the AUC drops, as expected, but is still considerably high, indicating that these models can infer student performance from their behavior.
3.3 Item Response Theory
We now evaluate our model in the IRT setting in order to examine if our methodology can improve performance prediction on questions using additional data on student behavior within a question.
For the IRT experiments, we use all student activity sequences across blocks A and B. We split the questions into train/test sets using multi-label stratification to ensure all ability and difficulty parameters are sufficiently trained. We then perform a similar cross-validation experiment to the score label, where for each fold, the process model is pre-trained, and then the transfer function and IRT-specific parameters are trained on the question correctness label. The AUC on the test set is recorded after each fold, and the average and standard deviation are reported.
| Model | All Questions | Completed Questions |
|---|---|---|
| Base | ||
| CKT | ||
| Ours |
We see from Table 2 that the behavioral data leveraged by both our model and CKT result in a small improvement in test AUC over the base IRT model. We also observe that questions that were left incomplete by students were very easy to predict as incorrect with process data since certain event types missing in a student activity sequence clearly indicate incomplete status. To account for this observation, we also report the AUC after removing incomplete questions from the test set. We see that the performance drops for all models, although more significantly for the behavior-enhanced models, leaving our method’s performance slightly below CKT. However, the fact that the behavior-enhanced models still improve over the base IRT model suggests that student behavior provides important additional information on student performance beyond the original student ability and question difficulty parameters in IRT.
3.4 Qualitative Analysis
We now examine the interpretability of the latent behavioral vectors that our methodology produces. We will examine student-level latent vectors extracted from a version of the student-level model, which was modified to capture task-switching behavior. We also performed an analysis of question-level latent vectors extracted from the behavior-enhanced IRT model, where we saw strong behavior-based clustering patterns. However, because question-level behavior representation is similar to the capabilities of CKT, we omit this analysis from this paper, and its details can be found in the long version. For the following figure, we use t-SNE [13] to visualize the latent vectors in 2D and investigate characteristic behavioral patterns in the visible clusters.
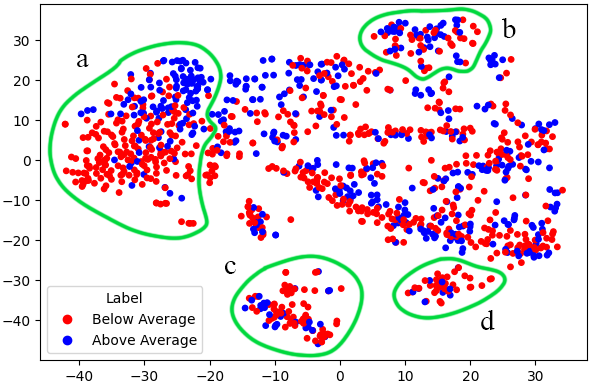
To investigate if our model can capture high-level task-switching and test-taking behaviors, we investigate student-level representations, which combine all question visits of a student into a single latent vector. We train a model on the score label task with the following modifications to our original setup: 1) we provide the process model with sequences of events in a single visit to a question, rather than across all visits to a question, 2) we add a new pre-training objective to predict the question ID of each event to encode task-switching information in the latent representations, and 3) we replace the fully-connected neural network with an RNN, since the visits are sequential in nature. We use the final hidden state of the RNN for both label prediction and representation visualization.
In Figure 2, we visualize the student-level vectors generated from block A data, colored according to the score label. We identify 4 distinct clusters, while the rest of the vectors have no obvious pattern: a) Rapid testing: most students in this group finished all questions in block A with a significant amount of time remaining. b) Checked their work: students in this group made multiple visits to most questions, often not making changes in the second visit. c and d) Ran out of time: both of these clusters represent students that took the whole time but did not answer all the questions.
4. CONCLUSIONS
In this paper, we developed a BERT-style framework for pre-training and transfer learning on educational process data. We applied our framework to several downstream learning outcome prediction tasks on NAEP assessment process data used in the NAEP 2019 data mining competition. Through quantitative and qualitative experiments, we demonstrated that models developed with our framework can 1) leverage process data to make accurate learning outcome predictions, and 2) generate meaningful representations of student behavior from process data. There are several potential areas for future research. First, our process model currently only represents single questions, which results in student-level representations that are less meaningful than the question-level representations. Future work should aim to develop a process model that can simultaneously represent events across all questions in a student’s process data. Second, future work should aim to implement this framework on complementary datasets, such as video clickstreams, to validate its ability to capture behavioral data across settings.
5. REFERENCES
- A. F. Botelho, R. S. Baker, and N. T. Heffernan. Improving sensor-free affect detection using deep learning. In E. André, R. Baker, X. Hu, M. M. T. Rodrigo, and B. du Boulay, editors, Int. Conf. Artif. Intell. Edu., pages 40–51. Springer International Publishing, 2017.
- W.-L. Chan and D.-Y. Yeung. Clickstream knowledge tracing: Modeling how students answer interactive online questions. In Int. Learn. Analytics and Knowl. Conf., pages 99–109. Association for Computing Machinery, 2021.
- A. T. Corbett and J. R. Anderson. Knowledge tracing: Modeling the acquisition of procedural knowledge. User modeling and user-adapted interaction, 4(4):253–278, 1994.
- J. Devlin, M.-W. Chang, K. Lee, and K. Toutanova. Bert: Pre-training of deep bidirectional transformers for language understanding. arXiv preprint arXiv:1810.04805, 2018.
- I. Goodfellow, Y. Bengio, and A. Courville. Deep Learning. MIT Press, 2016.
- S. Halawa, D. Greene, and J. Mitchell. Dropout prediction in moocs using learner activity features. Proceedings of the second European MOOC stakeholder summit, 37(1):58–65, 2014.
- S. Hochreiter and J. Schmidhuber. Long short-term memory. Neural Computation, 9(8):1735–1780, Nov. 1997.
- F. Lord. Applications of Item Response Theory to Practical Testing Problems. Erlbaum Associates, 1980.
- Z. A. Pardos, R. S. Baker, M. O. San Pedro, S. M. Gowda, and S. M. Gowda. Affective states and state tests: Investigating how affect and engagement during the school year predict end-of-year learning outcomes. Journal of Learning Analytics, 1(1):107–128, 2014.
- N. Patel, A. Sharma, T. Shah, D. Lomas, et al. Modeling naep test-taking behavior using educational process analysis. Journal of Educational Data Mining, 13(2):16–54, 2021.
- T. Patikorn,
N. Heffernan,
R. Baker,
B. Woolf,
I. Kats,
C. Forsyth,
and
J. Ocumpaugh.
Nation’s
report
card
data
mining
competition
2019.
online:
https://sites.google.com/view/dataminingcompetition2019/home. - W. J. van der Linden and R. K. Hambleton. Handbook of modern item response theory. Springer Science and Business Media, 2013.
- L. Van der Maaten and G. Hinton. Visualizing data using t-sne. Journal of machine learning research, 9(11):2579–2605, 2008.
- K. VanLehn. Student modeling. Found. Intell. Tut. Syst., pages 55–78, 1988.
- D. Yang, T. Sinha, D. Adamson, and C. P. Rosé. Turn on, tune in, drop out: Anticipating student dropouts in massive open online courses. In Data-driven Educ. WRKSH Conf. Neural Inf. Process. Syst., volume 11, page 14, 2013.
- M. Yao, S. Zhao, S. Sahebi, and R. Feyzi Behnagh. Stimuli-sensitive hawkes processes for personalized student procrastination modeling. In The World Wide Web Conf., pages 1562–1573. Association for Computing Machinery, 2021.
1A long version of this paper with additional details and a code
reference can be found at https://arxiv.org/abs/2204.13607
© 2022 Copyright is held by the author(s). This work is distributed under the Creative Commons Attribution-NonCommercial-NoDerivatives 4.0 International (CC BY-NC-ND 4.0) license.