ABSTRACT
E-learning preparedness in higher education is an important aspect that determines students’ interaction behaviors within online learning environments. This study is primarily motivated by the growing evidence pointing to the importance of constructing fair and unbiased learning analytics in higher education. The primary goal of this study was to examine the impact of potentially bias-driven variables in predictive learning analytics models. We used an empirical data set collected from 123 undergraduate students who participated in a remote asynchronous course in Fall 2021. Our study adopted various statistical and machine learning techniques to remedy the biased prediction behaviors in learning analytics. First, we conducted a path analysis to evaluate the connection between students’ e-learning preparedness and their interaction within the e-learning system. We simulated a large synthetic dataset from the empirical dataset and adopted two fair artificial intelligence algorithms—Seldonian and Adversarial Networks algorithms. Our findings indicated that e-learning preparedness is significantly related to the commonly adopted temporal features in learning analytics, such as time-use entropy (b=.449, p<.001) and assignment submission time (b=-.587, p<.001), and indirectly associated with students’ course performance (b=.219, p<.001). Both algorithms indicated that bias-reduced algorithms performed comparably worse than the naive algorithms in predicting students’ performance (f1-score=0.72); however, they produced less biased predictions after taking students’ e-learning preparedness into account. A significant shift in model weights were observed, where the models tended to emphasize the importance on the variety of activity sequence than the temporal information.
Keywords
INTRODUCTION
The sudden instructional and pedagogical changes that the COVID-19 pandemic has brought in higher education have been tremendous. The recent U.S. statistics indicated that more than 52% of college students had to participate in remote learning during the year 2019-2020. Many universities and college-level courses that are designed for face-to-face in-person learning, transitioned online. Instructors prepared asynchronous or synchronous remote learning courses with lecture videos and learning materials to accommodate the changes. Learning analytics systems were introduced to support managing distance learning for higher education institutions. Learning analytics frameworks adopt various statistical and machine learning techniques to enrich evidence-based instructions [1]. Many of the previously introduced learning analytics systems in higher education focused on detecting at-risk students [5, 16] and predicting student success [17]. Higher education institutions gained the capacity to gather, manage, and access student learning information more closely with the wide adoption of distance learning. The adoption of various learning analytics systems opened opportunities for an in-depth understanding of students’ learning progress.
Despite the interesting benefits that learning analytics systems brought to higher education institutions, a growing concern evolved in the fairness and equitable uses of learning analytics [8, 10, 23]. One of the many underlying fairness and bias-related issues in learning analytics concerns the incomplete consideration and critical evaluation of the nature of the data and data collection [25]. For instance, with the sudden shift to remote learning, a considerable number of students faced significant challenges that arise from a lack of preparedness for distance learning [2, 6, 19, 21, 22] Faculties and instructors indicated some of the challenges they faced during this period, such as students' lack of basic resources and equipment to participate in e-learning, and disruptions to learning time due to poor internet connections [29].
Likewise, students may require a more reliable setup for learning at home with the appropriate gears and equipment to participate in remote learning. The varying level of physical and psychological preparedness for e-learning showcases the important underlying nature of data and data collection in learning analytics, especially during the rapid transition to online learning in higher education institutions. For instance, reaction-time or temporal features are commonly adopted for student success prediction [14, 15]. They evaluate time-related students’ interaction attributes, such as how rapidly students react to the uploaded learning resources. The reaction-time features are often positively associated with students’ self-regulated learning behaviors and improved learning outcomes in many learning analytics algorithms [20, 27]. This study takes a different view on how “fairness” could be acquired in learning analytics for higher education. Fairness in learning analytics was often discussed in the previous studies with the light on students’ unique personal and demographic backgrounds (e.g., gender). Instead, we focus on how the learning analytics could potentially make biased decisions or predictions for the students with the lack of preparedness in e-learning. The following research questions were addressed in this study: (1) Does students’ level of e-learning preparedness relate to their interaction behaviors in an online course platform? (2) Does students’ level of e-learning preparedness relate to their course performance in an online course? and (3) Does the bias-reduced prediction model, which takes students’ e-learning preparedness into account, achieve significantly lower accuracy?
RELATED WORK
E-learning Preparedness
An exhaustive review of the past 20 years of the literature revealed interesting underlying dimensions of students’ e-learning preparedness in higher education, although there is no consensus on what exactly preparedness or readiness is. Earlier studies focused on students’ “readiness” in online learning. For instance, Smith et al. [24] identified students’ psychological factors and personal attributes, such as their comfort with e-learning and self-management of learning, as two primary underlying factors which define students’ readiness in e-learning environments. Their findings were replicated and confirmed by other researchers (e.g., [3]). Watkins et al. [28] expanded the definition of e-learning readiness with six dimensions, including the two unique physical environmental attributes, such as the “Access to Technology” and “Online Audio/Video”, as well as psychological aspects as “Online Skills and Relationships”, “Motivation”, “Internet Discussions”, and “Importance to their Success”. Similarly, Holsapple and Lee-Post [12] suggested that e-learning preparedness should be measured in the primary three dimensions of students’ technical competencies, lifestyle aptitudes, and learning preferences. Parkes et al. [21] proposed a shift in focus between readiness and preparedness. They focused on the “necessary” skills and competencies students need to be prepared for e-learning. For instance, students’ competencies in “managing learning in the online environment”, “interacting with the e-learning content”, and the “e-learning communities”, were identified as important dimensions to define one’s preparedness for e-learning.
Fair Prediction in AI
The following two frameworks are introduced and adopted in our study to demonstrate the potential bias that presents in algorithm.
Seldonian Algorithm
The Seldonian algorithm [26] introduces a three-stage framework to prevent machine learning algorithms from making biased outcomes. The algorithm takes the data (D) and partitions it into two sets of and . Using the first part of the dataset, the algorithm selects a solution candidate,, which is likely to pass the algorithm bias safety test. Then, the second part of the data, is used as a safety set. The Seldonian algorithm allows safety constraints to be represented as is a function that quantifies the safety of the solution and is the permissive probability of returning an unsafe solution. The safety constraint ensures that the algorithm could achieve ( to ensure a safe choice of solution candidate. When only one constraint is given, this constraint can be understood as an equalized odds constraint [11]. The equalized odds constraint is defined based on the true positive rate (or TPR) across groups that are designed to evaluate and compare the degree of bias in model performance. Assume that A is the sensitivity feature to create two groups (0 = unprepared, 1 = prepared in e-learning) and Y is a predicted outcome variable (1 = success in the course). The equalized odds are satisfied when both the true-positive and the false-positive rates are equal across the two groups (equation 2).
(2) |
Using the equalized odds constraint, the constraint, , can be expressed when we decide to create an equalized odds score that is smaller than 0.05. In other words, this constraint has the upper bound of 0.05 to account for the absolute differences between the accuracy in predictions between the two groups.
Adversarial Neural Networks
Adversarial networks are supervised learning techniques that systematically associates the uncertainties in the data generation process to represent the real-world setting more accurately. Given a set of probabilities, which consists of the data target, , and the contextual sensitive parameter, in fair AI prediction, we aimed to develop a solution that maps with the classifier that is robust to the value of Z. This process can be learned efficiently using the adversarial networks [9]. For fair AI models, we could constrain the predictive classifier to satisfy a certain constraint which has to do with the sensitive parameter Z. The goal of our classifier is to learn the parameters which map Hence, we minimize the cross-entropy loss function, to obtain the parameters, . In the case of student performance prediction, represents students’ performance outcome. The initial inference of the classifier will be defined based on) and the value of will be unknown to the model now. This indicates that the model outputs the equal conditional probability for any and (equation 3).
(3
METHODS
Data
Our dataset was collected from a total of 123 undergraduate students who are enrolled in an educational assessment course in a western Canadian university in Fall 2020. This course was traditionally delivered as an in-person course but transitioned to an asynchronous online course in Fall 2020. At the beginning of the semester, the students were provided with a “welcome survey” questionnaire. The questionnaire included four items evaluating students’ physical and psychological readiness and preparedness for an online course (see Appendix). We recoded the responses to define a variable representing “e-learning preparedness” in an online learning environment. We hypothesized that the students who are physically well-prepared for the online course would currently be located at the same time-zone, have devices that are equipped with the required functionality to participate and interact with the course materials, and have reliable devices that are portable. This was based on the course outline and the requirements related to the course materials and assignments. Once the physical/environmental preparedness score is computed, it is combined with the psychological preparedness score. Final preparedness is represented as a binary score of those who are above (1) or below (0) average in environmental and psychological preparedness for online learning (see Tables 1 and 2).
Interaction Log Data
To understand students’ learning behaviors within the online course module, we extracted a comprehensive list of students’ behaviors and selected the deterministic features to construct a prediction model. To replicate commonly extracted features in prediction-focused learning analytics systems, we used a commonly adopted open-source automated feature engineering tool called Featuretools. It performs Deep Feature Synthesis to extract aggregative and transformative features from the interaction log data. The extracted features represent descriptive instances (e.g., absolute, count, mean, mode), as well as the advanced interactions (e.g., entropy, time since previous). This feature analysis framework was selected as they are frequently adopted in learning analytics [4]. In addition, we extracted a list of n-gram-based log activity features. The features represent a sequence of instructional activities that students frequently perform. A total of 132 unique activities are captured and classified into 14 overall categories. The n-gram-based features represented a frequent sequence of actions that students partake among these 14 activity categories. The feature and the values were extracted using a TF-IDF vectorization.
Path Analysis Model
We aimed to understand the association of students’ e-learning preparedness with their interaction activities which are represented by the log features. We constructed a path analysis model using the empirical data collected from the undergraduate participants (n=123). The hypothesized model path model first controlled for the effect of students’ familiarity with the course content (Familiarity) on the students’ course outcome (Summative). This allowed us to evaluate the relationship between e-learning preparedness with other variables while controlling for the effect of familiarity. The path model evaluated the associations between the preparedness and interaction log activities. Two interaction log variables were selected from the final feature sets extracted in the previous stage. Last, the two interaction log features were related to the students’ formative and summative course performance. Our hypothesized model evaluated the importance of preparedness in understanding students’ interaction in an online course as well as the relationship with the course outcomes.
Simulation Setting
We used the distributional characteristics of the variables and the correlations among the variables in our empirical dataset to simulate a larger-size dataset (N = 10,000). The data simulation process consisted of several steps. First, we obtained the distribution parameters for the variables included in the path analysis model. Second, we calculated the target correlation matrix based on the observed correlations in the empirical dataset. Third, we checked the lower and upper bounds of the pairwise correlations for the given distribution parameters to ensure that the target correlation matrix is within the bounds. Next, we simulated the dataset using the SimMultiCorrData package [7] in R. Last, we reviewed the generated variables and the maximum error between the final and target correlation matrices.
Results
Features
The survey results with the empirical dataset indicated that close to 32.5% of the students scored below the average in the total preparedness score. The rest of the students (67.5%) scored above the average. The e-learning preparedness score had a mean of 4.46 and a standard deviation of 1.61. The familiarity with the content with the total of 9 key concepts indicated the mean of 16.54 and the standard deviation of 6.55. The interaction log feature engineering using the Featuretools extracted a total of 137 variables. The n-gram tf-idf features extracted a total of 102 features to represent the frequency and the sequence of students’ log actions. The feature dimension reduction process resulted in a total of 13 features.
Path Analysis Results
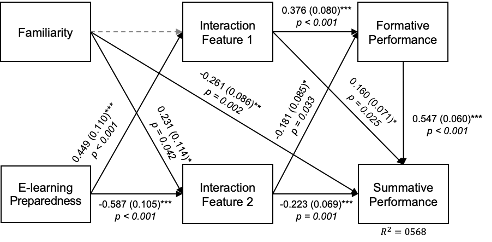
Figure 1 provides a diagram of the final path analysis model which is hypothesized and evaluated in our study. The path analysis results showed a good model-fit (CFI > 0.90, TLI >0.90, RMSEA <0.06, SRMR <0.09; [13]). The two variables representing students’ interaction with the online course platform (Interaction Features 1 and 2) were also significantly associated with students’ preparedness (b=0.433, s.e.=0.073, p<0.001; b=-0.421, s.e. =0.074, p<0.001). This was evaluated while controlling for the effect of students’ familiarity with the course content. Interestingly, the familiarity of course content was significantly related to only one of the interaction log activities (interaction feature 1: b=-0.022, s.e.=0.115, p=0.851; interaction feature2: b=0.231, s.e.=0.114, p=0.042). This shows that the students’ level of preparedness for e-learning is significantly related to their activities in online learning platforms when controlling for their familiarity with the material.
The level of interaction with the learning platforms were also significantly related to students’ formative (b=0.376, s.e.=0.080, p<.001; b=-0.181, s.e=0.085, p=.033) and summative course performance (b=0.160, s.e.=0.071, p=.025; b=-0.223, s.e.=0.069, p=.001), respectively. The findings also showed that the interaction log activities which were highly associated with students’ “E-learning preparedness'' were also highly related to students’ formative and summative performance. In summary, we observed a significant total indirect effect of e-learning preparedness on summative performance score (b=0.219, s.e.=0.048, p<0.001) with the direct effect that is statistically not significant (b=0.107, s.e.=0.060, p=0.073). This shows that students’ preparedness in e-learning may not be directly associated with their online learning performance when controlling for the students’ familiarity with the course content. However, e-learning preparedness was highly associated with students’ interaction activities in online learning, which were highly associated with the performance outcomes. In summary, the path analysis model demonstrated the importance of acknowledging the presence of varying levels of “e-learning preparedness"
Fair AI Prediction Results
Logistic Regression Performance
Table 3 (see Appendix) provides a comparison of Seldonian model performance results. The classification performance results were provided based on the binary target of students’ summative performance that is created using the quantile cut-offs (0.10 - 0.90). The findings showed that the bias-reduced logistic regression (LR) models based on students’ “E-learning preparedness” may not perform as well as the unconstrained LR model. It showed that our logistic regression algorithm could achieve the highest accuracy and f1-scores in classifying the target variable across all quantile cut-offs. The best classification performance of the unconstrained LR model achieved the f1-score of 0.95. Seldonian models with the bigger equalized odds values performed better (acc=0.72, f1-score=0.76 vs. LR acc=0.76, f1-score=0.80).
Adversarial Networks Performance Results
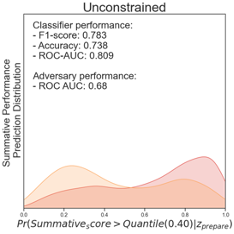
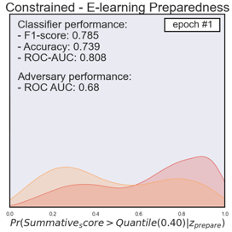
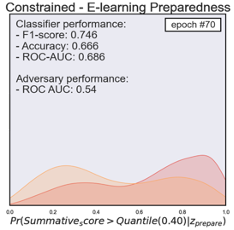
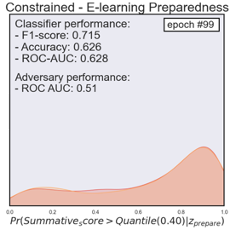
Figure 2 provides diagrams that represent the distribution of the prediction of unprepared (yellow) and prepared (red) students when using the adversarial networks. The evaluation results were based on classifying students’ summative performance with the 0.40 quantile as a cut-off. The initial performance of the biased classifier achieved an accuracy of 0.74, f1-score of 0.78, and the AUC-ROC score of 0.81. The classification distribution indicated that students from the unprepared category showed a noticeably higher probability to be less successful in the summative assessment (see Figure 2 - Unconstrained). By contrast, the well-prepared students showed a higher probability to be successful. Likewise, the classifier showed relatively biased classification results with the AUC-ROC score of 0.66 to classify students based on their preparedness. After a total of 100 epochs, we noticed that the adversarial algorithm with a constraint (or bias-reduced model) achieved an accuracy of 0.63, f1-score of 0.72, and AUC-ROC of 0.63 in classifying students based on their summative performance outcome. The final algorithm could no longer differentiate the students based on their e-learning preparedness (AUC-ROC 0.51). This indicates the final model was well-trained to remove the potential influence from the bias classification. The last figure in Figure 2 provides a visual representation of the final model classification distribution comparisons. It showcases how the two distributions converged. We noticed that the final bias-removed model could acquire a relatively good classification performance.
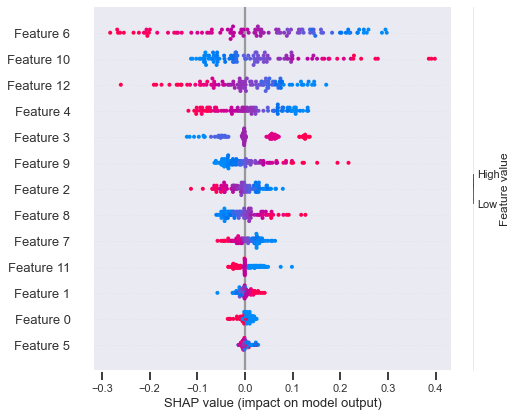
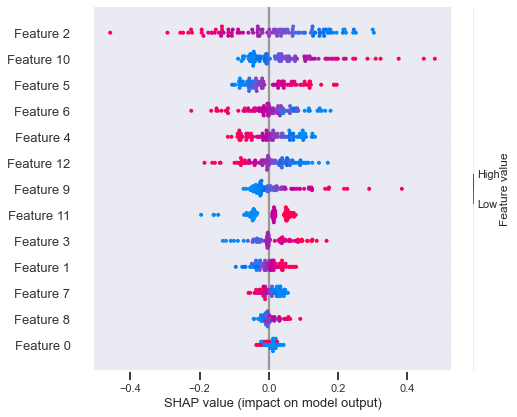
We compared the final model weights of the biased model and the bias-reduced model. The relative impact of a total of 13 interaction log features (see Figure 3; Appendix) on classification was investigated using Shap [18]. The feature values (high or low, red, or blue) indicated the impact of the feature in producing higher or lower values in classification. Each dot (red or blue) represents the location of feature values in each sample. The x-axis represents the correlation between the final classification outcome and the feature values. The interaction log features were ranked in descending order based on their importance in classification. For instance, a high value in Feature 6 (red dots) was associated with the final classification (1=success) with a negative correlation (Shap values <0) in the biased classification model. Instead, the lower values (blue dots) in Feature 6 were positively associated with the outcome classification in the biased model. By contrast, the lower values in Feature 10 were negatively correlated with the student success in the unconstrained model. Features 6 followed by the Features 10, 12, 4, 3, and 9 were identified as important and contributing features in the biased model to classify students based on their performance. Interestingly, the importance of features and direction of relationships with the outcome shifted quite drastically in the bias-reduced model. In the biased-constrained model, feature 2 was considered the most important, with its higher values (red) associated negatively with student success. Features 2 followed by the Features 10, 5, 4, and 6 were identified as important and contributing features in the bias-reduced model to classify students based on their performance. The direction of the relationship and the relative importance of Feature 10 remained the same for both models. Feature 10 represents the frequency of engaging in an activity related to learning resources (e.g., downloading).
DISCUSSION AND CONCLUSION
The primary goal of this study was to investigate the presence of the potentially biased behaviors of learning analytics models in higher education. We introduced empirical (N=123) and simulated (N=10,000) datasets of students’ course logs to understand the biased-prediction behaviors of learning analytics models based on students’ e-learning preparedness. Our study was conducted in two stages. First, we evaluated the association between students’ e-learning preparedness and their online course performance outcomes. We specifically investigated the indirect (via the interaction log features) and direct relationship between the preparedness and summative performance outcomes (i.e., course exams). Students’ interaction behaviors in the course were represented by the commonly adopted learning analytics features, such as their activity sequence and temporal information. Second, we investigated how the fair artificial intelligence (AI) models— Seldonian Algorithm and Adversarial Networks— could perform when attempting to reduce the bias in predicting students’ performance outcomes. The two models were designed and implemented so that they could acknowledge students' varying levels of preparedness in participating in remote learning.
Our analytic framework using the path analysis model and two fair AI algorithms -- the Seldonian algorithm and the adversarial networks -- demonstrated efficient and effective means to evaluate the “e-learning preparedness” as a potential source of bias in learning analytics in higher education. We also visually demonstrated how the bias-reduced model shifted its model weights to emphasize the features that are potentially more robust to the (physically and psychologically) unprepared groups of students in remote learning. For future work, we aimed to generalize the findings with more empirical datasets in higher education settings, such as the e-learning interaction log datasets from different audiences and domains. We would like to examine how such dynamics differ as remote learning matures and students’ preparedness (especially physical preparedness) changes with the consistent support from higher education institutions. Namely, our ultimate objective is to provide and promote less biased and more informative learning analytics in higher education, which could provide timely interventions to at-risk students. The findings from our study delineate the importance of careful consideration of the potentially biased source of information when constructing learning analytics models in a higher education environment. Our findings suggest that students’ e-learning preparedness should be carefully considered to provide effective and diagnostic evaluation using learning analytics systems.
REFERENCES
- Agarwal, R. and Dhar, V. 2014. Editorial—Big Data, Data Science, and Analytics: The Opportunity and Challenge for IS Research. Information Systems Research 25(3):443-448. https://doi.org/10.1287/isre.2014.0546.
- Ana, A. 2020. Students’ Perceptions of the Twists and Turns of E-learning in the Midst of the Covid 19 Outbreak. Revista Romaneasca pentru Educatie Multidimensionala, 12(1Sup2), 15-26. https://doi.org/10.18662/rrem/12.1sup1/242
- Blankenship, R., and Atkinson, J. K. 2010. Undergraduate student online learning readiness. International Journal of Education Research, 5(2), 44-54.
- Bosch, N., 2021. AutoML Feature Engineering for Student Modeling Yields High Accuracy, but Limited Interpretability. Journal of Educational Data Mining, 13(2), pp.55-79.
- de Oliveira, C. F., Sobral, S. R., Ferreira, M. J., & Moreira, F. (2021). How Does Learning Analytics Contribute to Prevent Students’ Dropout in Higher Education: A Systematic Literature Review. Big Data and Cognitive Computing, 5(4), 64.
- Elumalai, K. V. et al. 2020. Factors affecting the quality of e-learning during the COVID-19 pandemic from the perspective of higher education students. Journal of Information Technology Education: Research, 19, 731-753. https://doi.org/10.28945/4628
- Fialkowski, A. C. 2018. SimMultiCorrData: Simulation of correlated data with multiple variable types. R package version 0.2.2.
- Gardner, J., Brooks, C. and Baker, R., 2019, March. Evaluating the fairness of predictive student models through slicing analysis. In Proceedings of the 9th international conference on learning analytics & knowledge (pp. 225-234).
- Goodfellow, I., Pouget-Abadie, J., Mirza, M., Xu, B., Warde-Farley, D., Ozair, S., Courville, A. and Bengio, Y., 2014. Generative adversarial nets. Advances in neural information processing systems, 27.
- Hakami, E. and Hernández Leo, D., 2020. How are learning analytics considering the societal values of fairness, accountability, transparency and human well-being?: A literature review. In: Martínez-Monés A, Álvarez A, Caeiro-Rodríguez M, Dimitriadis Y, editors. LASI-SPAIN 2020: Learning Analytics Summer Institute Spain 2020: Learning Analytics. Time for Adoption?; 2020 Jun 15-16; Valladolid, Spain. Aachen: CEUR; 2020. p. 121-41.
- Hardt, M., Price, E., & Srebro, N. (2016). Equality of opportunity in supervised learning. Advances in neural information processing systems, 29.
- Holsapple, C.W. and Lee‐Post, A., 2006. Defining, assessing, and promoting e‐learning success: An information systems perspective. Decision sciences journal of innovative education, 4(1), pp.67-85.
- Hu, L.T. and Bentler, P.M., 1999. Cutoff criteria for fit indexes in covariance structure analysis: Conventional criteria versus new alternatives. Structural equation modeling: a multidisciplinary journal, 6(1), pp.1-55.
- Knight, S., Friend Wise, A., and Chen, B. 2017. Time for Change: Why Learning Analytics Needs Temporal Analysis. Journal of Learning Analytics, 4(3), 7–17.
- Kokoç, M., Akçapınar, G., and Hasnine, M. N. 2021. Unfolding Students’ Online Assignment Submission Behavioral Patterns using Temporal Learning Analytics. Educational Technology & Society, 24(1), 223–235. https://www.jstor.org/stable/26977869
- Larrabee Sønderlund, A., Hughes, E. and Smith, J. 2019. The efficacy of learning analytics interventions in higher education: A systematic review. Br J Educ Technol, 50: 2594-2618. https://doi.org/10.1111/bjet.12720
- Leitner P., Khalil M., and Ebner M. 2017. Learning Analytics in Higher Education—A Literature Review. In: Peña-Ayala A. (eds) Learning Analytics: Fundaments, Applications, and Trends. Studies in Systems, Decision and Control, vol 94. Springer, Cham. https://doi.org/10.1007/978-3-319-52977-6_1
- Lundberg, S.M., Erion, G., Chen, H., DeGrave, A., Prutkin, J.M., Nair, B., Katz, R., Himmelfarb, J., Bansal, N. and Lee, S.I., 2020. From local explanations to global understanding with explainable AI for trees. Nature machine intelligence, 2(1), pp.56-67.
- Maatuk, A.M., Elberkawi, E.K., Aljawarneh, S. et al. 2021. The COVID-19 pandemic and E-learning: challenges and opportunities from the perspective of students and instructors. J Comput High Educ (2021). https://doi.org/10.1007/s12528-021-09274-2
- Mubarak, AA, Cao, H, Zhang, W, Zhang, W. Visual analytics of video-clickstream data and prediction of learners' performance using deep learning models in MOOCs' courses. Comput Appl Eng Educ. 2021; 29: 710– 732. https://doi.org/10.1002/cae.22328
- Parkes, M., Stein, S., and Reading, C. 2015. Student preparedness for university e-learning environments. The Internet and Higher Education, 25: 1–10.
- Prensky, M. 2001. Digital natives, digital immigrants Part 1. On the Horizon, 9(5), 1-6.
- Riazy, S., Simbeck, K. and Schreck, V., 2020. Fairness in Learning Analytics: Student At-risk Prediction in Virtual Learning Environments. In CSEDU (1) (pp. 15-25).
- Smith, P. J., Murphy, K. L., and Mahoney, S. E. 2003. Towards identifying factors underlying readiness for online learning: An exploratory study. Distance Education, 24(1), 57–67. https://doi.org/10.1080/01587910303043
- Tempelaar, D. 2020. Supporting the less-adaptive student: the role of learning analytics, formative assessment and blended learning, Assessment & Evaluation in Higher Education, 45:4, 579-593, DOI: 10.1080/02602938.2019.1677855
- Thomas, P.S., Castro da Silva, B., Barto, A.G., Giguere, S., Brun, Y. and Brunskill, E., 2019. Preventing undesirable behavior of intelligent machines. Science, 366(6468), pp.999-1004.
- Umer, R., Susnjak, T., Mathrani, A. and Suriadi, S., 2017. On predicting academic performance with process mining in learning analytics. Journal of Research in Innovative Teaching & Learning.
- Watkins, R., Leigh, D., and Triner, D. 2004. Assessing readiness for e-learning. Performance Improvement Quarterly, 17(4), 66-79.
- Yusuf, B.N. and Ahmad, J., 2020. Are we prepared enough? A case study of challenges in online learning in a private higher learning institution during the Covid-19 outbreaks. Advances in Social Sciences Research Journal, 7(5), pp.205-21
APPENDIX
Questions | Response |
|---|---|
(Q1) Does your device have a webcam and/or a microphone that will work with Zoom for virtual office hours and Q&A sessions?” | 1 - Both webcam and microphone 2 - Only microphone |
(Q2) What type of device will you mainly use to access [online learning module] for [course name]?” | 1 - Desktop while on campus, plugin-bound laptop at home 2 - Laptop 3 - Desktop computer 4 - Tablet 5 - Chromebook |
(Q3) “Are you currently living in [city] with the same time zone?” | 1 - Yes 2 - No |
(Q4) “How prepared do you feel for online learning this semester?” | 1 (Not prepared at all) to 6 (Very prepared) |
Questions | Response |
|---|---|
(Q5.1) Please rate your level of confidence in the following assessment-related tasks: Creating new exam questions | 1- Not confident at all 2- Slightly confidence 3- Fairly confident 4-Completely confident |
(Q5.2) Creating authentic assessments | |
(Q5.3) Creating scoring tools (e.g., rubrics) | |
(Q5.4) Creating digital assessments | |
(Q5.6) Using a variety of assessment methods | |
(Q5.7) Fairness of your marking and grading | |
(Q5.8) Consistency of your marking/grading | |
(Q5.9) Speed of your marking and grading | |
(Q6) Which of the assessment-related concepts are you familiar with? | |
Performance score quantile | Odd(0.015) | Odd(0.025) | Odd(0.05) | LR | ||||
|---|---|---|---|---|---|---|---|---|
ACC. | F1 | ACC. | F1 | ACC. | F1 | ACC. | F1 | |
y>quantile(.10) | 0.43 | 0.57 | 0.59 | 0.74 | 0.58 | 0.71 | 0.91 | 0.95 |
y>quantile(.20) | 0.56 | 0.68 | 0.62 | 0.73 | 0.62 | 0.73 | 0.84 | 0.91 |
y>quantile(.30) | 0.42 | 0.50 | 0.42 | 0.49 | 0.33 | 0.54 | 0.78 | 0.86 |
y>quantile(.40) | 0.32 | 0.33 | 0.39 | 0.46 | 0.72 | 0.76 | 0.76 | 0.80 |
y>quantile(.50) | 0.36 | ]0.34 | 0.36 | 0.32 | 0.37 | 0.34 | 0.73 | 0.73 |
y>quantile(.60) | 0.44 | 0.29 | 0.52 | 0.52 | 0.42 | 0.22 | 0.75 | 0.67 |
y>quantile(.70) | 0.54 | 0.43 | 0.47 | 0.18 | 0.49 | 0.16 | 0.79 | 0.60 |
y>quantile(.80) | 0.57 | 0.09 | 0.42 | 0.35 | 0.44 | 0.27 | 0.84 | 0.49 |
y>quantile(.90) | 0.57 | 0.16 | 0.36 | 0.20 | 0.35 | 0.17 | 0.90 | 0.30 |
Unconstrained Model Features (Biased)
Constrained Model Features (Bias-reduced)
Feature 0 Feature 1 Feature 2 Feature 3 Feature 4 Feature 5 Feature 6 Feature 7 Feature 8 Feature 9 Feature 10 Feature 11 Feature 12 | Sequence frequency: [Assignment activities] Skewness of cumulative counts of the number of logs Cumulative mean of number of unique activities participated Percentile of number of unique activities Assignment 1 Submission Rank Quiz 2 Submission Rank Quiz submission average time difference Week 2 learning activities completion time difference Week 4 learning activities completion time difference Sequence frequency: [Lecture ⇒ Watch Video] Sequence frequency: [Learning Resources] Cumulative max of the number of unique events Entropy of overall learning activity participation |
© 2022 Copyright is held by the author(s). This work is distributed under the Creative Commons Attribution-NonCommercial-NoDerivatives 4.0 International (CC BY-NC-ND 4.0) license.