Undergraduate Courses
ABSTRACT
University students have a great deal of freedom in deciding the order in which to take their courses. In this paper we apply the Apriori-based Generalized Sequential Pattern (GSP) algorithm to undergraduate course data from a large university in order to identify frequent course sequences. Course sequencing results are primarily generated at the department level, with a special focus on Computer Science courses. This paper also introduces the course sequence flow diagram, which compactly represents a large amount of course sequencing information in an intuitive visual form. Our results and associated flow diagrams can help to answer a variety of important questions, such as: what course sequences are most common, how are courses between different departments ordered, and when are courses taken in an order that may contradict the advice given by academic advisors? In this paper we show that this form of descriptive data mining can identify standard core curriculum and pre-health sequences of study, as well as computer science courses that are either artificially pushed to the end of a student’s program of study or taken earlier than would be recommended.
Keywords
INTRODUCTION
The order in which university students take their courses is only partially constrained by course prerequisites and university policies. However, course sequencing is important since it impacts student learning and can impact student grades. This was demonstrated by one of our research group’s recent studies that looked at pairs of courses taken in both possible orderings and showed that the different orderings produced different grade performance [4]. Other work has looked at the sequences that courses in specific disciplines, such as communications [7] and psychology [2], are taken in, and assessed how these impact student learning. Some work looks more generally at course selection and how it impacts student grades [5] or time to graduation [6].
Prior work focuses mainly on assessing the impact of specific course sequences rather than on identifying or characterizing course sequences. This paper focuses on the descriptive data mining task of identifying common course sequences and how to best represent this information. These sequences are of intrinsic value, providing insight into how our curricula operate in practice. They can identify course prerequisite structures and interrelationships between departments. They can also expose courses taken in an unexpected, and perhaps inadvisable, order. These insights can be used to modify and improve academic advising and inform curricular changes, such as by modifying course prerequisites.
In this paper we use the Apriori-based Generalized Sequential Pattern (GSP) algorithm [9] to identify frequent k-sequences, where a k‑sequence contains k courses taken in a specific sequential order. We apply this method to courses at the department level and in some cases across departments. We show how these frequent k-sequences can be used to form a course sequence flow diagram that encapsulates the knowledge of many sequential patterns in a simple and useful visual form. We then show how the flow diagrams and associated results can be used to gain useful academic insights, which can inform academic advising and perhaps even changes to the curricula (e.g., modifications to prerequisites or course numbering). Our most detailed analysis focuses on the Computer Science department, building off our familiarity with our home department.
In Section 2 we describe the Apriori and GSP algorithms. Section 3 describes the course-enrollment data set provided by our university and the steps necessary to transform this data into the student-level course sequences suitable for mining by the GSP algorithm. In Section 4 we present our results in the form of frequent k-sequences, introduce the course sequence flow diagram, and extract insights from these results by utilizing our curricular domain knowledge. Section 5 provides our broader conclusions, study limitations, and plans for future work.
Sequence Mining
This paper extracts common course sequences from undergraduate course enrollment data. It relies on the generalized sequential pattern mining framework [9], which is an extension to the Apriori association rule mining algorithm that takes ordering into account. Whereas Apriori generates a set of frequent itemsets, GSP generates a set of frequent sequences, and, in the context of this study, a set of frequent course sequences. Minimum support is used analogously to its use in Apriori, so a specific sequence is considered frequent if it occurs in more than minsup sequences. We briefly introduce the well-known Apriori algorithm and then describe the GSP algorithm as an extension to Apriori.
The Apriori association rule mining algorithm [1] was developed to provide retailers with information about what items are usually purchased in the same transaction. Formally, let I = {I1, I2, I3, …, Id} be the distinct items and let T = {T1, T2, T3, …, Tn} be the set of customer transactions, where each Ti contains a subset of items in I. A k-itemset X is a collection of exactly k items:
X = {X1, X2, X3, …, Xk}, where Xi ∈ I ∀i, and |X| < d.
Given a set of transactions T, the support of a k-itemset is the fraction of the transactions T that contain all of the k items in the k‑itemset (e.g., if k=2 and the items are milk and cereal, then support is the fraction of transactions that contain milk and cereal). Association rule algorithms like Apriori [1] and FP‑growth [3] identify all frequent k-itemsets. These algorithms also include a second step that generates association rules from the itemsets, but our study does not need to generate rules, only frequent sequences, so we focus only on the first step.
The GSP algorithm [9] is a modest extension of the Apriori algorithm. The extension involves making the Apriori algorithm sensitive to the order of items (i.e., courses) in each transaction. There are two extensions that need to be made to the Apriori algorithm. The first is to extend the candidate generation phase to generate ordered itemsets and the second is to account for item ordering when computing the support for an itemset (i.e., sequence).
Methodology
This section describes our initial data set, how we transform this data into a form suitable for the GSP algorithm, and the impact of the minsup threshold on the resulting course sequences.
Initial Course-Enrollment Data Set
This study is based on eight years of undergraduate course enrollment data from Fordham University. Each entry in the initial data set represents the enrollment of a specific student in a course section, along with their grade in the course and the semester and year that they took the course. To preserve privacy the student identifiers were mapped to new, but consistent, values and course sections with fewer than five students were dropped. The data set contains 473,527 records that collectively cover 24,969 distinct students. For the purpose of this study all sections of the same course are considered equivalent. Even with these privacy protections we cannot share the course-enrollment data, due to strict privacy laws.
Student Course-Sequence Data Set
The initial data is not in the format expected by the GSP algorithm since it expects each entry to include an ordered sequence of courses. Thus we transform the initial data set into a student course-sequence data set by separating the courses for each student and then ordering these courses chronologically. Courses that are taken during the same semester are ordered lexicographically using the course identifier. Below is a sample course sequence record, which starts with the student-ID and is followed by five courses:
S245632: CS1000, CS2000, HIST1200, CS3462, CS2250
Applying GSP to Course-Sequence Data
When we run the GSP algorithm on course-sequence data at the departmental level, we restrict the data to only include sequences that contain students who take one or more courses from that department. This improves the algorithm’s running time without impacting the generated frequent k-sequences; however, it impacts minsup, if expressed as a fraction, since the denominator used to calculate support is reduced. To address this, and also account for the fact that different departments have different numbers of students (i.e., sequences), we express minsup as a minimum support count (an integer) rather than a minimum support (a fraction).
The GSP algorithm can be applied directly to the student course-sequence data set, where each entry corresponds to the ordered courses taken by one student. If minsup is set too low, the number of frequent sequences will explode exponentially, which will radically impact the running time of the algorithm and lead to an unwieldy number of frequent sequences. Experiments in Section 4 vary minsup to assess its impact on running time and on the number of frequent sequences.
RESULTS
This section includes our main results. Section 4.1 provides department level information about the number of frequent k‑sequences generated by the GSP algorithm, while Section 4.2 provides information on the running time of the algorithm. Section 4.3 examines the frequent sequences for the Computer Science (CS) department, introduces our course sequence flow diagram, and uses this diagram to provide insights into the sequencing of CS courses. The section concludes by analyzing some non-CS course sequences.
Summary Department Level Results
This section provides summary results of running the GSP algorithm on courses from individual STEM departments, combined Biology and Chemistry courses, and all undergraduate courses. By varying the number of courses considered we demonstrate its impact on the number of frequent sequences and running time. Table 1 shows the number of k-sequences generated for these groupings, for various values of k and minsup. Two entries are provided for each minsup value: one without pruning and one with pruning. The pruned results remove any frequent k-sequence contained (i.e., with the courses in the same relative order) within a larger frequent sequence, since this information can be considered redundant. Pruned entries have a “*” next to the minsup value. When generating frequent sequences from all undergraduate courses, much larger minsup values are employed to keep the running time manageable and to avoid generating more sequences than could be analyzed.
Number of k-sequences (k from 2 to 9) | |||||||||
|---|---|---|---|---|---|---|---|---|---|
Department | minsup | 2 | 3 | 4 | 5 | 6 | 7 | 8 | 9 |
CompSci | 50 | 151 | 223 | 132 | 23 | 1 | |||
50* | 56 | 111 | 97 | 21 | 1 | ||||
100 | 61 | 61 | 18 | 1 | |||||
100* | 61 | 61 | 18 | 1 | |||||
Chemistry | 50 | 101 | 289 | 408 | 224 | 48 | 4 | ||
50* | 9 | 44 | 178 | 152 | 40 | 4 | |||
100 | 20 | 7 | 1 | ||||||
100* | 12 | 4 | 1 | ||||||
Physics | 50 | 51 | 48 | 37 | 21 | 7 | 1 | ||
50* | 17 | 14 | 12 | 10 | 5 | 1 | |||
100 | 14 | 2 | |||||||
100* | 10 | 2 | |||||||
Biology | 50 | 91 | 148 | 96 | 25 | 1 | |||
50* | 22 | 61 | 59 | 23 | 1 | ||||
100 | 47 | 54 | 26 | 6 | |||||
100* | 14 | 24 | 16 | 5 | |||||
NatSci | 50 | 121 | 315 | 580 | 736 | 704 | 490 | 225 | 60 |
50* | 24 | 53 | 136 | 189 | 230 | 232 | 147 | 50 | |
100 | 70 | 124 | 131 | 86 | 34 | 4 | |||
100* | 15 | 31 | 44 | 43 | 27 | 4 | |||
Math | 50 | 111 | 177 | 79 | 6 | ||||
50* | 40 | 98 | 68 | 6 | |||||
100 | 68 | 34 | 1 | ||||||
100* | 35 | 32 | 1 | ||||||
Psychology | 50 | 241 | 250 | 48 | |||||
50* | 110 | 193 | 48 | ||||||
100 | 114 | 53 | 8 | ||||||
100* | 72 | 41 | 8 | ||||||
Bio+Chem | 50 | 278 | 899 | 1455 | 1272 | 694 | 235 | 38 | |
50* | 38 | 179 | 512 | 592 | 395 | 170 | 38 | ||
100 | 122 | 296 | 414 | 344 | 162 | 37 | 3 | ||
100* | 48 | 115 | 202 | 248 | 174 | 64 | 3 | ||
All | 500 | 919 | 1853 | 1792 | 1096 | 532 | 197 | 47 | 5 |
500* | 322 | 819 | 902 | 599 | 328 | 141 | 40 | ||
1000 | 292 | 416 | 160 | 6 | |||||
1000* | 105 | 238 | 148 | 6 | |||||
* frequent k-sequences that appear in frequent k+1 sequences are pruned
Table 1 shows that the number of k-sequences varies greatly by department. This variation is due in part to the varying number of students, and student majors, in each department, as well as the amount of sequencing in the curriculum. The largest k-sequence for each department varies from 4 to 10 (Natural Science has one 10‑sequence for minsup=25 that did not fit in the table). The number of k-sequences is also dramatically impacted by the minsup value, which indicates that care must be chosen in selecting this value. Adding additional courses can also have a large impact, as can be seen by comparing the individual Biology and Chemistry department entries with the combined Bio+Chem entry. The number of entries when using all courses would be enormous if we did not increase the minsup threshold by a factor of 10. The number of sequences that are pruned is more substantial for smaller sequences—a pruned itemset has a cascading effect as it trickles down to the lower levels (i.e., lower k values).
Run-time Complexity
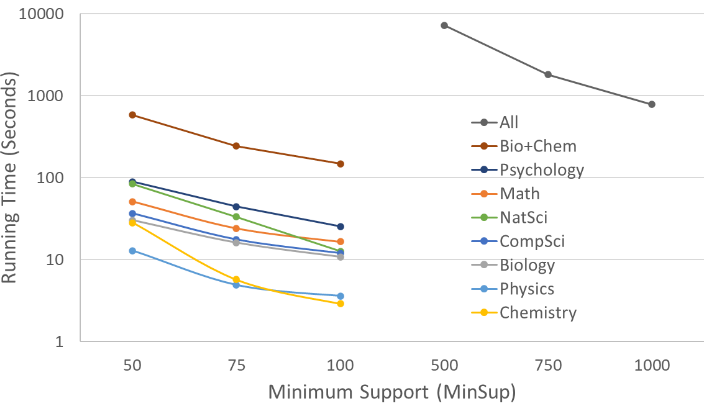
The running time of the GSP algorithm is affected by the number of items (distinct courses), the number of sequences to mine, and the number of items (i.e., courses) in each sequence. While worst case performance is exponential in the number of items/courses, the performance is generally much better, depending on the minsup value. If minsup is sufficiently low, the complexity can even be linear in the number of sequences. The time to generate the frequent course sequences for the same nine department groups appearing in Table 1, when run on a MacBook Air laptop with an 8-core 3.2GHz processor, is displayed in Figure 1. To make the figure easy to read the legend is ordered to match the running times associated with each department. Since the y-axis uses a log-scale, the running time is not actually linear. In order to keep the running time manageable, minsup starts at 500 when mining all courses— but as shown in Table 1, this still yields a much longer running time.
Detailed Analysis of Computer Science
This section looks into the detailed results for the CS department. In Section 4.3.1 we introduce our course sequence flow diagrams, which are capable of representing the information from a large number of frequent sequences in compact visual form. In Section 4.3.2 we then then use this diagram to better understand how students sequence their CS courses.
Course Sequence Flow Diagram
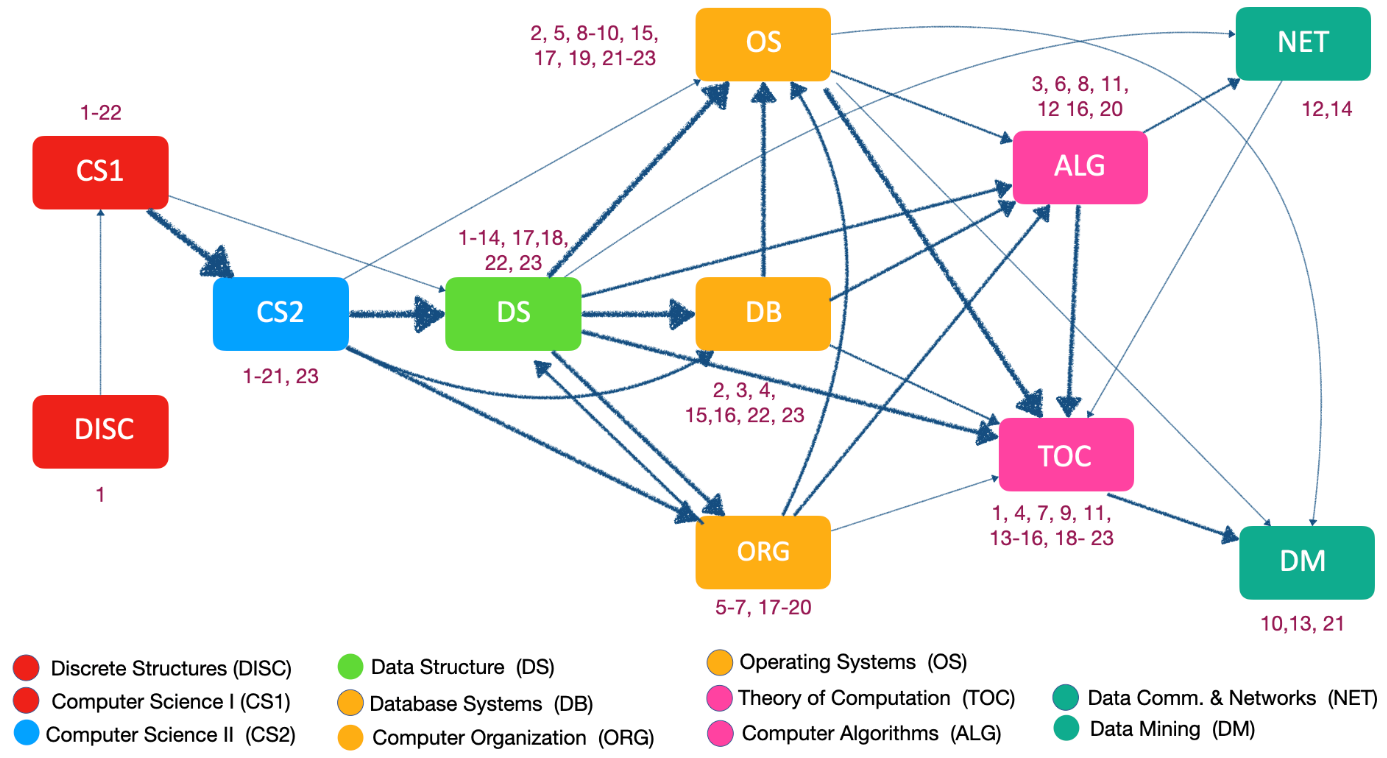
Many of the results for the department are summarized in Figure 2, which embodies the information within all twenty-three Computer Science 5-sequences (the 5-sequences are listed in Appendix Table 2). We focus on these since there is only one 6‑sequence and no larger sequences (see Table 1). Our course sequence flow diagram constitutes a substantial improvement upon previously existing sequencing visualization methods, such as Sankey diagrams [8]. We believe that our course sequence flow diagram is a significant contribution, preserving information across multiple sequences while conveying this information clearly and compactly.
Figure 2 contains all eleven courses that are represented in the 23 5-sequences in Table 2. Each sequence in Table 2 has an index, and each node in the Figure 2 is labeled with the matching index, so the 23 5-sequences can be reconstructed from the diagram. For example, if you follow the flow of all nodes in Figure 2 that contain index 1, you will reconstruct the first sequence in Table 2 (DISC, CS1, CS2, DS, TOC). The diagram actually goes much further, however, presenting support information for each sequence. Each of the 23 sequences has its own support; when sequences overlap, the corresponding supports are added together in the current flow diagram. Thus, we can determine the combined support associated with any edge in the diagram based on the summed supports assigned to that edge. Appendix Table 3 provides the underlying information about each pair of courses across the extracted sequences. To avoid overcrowding the diagram with information, we encode the support sum from each edge through varying thicknesses. The thickness level listed in Table 3 and utilized in Figure 2 is computed as follows:
Thickness =
Specific Insights into CS Based on Results
Figure 2 provides a succinct high level view of the flow of courses, which enables us to learn about how students sequence their courses. Given our experience with the undergraduate CS curriculum, we are able to verify known patterns in course sequences (first three bullet items) and glean new and potentially useful insights (last three bullet items). We summarize some of these as follows:
- The diagram recognizes the key prerequisite relationships including our introductory programming sequences of CS1 → CS2 → Data Structures (DS). These courses are connected with the thickest edges.
- Computer Organization is often taken after CS2 and Data Structures, which is what we recommend, but it is not required (it can be taken after CS1).
- The nodes in Figure 2 are arranged into 6 vertical columns based on the edges and relative position of the courses within the frequent sequences. These reflect the general structure and course levels quite well. For example, Discrete Structures and CS1 are 1000 level courses, CS2 and Data Structures are 2000 level courses, the courses in the next column are all 3000 level courses, etc. A few notable exceptions are discussed next.
- The position of Data Mining (DM) is surprising. Its only prerequisite is CS1, while Theory of Computation (TOC) has many prerequisites—yet Data Mining is generally taken after Theory of Computation. This may be an artifact of our assigning Data Mining as a 4000 level course even though our faculty believe that level is not appropriate.
- Theory of Computation is almost always taken after Algorithms (ALG), even though both are 4000-level courses with no prerequisite relationship. The observed sequencing could be an artifact of scheduling but may be related to student belief that the algorithms course is essential for obtaining employment, including internships. Relevant 2‑tuples show that ALG→TOC occurs 2.4 times as often as the reverse ordering.
- Database Systems (DB) is taken a bit later in the sequence than we would expect and perhaps recommend. It only requires CS1 but is taken after CS2 and Data Structures.
Analysis of Non-CS Departments
The dataset contains courses from dozens of departments. We lack the space and domain knowledge to analyze all of them, but we mine course sequences from several groupings of departments and provide a few observations in Table 2. With minsup = 500 we obtain five 9-sequences, all of which include only biology and chemistry courses, and four of the five sequences begin with the following eight courses:
IntroBio1+lab, GenChem1+lab, IntroBio2+lab, GenChem2+lab
These are the longest frequent sequences draw from across all departments. Half of the courses above are lab courses which count as separate courses but probably should be excluded to focus on more meaningful sequences (we removed all lab courses for Computer Science only). Nonetheless the algorithm was able to identify a very common science sequence taken by students planning to pursue medical school. If we start to look at smaller k-sequences, such as k=5, the highest levels of support are dominated by core requirements sequences. In general we see that science courses are more tightly sequenced than other courses, although for shorter sequences the more popular core courses play a central role.
Supp | Sequence |
|---|---|
500 | IntroBio1+lab, GenChem1+lab, IntroBio2+lab |
1000 | MacroEcon, BusinessMath, MicroEcon, EnglComp2, Business Calc |
1000 | EnglComp2, Philos1, Theology1, EnglLit, Philos2 |
1000 | EnglComp2, Theology1, EnglLit, Philos1, Philos2 |
1000 | Phil1, EngComp2, Philos1, EnglLit, Philos2 |
1000 | Theology1, EnglComp2, Philos1, EnglLit, Philos2 |
Due to their role in our university, we next consider results associated with core curriculum courses, which must be taken by all students, and span many departments. The five 6-sequences that appear with minsup =1000 provide insight into the most common ways in which the core courses are taken. The first two sequences are associated with science and business majors, respectively, who are directed to take those courses to fulfill their science, math, and social science core requirements; the last four are humanities courses taken by a wide range of students.
Given the Computer Science discipline has a close relationship with Mathematics, we also looked at the frequent sequences for the Math department. We were surprised to note that the last course in the sequence is very often Statistics, which we thought would be taken earlier, especially since courses with a higher number were sometimes taken first. But the department has the following long prerequisite sequence, which explains the observed behavior:
Calc1 → Calc 2 → Multivariable Calc → Probability → Statistics
Conclusion
This paper introduces GSP-based sequence mining for analyzing university course sequences. The method was applied to eight years of undergraduate course enrollment data and produced a large number of frequent k-sequences. Course sequences were generated for individual departments, several related departments, and across all departments. Our results show that it is possible to mine course sequences on a standard laptop given reasonable minsup values.
We also developed a new course sequence flow diagram that visually captures many different common course sequences, while maintaining almost all low level information. The development of this diagram is a significant contribution, superior to our prior efforts and to Sankey diagrams [8] available from existing libraries. The Computer Science course sequence flow diagram accurately represented well known course relationships and uncovered subtle sequencing issues. These insights can lead to improved advising and curriculum changes—suggesting course number updates to better reflect the role of the course or to modify student behavior to better align with sequencing intentions. Our analysis also provided insights into other course sequences and identified a long sequence taken by students in the pre-medical education track.
We believe that course sequencing mining can be a useful tool for academic advising and for better understanding how students sequence their courses. This work is an example of descriptive data mining; additional applications will likely be discovered in time.
REFERENCES
- Agrawal, R., and Srikant, R. 1994. Fast algorithms for mining association rules. In Proceedings of the 20th International Conference on Very Large Data Bases, VLDB, Vol. 1215, 487-499.
- Betancur, L., Rottman, B. M., Votruba-Drzal, E., and Schunn, C. 2019. Analytical assessment of course sequencing: The case of methodological courses in psychology. Journal of Educational Psychology, 111(1), 91.
- Borgelt, C. 2005. An Implementation of the FP-growth Algorithm. In Proceedings of the 1st International Workshop on Open Source Data Mining: Frequent Pattern Mining Implementations, 1-5.
- Gutenbrunner, T., Leeds, D.D., Ross, S., Riad-Zaky, M., and Weiss, G.M. 2021. Measuring the academic impact of course sequencing using student grade data. In Proceedings of The 14th International Conference on Educational Data Mining, International Educational Data Mining Society, Paris France, June 29-July 2, 799-803.
- Morsy. S., and Karypis, G. 2019. Will this course increase or decrease your GPA? Towards grade-aware course recommendation. Journal of Educational Data Mining, 11(2):20–46, 2019.
- Parks, M. R., Faw, M., and Goldsmith, D. 2011. Undergraduate instruction in empirical research methods in communication: Assessment and recommendations. Communication Education, 60, 406-421. DOI= 10.1080/03634523.2011.562909
- Richards, A. S. 2012. Course sequencing in the communication curriculum: A case study. Communication Education, 61(4), 395-427. DOI= 10.1080/03634523.2012.713500
- Schmidt, M. 2008. The Sankey diagram in energy and material flow management: part II: methodology and current applications. Journal of Industrial Ecology, 12(2), 173-185.
- Srikant, R., and Agrawal, R. 1996. Mining sequential patterns: Generalizations and performance improvements. In International conference on extending database technology, 1-17. Springer, Berlin, Heidelberg.
Appendix
Index | Computer Science Frequent 5-Sequence | Support | Index | Computer Science Frequent 5-Sequence | Support |
|---|---|---|---|---|---|
1 | Discrete Struct, CS1, CS2, Data Struct, Theory of Comp | 50 | 13 | CS1, CS2, Data Struct, Theory of Comp, Data Mining | 63 |
2 | CS1, CS2, Data Struct, Databases, Operating Sys | 67 | 14 | CS1, CS2, Data Struct, Data Comm and Net, Theory of Comp | 55 |
3 | CS1, CS2, Data Struct, Databases, Comp Alg | 60 | 15 | CS1, CS2, Databases, Operating Sys, Theory of Comp | 80 |
4 | CS1, CS2, Data Struct, Databases, Theory of Comp | 73 | 16 | CS1, CS2, Databases, Comp Alg, Theory of Comp | 58 |
5 | CS1, CS2, Data Struct, Comp Org, Operating Sys | 52 | 17 | CS1, CS2, Comp Org, Data Struct, Operating Sys | 54 |
6 | CS1, CS2, Data Struct, Comp Org, Comp Alg | 60 | 18 | CS1, CS2, Comp Org, Data Struct, Theory of Comp | 52 |
7 | CS1, CS2, Data Struct, Comp Org, Theory of Comp | 52 | 19 | CS1, CS2, Comp Org, Operating Sys, Theory of Comp | 73 |
8 | CS1CS1, CS2, Data Struct, Operating Sys, Comp Alg | 70 | 20 | CS1, CS2, Comp Org, Comp Alg, Theory of Comp | 59 |
9 | CS1, CS2, Data Struct, Operating Sys, Theory of Comp | 110 | 21 | CS1, CS2, Operating Sys, Theory of Comp, Data Mining | 50 |
10 | CS1, CS2, Data Struct, Operating Sys, Data Mining | 61 | 22 | CS1, Data Struct, Databases, Operating Sys, Theory of Comp | 56 |
11 | CS1, CS2, Data Struct, Comp Alg, Theory of Comp | 84 | 23 | CS2, Data Struct, Databases, Operating Sys, Theory of Comp | 56 |
12 | CS1, CS2, Data Struct, Comp Alg, Data Comm and Net | 55 |
C1→ C2 | Indices | Σ Support | Thickness | C1→ C2 | Indices | Σ Support | Thickness |
|---|---|---|---|---|---|---|---|
CS1→ CS2 | 1-21 | 1338 | 6 | DB→ALG | 3,16 | 118 | 3 |
CS2→ DS | 1-14, 23 | 968 | 6 | TOC→DM | 13,21 | 113 | 3 |
OS→ TOC | 9,15,19, 21-23 | 425 | 5 | ORG→DS | 17,18 | 106 | 3 |
DS→ DB | 2,3,4,22,23 | 312 | 5 | ALG→NET | 12 | 84 | 2 |
DS→ OS | 8-10,17 | 295 | 5 | DB→TOC | 4 | 73 | 2 |
DB→ OS | 2,15,22,23 | 259 | 4 | OS→ALG | 8 | 70 | 2 |
CS2→ ORG | 17-20 | 238 | 4 | OS→DM | 10 | 61 | 1 |
ALG→TOC | 11,16,20 | 201 | 4 | CS1→DS | 22 | 56 | 1 |
DS→TOC | 1,13,18 | 165 | 4 | DS→NET | 14 | 55 | 1 |
DS→ORG | 5--7 | 164 | 4 | NET→TOC | 14 | 55 | 1 |
CS2→DB | 15,16 | 138 | 3 | ORG→TOC | 7 | 52 | 1 |
DS→ALG | 11,12 | 139 | 3 | DISC→CS1 | 1 | 50 | 1 |
ORG→OS | 5,19 | 125 | 3 | CS2→OS | 21 | 50 | 1 |
ORG→ALG | 6,20 | 119 | 3 |
Table 3 shows CS1→ CS2 and CS2→ Data Structures have the two highest support sums; this is reflected in the edge-widths in Figure 2.
© 2022 Copyright is held by the author(s). This work is distributed under the Creative Commons Attribution-NonCommercial-NoDerivatives 4.0 International (CC BY-NC-ND 4.0) license.