ABSTRACT
Educational institutions rely on instructor assessment to determine course assignments, which instructors to retain or promote, and whom to provide with additional assistance or training. Instructor assessment is most commonly based on student surveys or peer evaluation—which are both subject to the evaluator’s personal biases. This study describes an assessment method based on future student grade performance, which has the potential to avoid these biases. This study is based on eight years of undergraduate course-grade data from over 24,000 students in a large metropolitan university. The methodology introduced in this paper accounts for confounding factors, such as diverse instructor grading policies and varying student abilities. Top and bottom performing instructors are identified for each course.
Keywords
INTRODUCTION
Assessing instructor effectiveness is important for determining which instructors to retain or promote, optimal assignment of courses, and providing additional mentorship or training to weak instructors [3, 8]. It is also often a key factor in tenure decisions. In a university, these assessments are typically done through student surveys or peer evaluations based on classroom observations [8]. Both of these methods are subject to the biases of the evaluators, which may be impacted by instructor gender and race, and may not measure student learning [1, 2, 5, 7]. The justification for using student surveys is derived from several studies in which positive correlations are found between student evaluations and instructor effectiveness as measured through exams at the end of each course. However, a recent meta-analysis conducted on thirty-two of these studies shows that there is no such positive correlation for the studies containing the most course sections, indicating earlier conclusions were due to a lack of data and providing argument against the use of student evaluations to measure instructor effectiveness [7]. These studies also measure instructor effectiveness using the grades for the course being taught. Given that the exams and grades are usually designed by the instructor, this yields another potential source of bias; our methods avoid this bias by relying on students’ performance in future courses. Peer evaluations are most likely subject to similar biases.
The method introduced in this paper assesses instructors by quantifying their impact on future student grade performance. If students with a given instructor perform better (worse) in future courses than students who have a different instructor, then the instructor is ranked favorably (unfavorably). Our study only assumes basic course-grade data is available, and does not account for all potential confounding factors, such as the time of day of the class or class size [9]. However, we do account for grade‑related factors such as instructor grading leniency and student ability as measured by grade-point average. We have developed a publicly available Python-based software tool that implements our methodology and generates the instructor effectiveness metrics [6].
Our study identifies instructors who appear to be much more or less effective than other instructors based on their student’s future performance. Our analysis first focuses on two case studies, assessing instructors of “Spanish 1” and “Computer Science 2” based on future performance in “Spanish 2” and “Data Structures,” respectively. We then identify the best instructors in the university based on the teaching of a single course, and then identify the top‑10 and bottom-10 instructors based on the performance over all courses each instructor teaches, with future student performance measured on all future courses taken within a single department. We discuss several interesting patterns across these results.
Student Course-Grade Data Set
The work presented in this paper is based on eight years of undergraduate course-grade data from Fordham University. Each record in the dataset represents a student earning a grade in a specific course section and includes the following fields: student identifier, instructor ID, course name, course number, course department, course term (semester and year), and student grade using a 0.0 (F) - 4.0 (A) scale. Table 1 provides key dataset statistics. In order to enhance privacy, student identifiers were remapped and data for course sections with fewer than five students were omitted. Even with such measures, due to federal regulations we are not permitted to publicly share the dataset.
Feature | Unique Values |
|---|---|
Record Number | 442,230 |
Student ID (SID) | 24,654 |
Instructor ID (IID) | 2,195 |
Course Name & Number | 2,505 |
Course Section | 21,504 |
Demographic information was not included in the data set as it could facilitate de‑anonymization. We therefore characterize the population using university statistics for the middle year of the data: gender distribution is 60% female and 40% male, and the racial/ethnic breakdown is 55% White, 14% Hispanic, 11% Asian, 7% International, 4% Black, and 9% other. The majority of students are between the ages of 17 and 22.
Measuring Instructor Benefit
This section describes the methodology used to calculate instructor benefit and introduces our three instructor benefit metrics. This methodology is implemented in a publicly available Python‑based software tool developed by our research group [6], which enables other researchers to apply our research to other student grade datasets. The steps used to generate our results are summarized in Figure 1 and described in subsequent subsections.
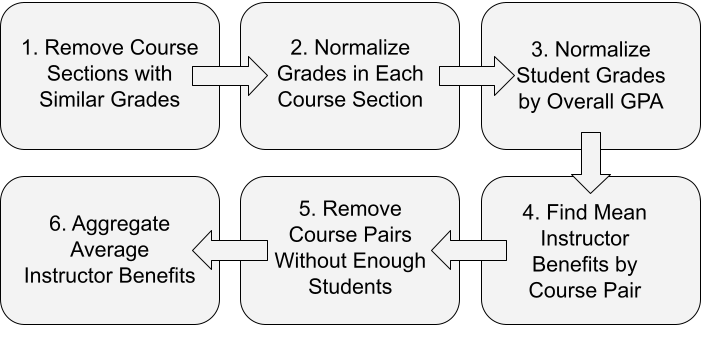
Remove Sections with Too Similar Grades
Differences in instructor effectiveness can only be measured if there is reasonable variance in the grades assigned to students. Thus we remove the data associated with course sections with very low grade variance. Step 1 computes the standard deviation of the grades in every course section and eliminates sections where the standard deviation is below MinSD. The distribution of grade standard-deviation values at the section level is provided in the Appendix, and Section 4 specifies the MinSD value of 0.2 that is used throughout this study.
Normalize Grades in each Section
To account for different instructor grading schemes, we employ z‑score normalization for each course section. The Level-1 normalized score, defined below, tells us how many standard deviations away from the course section mean a student scores.
In this formula, is the normalized course grade for student SID in the specified course section CrsSec, is the original grade for student SID in CrsSec, and and are the mean and standard deviation of the grades in CrsSec. Instructor benefits calculated using this Level-1 normalized grade are referred to as L1 Instructor Benefits. Instructor benefits calculated using the unnormalized grades are referred to as Grade Benefits (although they can be viewed as Level-0 Instructor Benefits).
Normalize Grades by Overall Performance
Student performance is not just dependent on the effectiveness of the instructor but also depends on a student’s abilities. We therefore employ a second level of grade normalization that is based on the student’s overall performance in all of their courses (i.e., GPA). Without this normalization, an instructor that coincidentally is assigned high-performing students will appear to perform better than an instructor that is assigned weaker students. This Level-2 normalization is defined by the formula below and L2 Instructor Benefits are calculated using these values.
In this formula, is the Level-2 normalized grade of student SID in course section CrsSec, is the Level-1 normalized score from the prior step, and and are the mean and standard deviation of student SID’s L1-normalized grades across all courses.
Find Instructor Benefit by Course Pair
We next consider every ordered course pair, C1 → C2, where course C1 is taken prior to course C2. Assume that the instructor for C1 has an instructor ID, IID. The instructor benefit associated with instructor IID teaching C1 based on C2 performance is computed using the C2 grades for those students who previously had instructor IID for C1. The type of C2 grade (unnormalized, L1-normalized, L2‑normalized) determines the type of Instructor Benefit (Grade, L1, L2). The calculations just described are aggregated over all sections for a given course. More formally, is the instructor benefit (IB) for students taking C2 after taking C1 with instructor IID.
In this formula, is any course section of course C2, SID is every student who took course C1 with instructor IID, and is the average of all values in x.
is computed for all ordered course pairs
Remove Course Pairs with Few Students
Instructor effectiveness is computed for pairs C1 → C2. For the resulting instructor effectiveness metrics to be reliable, the instructor will need to have taught at least MinStudents in C1 who subsequently completed C2. However, since this is a comparative statistic, we also require that there are MinStudents who completed C1 with other instructors and then completed C2 (hence if MinStudents = 50 there must be at least 100 students that took C1 and then completed C2). Section 4 explores how the MinStudents threshold impacts the number of available course pairs.
Aggregate Average Instructor Benefits
Course-pair level instructor benefit metrics are aggregated to yield higher level views of instructor performance. The instructor benefit values for each
The computation is performed across all relevant course pairs in the department , where is an instructor benefit from C1 to C2, is the number of students who took the instructor in that particular course pairing, and is the number of students who took a course with instructor IID (summed over all possible courses CX). The formula above can be used to find, amongst other things, the instructor effectiveness scores for a Computer Science instructor when evaluated on future Math classes, as well as when evaluated on future Computer Science classes (i.e., when D1 = D2).
Threshold Sensitivity Analysis
We selected appropriate thresholds for MinSD, the minimum standard deviation of section grades, and MinStudents, the minimum number of students in each course pair. The Appendix provides additional relevant information related to the selection of these thresholds. We select MinSD=0.2, retaining most (20,904 of 21,504) course sections while ensuring some variability in student grades, and MinStudents=50, to keep a large number of course pairs while maintaining reliability of the instructor benefit metrics.
RESULTS
This section provides our instructor benefit results. Section 5.1 and Section 5.2 provide results at the course-pair level, while Section 5.3 identifies the top and bottom performing instructors based on their performance across all courses in a department. Grade Benefit, Level-1 Benefit, and Level-2 Benefit metrics are all provided, with a focus on Level-2 Instructor Benefits.
Section Level Course-Pair Results
This section provides results at the course-pair level. Due to space limitations we can only provide instructor benefit results for instructors teaching Spanish 1 based on future student performance in Spanish 2 and for instructors teaching Computer Science 2 (CS2) based on future performance in Data Structures. We include the Spanish courses because they are popular and Computer Science courses because they are offered by our home department and there is great interest in Computer Science education. In both cases, the course pairs are part of a common introductory sequence, and the second course directly follows the first course.
Instructor | Sections | Total # Students | Instructor Benefit | |||||
|---|---|---|---|---|---|---|---|---|
ID | Taught | Spanish 1 | Spanish 2 | Grade | Level 1 | Level 2 | ||
F980 | 22 | 381 | 325 | -0.024 | 0.016 | 0.050 | ||
F494 | 17 | 367 | 295 | -0.189 | -0.091 | -0.090 | ||
F787 | 12 | 217 | 166 | -0.154 | -0.079 | -0.210 | ||
F424 | 11 | 231 | 191 | -0.278 | -0.259 | -0.146 | ||
F425 | 11 | 213 | 171 | 0.034 | -0.076 | -0.097 | ||
F819 | 10 | 201 | 176 | 0.050 | 0.124 | 0.233 | ||
F883 | 9 | 154 | 129 | 0.030 | -0.039 | 0.065 | ||
F719 | 8 | 179 | 134 | 0.090 | 0.076 | 0.147 | ||
F890 | 7 | 172 | 138 | -0.097 | -0.009 | -0.282 | ||
F541 | 7 | 86 | 67 | 0.061 | 0.045 | -0.219 | ||
All | 189 | 3485 | 2644 | -0.088 | -0.092 | -0.073 | ||
The results for the Spanish classes are summarized in Table 2. Sections where fewer than five students continue to Spanish 2 are excluded to allow section-level instructor benefit values to be reliable for statistical analyses. Due to space limitations, instructors with fewer than seven sections are not listed but are included in the summary statistics in the last row.
Our analysis focuses on Level 2 instructor benefit because it accounts for the two confounding factors discussed earlier, but Figure 2 shows that the three metrics are generally correlated, and the Pearson correlation coefficient (ρ) using the 189 section level values confirms this with ρ=0.74 between the Grade and Level-1 metric and ρ=0.76 between the Level-1 and Level-2 metric.
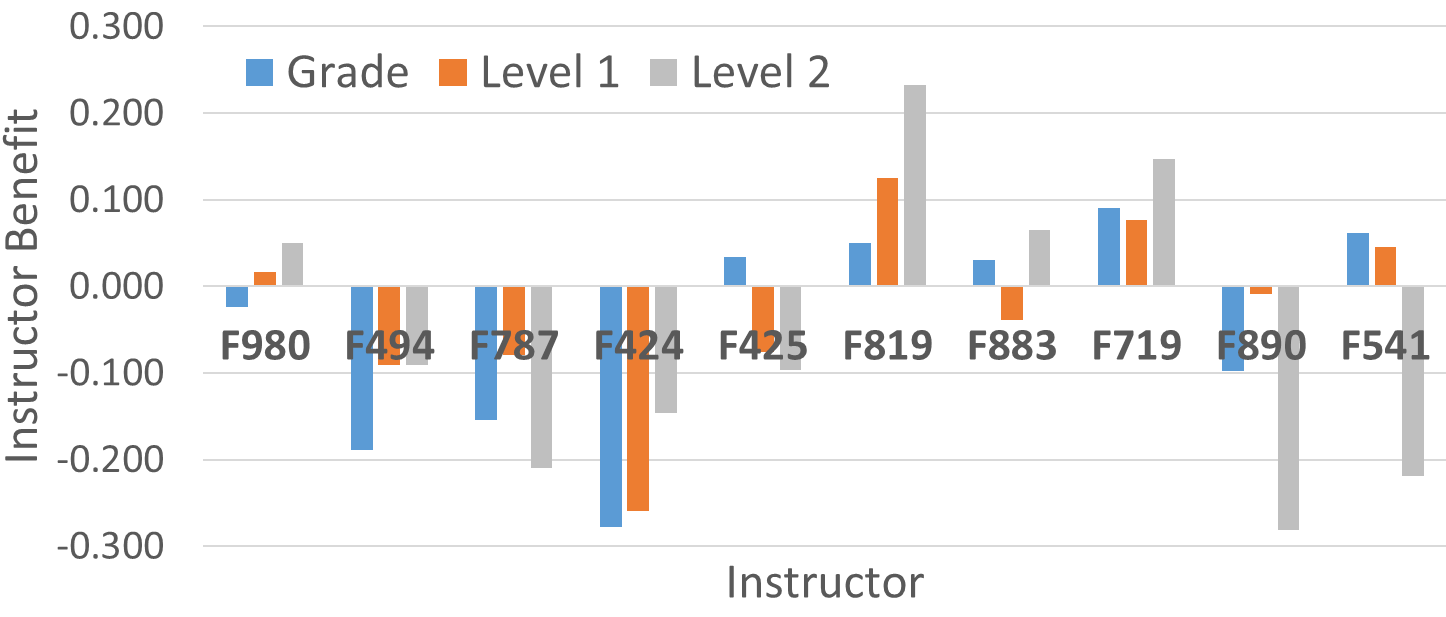
Table 2 and Figure 2 show that there are substantial differences in the Level-2 values since they vary from +0.233 to -0.282. Small differences in instructor ability may be hard to distinguish, so in this initial study, we focus on cases with the largest differences and where the values are based on many students. Given this, we conclude that instructor F819 is highly effective, while F890, F541, and F787 are least effective. A two-sample unequal variance t-test at the section level for Instructor F819 (+0.283) and F787 (‑0.210) yields p=0.0156 for the one-tailed distribution and p=0.0312 for the two-tailed distribution. These p-values suggest that the differences are statistically significant, although this is partially due to comparing instructors at the two extremes. More students would make more refined assessments possible.
Table 3 provides analogous results for the
Instructor | Sections | Total # Students | Instructor Benefit | |||||
|---|---|---|---|---|---|---|---|---|
ID | Taught | CS2 | DataStr. | Grade | Level 1 | Level 2 | ||
F212 | 12 | 293 | 158 | -0.304 | -0.226 | -0.189 | ||
F177 | 4 | 92 | 62 | 0.237 | 0.151 | 0.396 | ||
F589 | 3 | 56 | 36 | -0.329 | -0.177 | -0.228 | ||
F653 | 3 | 35 | 33 | -0.385 | -0.042 | 0.400 | ||
All | 32 | 697 | 410 | -0.227 | -0.145 | -0.054 | ||
The section level results suggest that it is possible to distinguish between high and low-performing instructors when using future student performance in a single highly related course. It may be difficult to reliably assess less extreme differences, but universities with larger classes or higher teaching loads should be better able to perform more refined assessments.
Global Course-Pair Instructor Results
Table 4 provides the best Level 2 Instructor Benefit results at the course-pair level. The course pairs are restricted to the same department or between departments that share major requirements, since it is best to measure instructor effectiveness using related courses. The results are based on MinSD=0.2 and MinStudents=50. Each entry in Table 4 corresponds to a single instructor. Course names are abbreviated using department codes and course numbers, but the full names are provided in our discussion.
Course1 | Course2 | Grade Benefit | Level 1 Benefit | Level 2 Benefit |
|---|---|---|---|---|
Chem 211 | Bio 342 | 0.11 | 0.09 | 1.50 |
Econ 220 | Econ 332 | 0.53 | 0.50 | 1.12 |
Phys 140 | Chem 121 | 0.24 | 0.43 | 0.79 |
Chem 121 | Chem 212 | 0.14 | 0.22 | 0.76 |
NatSci 304 | NatSci 321 | 0.44 | 0.48 | 0.75 |
Comm 112 | Comm 242 | 0.41 | 0.38 | 0.72 |
The courses pairs that appear in Table 4 exhibit a strong relationship between Course 1 and Course 2. For example, the first row involves “Organic Chemistry Lab” and “Biochemistry,” while the two Natural Science courses correspond to “Organic Chemistry I Lab” and “Organic Chemistry II.” Our belief is that the instructor associated with each entry is a very effective instructor, although, as discussed in Section 6, we cannot validate this. The Grade and L1 Benefit values are rarely as high as the L2 Benefit values, which indicates that the second round of normalization has a substantial impact. Note that students who take Econ 220, with the instructor represented by that entry, obtain a grade that is, on average, 0.53 higher than otherwise expected; this corresponds to a difference of more than a half letter grade.
Department Level Instructor Results
This section describes the aggregate effectiveness of an instructor (, as defined in Section 3.6.) based on all courses that instructor teaches in one department, measured by student success in future courses in one (potentially different) department. We consider these results to be less meaningful than results on course-pairs selected for mutual relevance. Nonetheless, some interesting high level observations arise. The results in Table 5 include the top and bottom performing instructors using MinStudents=50 and MinSD=0.2. Each entry corresponds to a single instructor.
Course 1 | Course 2 | Instructor Benefit | ||
|---|---|---|---|---|
Department | Department | Grade | Level 1 | Level 2 |
Top 10 Instructors | ||||
Political Sci. | Natural Science | 0.317(8) | 0.340(3) | 0.588 |
Mathematics | Mathematics | 0.033 | 0.242(8) | 0.570 |
Economics | Theology | 0.140 | 0.136 | 0.546 |
Economics | Theology | -0.127 | -0.035 | 0.525 |
Italian | Physics | 0.131 | 0.225 | 0.510 |
Art History | Spanish | 0.314(9) | 0.260(6) | 0.503 |
Philosophy | Communications | 0.296 | 0.350(2) | 0.502 |
Mathematics | Chemistry | 0.063 | 0.103 | 0.497 |
Natural Science | English | 0.267 | 0.237(9) | 0.488 |
Physics | Political Science | 0.233 | 0.009 | 0.465 |
Bottom 10 Instructors | ||||
Mathematics | Mathematics | 0.163 | -0.033 | -0.585 |
Mathematics | Mathematics | -0.182 | -0.131 | -0.563 |
Physics | Physics | 0.154 | -0.075 | -0.511 |
Sociology | Physics | 0.107 | -0.066 | -0.476 |
Natural Science | English | -0.228 | -0.203 | -0.463 |
Visual Arts | Anthropology | -0.209 | -0.072 | -0.422 |
Natural Science | Natural Science | -0.475(1) | -0.372(3) | -0.416 |
Chemistry | Biology | -0.342(8) | -0.443(1) | -0.415 |
Comp. Science | Physics | 0.304 | -0.185 | -0.411 |
Mathematics | Natural Science | 0.085 | -0.042 | -0.406 |
The instructor benefits in Table 5 indicate that there is a substantial difference between the top and bottom performing instructors. Many unnormalized grade differences are about 0.3, representing one-third of a letter grade difference. The values for the three effectiveness metrics appear correlated. To verify this we computed the Pearson correlation ρ between all three pairs of metrics, with the following results: ρ(Grade, Level 1) = 0.977, ρ(Grade, Level 2) = 0.990, ρ (Level 1, Level 2) = 0.989. These correlations are higher than in the prior section, showing a difference through aggregation over many sections and courses. For comparison, when the Grade or Level 1 benefit metric appears in the top-10 or bottom-10 for the listed instructor entry, we provide the rank in parentheses as a superscript (e.g., the instructor in the first row of data has the third highest Level‑1 Benefit). The ranks are not needed for Level 2 Benefits since they are already in rank order.
We generally would expect that instructor effectiveness in a course will have the biggest impact on other courses in the same discipline. Many of the entries do involve the same department or related departments, but quite a few do not. There is much more agreement between the departments for the bottom 10 instructors, seeming to indicate weak instructors fail to convey field-specific concepts for future use, while strong instructors may convey broader skills useful across disciplines. We note that STEM (Science, Technology, Engineering, and Math) instructors account for 80% of the bottom performing instructors but only 40% of the top performing instructors, which is plausible given that STEM graduate programs generally provide little pedagogy instruction.
CONCLUSION
Bias in student and peer evaluations of instructor effectiveness have been widely observed [1, 2, 5, 7], supporting the need for more objective assessment methods. This study presents an alternative method for instructor evaluation based on student performance in future courses. Our study accounts for instructor grading leniency and overall student ability; these factors impact assessment, but all three metrics are nonetheless highly correlated.
Instructor assessment appears most appropriate at the course level and provides most insight when considering future performance in a single, highly related course. We focused on instructor performance for Spanish 1 and CS2, based on future student performance in Spanish 2 and Data Structures, respectively. In both cases, instructor benefit varied substantially and the Level 2 instructor benefit for instructors at these two extremes differed with reasonable levels of statistical confidence. Our methodology distinguishes between instructors and identifies high and low performing instructors. Evaluation of single instructors across courses was less clear, but revealed patterns, such as the weakest instructors often being associated with STEM disciplines.
The methodology and metrics described in this paper are calculated from traditional student course-grade data using a publicly available Python-based tool developed by our research group [6]. This tool can be used by other researchers and practitioners to extend our analysis to other educational institutions. We plan to improve the tool’s documentation and usability in the near future.
There are numerous areas for further work. Increasing the size of our data set would substantially strengthen future analysis, especially within our Computer Science department. Effects of instructor rank, title, years of experience, gender, and race also would be valuable to study. Furthermore, we aim to identify further discipline-based patterns, such as differences in instructor effectiveness distributions across departments.
The most fundamental limitation of this work relates to validation. Currently we only perform limited validation across course sections. Additional validation will inherently be limited since there is no way to assess the “ground truth.” Still, we aim to measure the relationship with weaker metrics like student survey results.
REFERENCES
- Boring, A., Ottoboni, K., and Stark, P.B. 2016. Student evaluations of teaching (mostly) do not measure teaching effectiveness. Science Open Research. DOI= https://doi.org/10.14293/S2199-1006.1.SOR-EDU.AETBZC.v1 .
- Chávez, K., Mitchell, K. 2020. Exploring bias in student evaluations: Gender, race, and ethnicity. PS: Political Science & Politics, 53(2), 270-274. DOI= https://doi.org/10.1017/S1049096519001744.
- Goldhaber, Dan. 2015. Teacher effectiveness research and the evolution of U.S. teacher policy. The George W. Bush Institute. https://files.eric.ed.gov/fulltext/ED560206.pdf.
- Leeds, D.D. Zhang, T., and Weiss, G.M. 2021.Mining course groupings using academic performance. In Proceedings of The 14th International Conference on Educational Data Mining, International Educational Data Mining Society, Paris France, June 29-July 2, 804-808.
- Lilienfeld, E. 2016. How student evaluations are skewed against women and minority professors. The Century Foundation. https://tcf.org/content/commentary/student-evaluations-skewed-women-minority-professors.
- Riad-Zaky, M., Weiss, G.M., and Leeds, D.D. 2022. Course Grade Analytics with Networks (CGAN) [computer software], available https://www.cis.fordham.edu/edmlab/software.
- Uttl, B., White, A. C., and Gonzalez, D. W. 2017. Meta-analysis of faculty’s teaching effectiveness: Student Evaluation of teaching ratings and student learning are not related. Studies in Educational Evaluation., 54, 22-42. DOI= https://doi.org/10.1016/j.stueduc.2016.08.007.
- Vlieger, P., Jacob, B., Stange, K. 2016. Measuring instructor effectiveness in higher education. National Bureau of Economic Research. https://www.nber.org/papers/w22998.
- Wachtel, H.K. 1998. Student evaluation of college teaching effectiveness: a brief review, Assessment & Evaluation in Higher Education, 23:2, 191-212. DOI= https://doi.org/10.1080/0260293980230207.
APPENDIX
This appendix provides additional information related to the two thresholds that were discussed in Section 4. The relevant underlying data distributions are shown, which inform the choice of specific threshold values.
Figure 3 shows the distribution of the standard deviation values for grades at the course section level. There are quite a few sections with grade standard deviation near zero, most likely due to small project-based courses, where instructors often assign grades of “A”. As discussed in Section 3.1, sections with grade standard deviations below MinSD are removed since student performance cannot be effectively measured in such cases. Threshold values of 0.1, 0.2, 0.3, 0.4, and 0.5, were evaluated before a MinSD value of 0.2 was selected; that value was selected because it ensures a reasonable level of variance in the course grades while retaining most of the course sections.
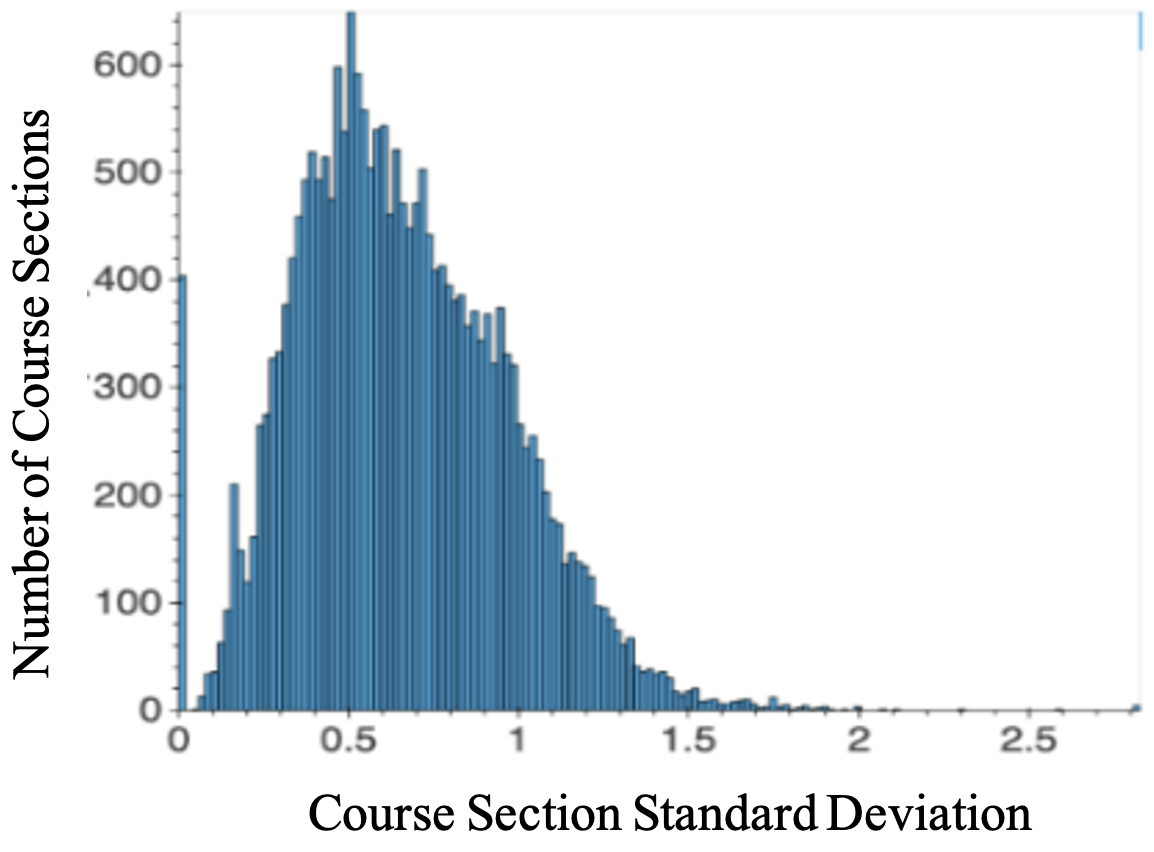
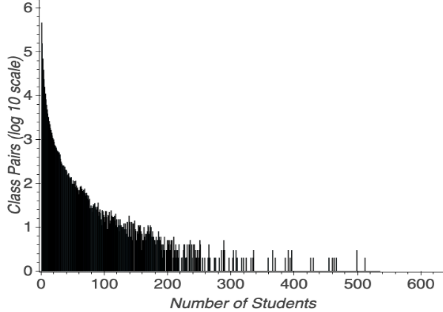
Figure 4 shows how the number of course pairs vary, in log scale, based on the number of students in the course pair. This number is based on the students in the first course in the pair taught by a particular instructor. The figure is used to help select the MinStudents threshold defined in Section 3.5, which removes course pairs with too few students. Most pairings have less than 100 students, even though course pairs are aggregated over all relevant course sections; this occurs because many course pairs involve disparate courses in different disciplines. Our results are based on MinStudents=50. A larger threshold would increase the reliability of our instructor benefit scores but eliminate too many course pairs.
© 2022 Copyright is held by the author(s). This work is distributed under the Creative Commons Attribution-NonCommercial-NoDerivatives 4.0 International (CC BY-NC-ND 4.0) license.