ABSTRACT
The number of unfilled jobs in Science, Technology, Engineering and Mathematics (STEM) is predicted to rise while young people’s interest in STEM careers and education is declining. Efforts to understand this decline have identified some potentially contributing factors based on statistical correlation analysis. However, these correlations can sometimes have relatively low effect-sizes. In these cases, Machine Learning (ML) techniques may provide an alternative by uncovering more complex patterns that provide stronger predictive accuracy. In this pilot study of Irish school children aged 9-13, supervised ML techniques were applied to model interest in pursuing education and careers in STEM fields. Despite the rather low coefficients from Pearson Correlation, the ML techniques were able to predict an individual’s interest in STEM careers and education with accuracies of 72.79% and 79.88% respectively. Our results suggest that ML techniques could be an important tool in understanding young people’s interest in STEM careers and education by providing models that derive more complex relationships.
Keywords
Introduction
The importance of Science, Technology, Engineering and Mathematics (STEM) skills is increasing, both in our everyday lives and in the demands on our future workforce [5]. Meanwhile, current educational systems are unable to keep up with this increasing demand; STEM courses tend to suffer from high drop-out rates [17] and only around half of STEM students go on to pursue STEM careers [3]. Coupled with a decrease in young people’s interest in STEM [1, 6, 7], concerns have been raised about the increasing skill-gap; the STEM Education Policy Statement 2017–2026 from the Irish Department of Further and Higher Education, Research, Innovation and Science [5] highlights both the economic and personal consequences in a world that relies on modern technologies.
An important part of addressing this skill shortage is to understand the underlying factors that drive young people’s interest in STEM fields. Previous studies have employed statistical techniques to identify correlated attributes, including the student’s gender, grades and school experience [4], their self-efficacy scores [11, 20] and affective stereotypical values about STEM major choices [20]; external factors included parents’ education and STEM knowledge [9, 20], as well as their teacher’s knowledge about STEM [20].
While traditional statistical techniques can provide valuable insights, these techniques are not always sufficient to establish strong correlations, e.g. the Pearson Correlation coefficient for individual attributes may be relatively low in relation to the target variable. Supervised Machine Learning (ML) techniques may offer a solution to this, by modelling complex patterns in the data through more advanced mapping functions that predict the outcome variable.
In this pilot study, five traditional ML algorithms – Logistic Regression, k-Nearest Neighbour, Decision Trees, naïve Bayes and Support Vector Machines (SVM) – were applied to predict interest in STEM careers and education among Irish school children aged 9-13. Further, an epilogue experiment was carried out using a Neural Network (Deep Learning) model, to assess whether this may offer additional benefits over the traditional ML techniques.
The code for the experiments is made publicly available online:
Dataset
The data used in this study consist of a sub-set of answers collected during 2020 through an online survey directed at Irish primary school children. Participants were recruited from a random selection of primary schools on the Irish government's list of national schools. Consent was obtained from parents by providing a consent form via email, to comply with the COVID-19 stay-at-home orders at the time; the filled-out forms were collected by teachers and either emailed back as scanned copies or posted as hard copies.
From the survey’s 48 questions, two yes/no questions were selected as target variables: “I would like to study STEM in the future” and “I am interested in a career in STEM” (referred to as Career in STEM and Study STEM). 36 of the remaining 46 questions were considered as potential independent variables. (These 38 questions, along with their answer types, are listed in Table 3 in the Appendix.) Out of the 309 participants who filled out the survey, 255 (82.5%) answered all 38 questions of interest. Future surveys will include validation to prevent missing data, and introduce options such as “Don’t know” or “Not applicable” for all relevant questions. For this study, incomplete instances were not included in the analysis. Gender balance and target variable class balances were measured before and after to ensure no bias was introduced with respect to these factors. Proportions remained highly similar, with 40.1% female before and 40.8% after, with interest in Career in STEM changing from 49.5% positive to 49.4%, and Study STEM changing from 69.6% positive to 70.2%.
Data Preparation
Two datasets were constructed, each including one of the two target variables (Careers in STEM and Study STEM) along with a subset of the 36 potential independent attributes. The two subsets of the independent variables were selected based on statistical correlation between each attribute and each of the target variables. The reasoning behind this, was to reduce the number of noisy attributes. This initial sub-selection can work well even when the correlation magnitude is relatively low as it still helps to filter out those with very low or no correlation. In this study, Pearson Correlation (PC) and Multiple Regression Analysis (MRA) were employed, which are typical techniques for this purpose. Both techniques were applied independently, so that if two different sets of attributes were identified, each set could be used for developing a separate model. Cut-off values for attribute selection were determined by visually examining bar charts of the ordered absolute coefficients for PC and MRA respectively; the selected cut-off values were based on attribute grouping and the elbow method. Future work will include a more comprehensive analysis of the attribute selection step by including additional considerations, such as p-values.
For the Career in STEM dataset, the selected cut-off values for PC and MRA were 0.2 and 10.00 respectively. Both methods produced the same ten attributes (although the order was different):
- Age
- County
- Do you have family in STEM?
- I am good at projects involving Science Technology Engineering and Maths.
- I would like to participate in more after-school programs in Science Technology.
- Confident to problem solve.
- Confident to do science tasks.
- Homework in Science Technology Engineering and Maths is easy.
- Science Technology Engineering and Math is important.
- On average, how long, per day, do you spend using technology at home?
For Study STEM, PC and MRA both produced the same set of 8 attributes with a threshold of 0.21 and 10.73 respectively:
- Age
- Confident to problem solve.
- Confident to do science tasks.
- Confident to use technology in schoolwork.
- I am good at projects involving Science Technology Engineering and Maths.
- Homework in Science Technology Engineering and Maths is easy.
- I would like to participate in more after-school programs in Science Technology.
- Science Technology Engineering and Math is important.
The cut-off point for the Study STEM data was more ambiguous than for the Career in STEM data. To avoid omitting two potentially beneficial borderline attributes, two separate datasets were constructed: Study STEM A which only includes the top 8 attributes, and Study STEM B which includes two additional attributes based on lowering the thresholds for PC and MRA to 0.18 and 7.83 respectively. These attributes were:
- Do you have family in STEM?
- I am good at using technology and completing coding tasks.
Following the attribute selection process, each selected attribute was assessed for outliers by examining the range and spread of values using standard deviation. No significant outliers or unexpected values were identified.
Machine Learning Techniques
The Machine Learning (ML) investigations of this study were implemented in Python 3.7, using the Scikit-learn[1] v1.0.2 library for the traditional ML algorithms, and TensorFlow[2] v2.1 for the epilogue Deep Learning experiment. All code was run on a PC with an Intel Core i9 CPU, 32GB RAM and NVIDIA RTX 2070 Super GPU with 8GB RAM. The following sections briefly discuss each algorithm and how they make predictions about a binary class label.
Logistic Regression
Logistic Regression (LR) is used to predict the binary class label of a data point by estimating the probability of the positive class based on a set of attributes, without having to meet requirements regarding normal distribution or homogeneity of variance [2]. LR can model non-linear relationship between one or more attributes and the class label, according to the following equations:
where are the learned model weights, is a single attribute and is the number of attributes. denotes the probability of the positive class, with resulting in a positive prediction.
k-Nearest Neighbour
k-Nearest Neighbour (k-NN) is used to predict the class label for a new data point based on the class label of known data points that have similar attributes to the new data point. The model selects the k closest neighbours (based on a chosen distance metric) and predicts the class label by majority voting [10, 14]. In this study, a value of k=3 was used along with the Euclidean distance.
Naïve Bayes
Naïve Bayes is based on the Bayes Theorem, which is given by . This assumes the interdependence between all attributes in the term whose calculation becomes intractable in practice. Hence, a simplified version, known as naïve Bayes, is often used where is assumed to be constant and the attributes are assumed to be conditionally independent. In practice, it has been shown to provide strong predictive performance even when this assumption is violated [13, 14]. For a binary classification task, the probability of the positive class is given by where is the prior probability of class .
Decision Trees
Decision Trees provide class predictions through a tree-like flowchart where the next branch is selected based on the value of a single attribute. The cut-off points for the attribute values of these branches are decided based on the optimal splitting of the training data into class labels. Once a leaf-node is reached (i.e. no further branching), a class label is assigned based on the majority class of the training data points that were routed to that node [10, 14]. In this study, binary branching was used based on a measure called GINI Gain which aims to reduce the GINI Impurity calculated by where denotes the probability of each class label.
Support Vector Machines
Support Vector Machines (SVM) is a class of algorithms that generates a discriminant function to separate the data points belonging to each class label. The SVM used in this study is a linear SVM that uses Sequential Minimal Optimization [16]. This algorithm is grounded in principles of the optimal hyperplane from statistical learning theory [19]. The optimal hyperplane is found by maximising the perpendicular distance between the closest vector to the hyperplane and the hyperplane itself [8]. Given a dataset where each has been sampled from some space , the optimal hyperplane can be found by solving the dual-form Lagrangian, which is subject to the constraints and :
Evaluation and Metrics
To promote generalisable model results, 10-fold cross-validation (10FCV) is considered the gold standard validation techniques for these ML algorithms [10]. 10FCV randomly splits the dataset into (as near as possible) equally sized folds; any number of folds can be chosen, with 10 being the typical number. Training is performed on data from all folds except one which is left for evaluation (i.e. the unseen data), and this process is repeated until the algorithm has been trained and evaluated on each fold. The result from each fold’s evaluation are averaged to obtain the final result. Thus, all data is considered for evaluation, while at the same time ensuring that test data is never seen during training. This reduces the risk of both under- and overfitting to the data [10].
The metrics used for this study were sensitivity, specificity, and accuracy, each relating to predictions about two mutually exclusive classes, where “yes” is positive class, and “no” the negative class. True Positives (TP) are correct predictions of the positive class, while True Negatives (TN) are correct predictions of the negative class. Likewise, False Positives (FP) are incorrect predictions of the positive class, while False Negatives (FN) are incorrect predictions of the negative class. Accuracy refers to the proportion of correct predictions (for both the positive and the negative class) in relation to the total number of predictions. Sensitivity refers to the proportion of correctly predicted positive instances , in relation to the total number of positive instances in the data. High sensitivity indicates that most of the positive cases are likely found, so if a negative case is predicted, it is highly likely that it is indeed negative. Specificity refers to the proportion of correctly predicted negative instances , in relation to the total number of negative instances in the data. High specificity means most of the negative cases are likely caught; thus, any positive predictions are highly likely to indeed be positive.
Results
Career in STEM
As shown in Table 1, the highest accuracy was achieved by the SVM model, followed by Logistic Regression (LR), naïve Bayes (nB), Decision Trees (DT) and k-NN. An ANOVA test was carried out, showing statistically significant (p < .001) differences between the accuracies with F(5,255) = 215.8951. Standard deviation was calculated after applying the binomial distribution formula.
There is a clear gap in accuracy between the best three models (all above 70%) and the worst two (accuracy around 60%). A possible explanation is the difference in algorithm types; the top three are known for better handling of higher dimensional data with noisy attributes. While steps were taken during the data preparation phase to reduce the number of attributes and lower the risk of noisy data (see sections 2.1), the results indicate that this is an issue that should still be considered during the model design phase.
Sensitivity and specificity followed a similar trend with respect to performance ranking. LR was the best-balanced prediction model with 72% in both sensitivity and specificity. Meanwhile nB was the most imbalanced with 81% sensitivity and 63% specificity, indicating a strong bias towards making positive predictions.
Study STEM
For the Study STEM target variable, results are reported for both the Study STEM A and Study STEM B datasets (described in section 2.1). Table 2 shows that for STEM A, naïve Bayes (nB) gave the best accuracy, followed by SVM, Logistic Regression (LR), k-NN and Decision Tree (DT); for Study STEM B, the order was the same except for LR and SVM switching places.
ANOVA tests showed statistically significant (p < .001) differences between the model accuracies for both datasets, with F(5,255) = 257.2687 for Study STEM A and F(5,255) = 257.4049, for Study STEM B. The standard deviation was calculated after applying the binomial distribution formula.
The top three models in terms of accuracy, on both datasets, are the same as for predicting Career in STEM (see section 5.1). However, the differences are less pronounced for Study STEM, and the sensitivity and specificity metrics do not show the same clear pattern.
Interestingly, the sensitivity-specificity balances among the top three performers show the opposite relationship from the results on Career in STEM. Overall, the accuracy levels on this task were higher while the balance of nearly all models were worse, mainly due to low levels of specificity; this is not unexpected considering the class-imbalance for the Study STEM target variable, with 70.2% of cases belonging to the positive class, in contrast to the more well-balanced Career in STEM target where the positive class constituted 49.4% of the cases. Only the nB model performed well on specificity for this task, with 70.77% on the Study STEM B data.
The results are similar between Study STEM A and Study STEM B, with the exception of the increase in specificity for the nB mode. This, again, highlights the influence that the model selection can have on the outcome. Furthermore, depending on the application of the model, there may also be a preference for better sensitivity or specificity (or indeed a balance between the two) as well as the preference for a simpler model with fewer attributes.
Deep Learning Epilogue Experiment
Finally, a small epilogue experiment was carried out with a Neural Network model consisting of two layers with 1000 and 8000 Rectified Linear Units (ReLU) [15] respectively, along with a single sigmoid output unit, outputting a value between zero and one; a cut-off point of is used to predict the positive class label. The network was trained with the backpropagation algorithm, using the binary cross-entropy function to calculate the network error.
Each dataset was split into a training and test set, with 66% and 34% using random selection. Training was performed iteratively through repeated exposure of the training set, where one pass through the data is called an epoch. Accuracy was measured on both the training and test set after each epoch.
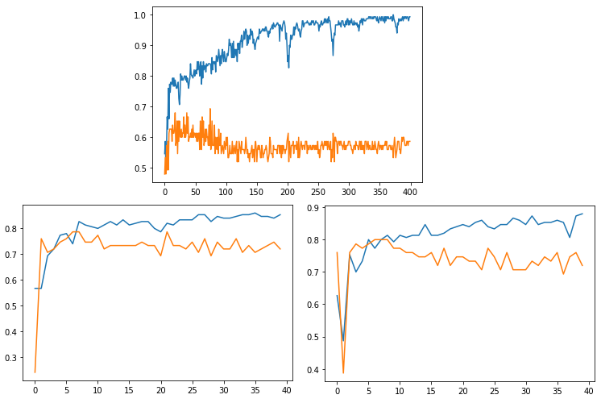
In Figure 1, the upper lines represent the accuracy on the training set, with the lower lines representing the accuracy on the test set. As is common for this type of model, these accuracies diverge once the network becomes overfitted to the training set. Future experiments will employ techniques for mitigating this, including reducing the number of model weights and implementing early stopping on an additional validation set. The best preliminary results are found at around epoch 80 for the Career in STEM model where the accuracy is near 70% which is roughly on par with the top three traditional algorithms. For the Study STEM, the best test results are found around epochs 8 and 10 respectively, with around 80% accuracy for Study STEM B, and slightly lower on Study STEM A, which again is on par with the traditional ML results.
Discussion
The ML algorithms were all able to predict the target variable to some extent. The best accuracies achieved were 72.79% for predicting an interest in a career in STEM and 79.88% for studying STEM. A simple baseline that always predicts the most common class would have accuracies of 50.6% and 70.2% respectively. Thus, while the accuracy for the Study STEM task was higher, the improvement over baseline performance was greater for the Career in STEM task; the latter showed an improvement of 22.19 percentage points or a 43.85% relative increase in predictive performance.
The more advanced algorithms performed better than the simpler models, possibly suggesting that the underlying patterns were too complex to be explained by individual attribute contributions. On the other hand, complexity of interpretation increases along with the complexity of the model. To improve the practical usefulness of applying ML models to this problem, future work will consider various interpretation methods, including advanced techniques such as LIME [18] and SHAP [12] that offers a interpretability for the overall results as well as for individual predictions.
Conclusion and Future Work
This pilot study has demonstrated the potential benefit of Machine Learning (ML) algorithms to model young people’s interest in pursuing STEM careers and education. The more advanced techniques (Logistic Regression, Support Vector Machines and naïve Bayes) achieved higher accuracy levels than the simpler ones (k-Nearest Neighbour and Decision Trees), suggesting that the advanced algorithms may have an advantage in modelling the complex interplay between contributing factors. Future work will aim to distil practically useful insights about these relationships by leveraging existing techniques for interpreting the outcome of ML models. Additionally, we intend to apply these methods on datasets from longitudinal studies to predict changes in interest in STEM after introducing STEM-promoting activities and interventions.
We wish to emphasise that our long-term goal is to use ML algorithms to identify underlying factors that influence interest in STEM careers and further education, to address the predicted skill-gap, and to inform strategies towards more equitable access to STEM jobs. The methods presented here, while predictive in nature, are not intended to be used as prescriptive tools to encourage or discourage individual students of partaking in the STEM field. Even well-intended applications of such nature would need to carefully consider potential consequences, to avoid furthering existing biases and inequities.
REFERENCES
- Alan, B., Zengin, F.K. and Keçeci, G. 2019. Using STEM Applications for Supporting Integrated Teaching Knowledge of Pre-Service Science Teachers. Journal of Baltic Science Education. 18, 2 (2019), 158–170.
- Barbara G. Tabachnick and Linda S. Fidell 2001. Using Multivariate Statistics. Allyn and Bacon.
- Carnevale, A.P., Smith, N. and Melton, M. 2011. STEM: Science Technology Engineering Mathematics. Georgetown University Center on Education and the Workforce.
- Crisp, G., Nora, A. and Taggart, A. 2009. Student Characteristics, Pre-College, College, and Environmental Factors as Predictors of Majoring in and Earning a STEM Degree: An Analysis of Students Attending a Hispanic Serving Institution. American Educational Research Journal. 46, 4 (Dec. 2009), 924–942. https://doi.org/10.3102/0002831209349460.
- Department of Further and Higher Education, Research, Innovation and Science 2020. STEM Education Policy Statement 2017–2026.
- Ergün, A. 2019. Identification of the Interest of Turkish Middle-School Students in STEM Careers: Gender and Grade Level Differences. Journal of Baltic Science Education. 18, 1 (2019), 90–104. https://doi.org/10.33225/jbse/19.18.90.
- Fadzil, H.M., Saat, R.M., Awang, K. and Adli, D.S.H. 2019. Students’ Perception of Learning STEM-Related Subjects through Scientist-Teacher-Student Partnership (STSP). Journal of Baltic Science Education. 18, 4 (2019), 537–548.
- Ghent, J. 2005. A Computational Model of Facial Expression. National University of Ireland Maynooth.
- Gruca, J.M., Ethington, C.A. and Pascarella, E.T. 1988. Intergenerational effects of college graduation on career sex atypicality in women. Research in Higher Education. 29, 2 (Oct. 1988), 99–124. https://doi.org/10.1007/BF00992281.
- Ian Witten and Eibe Frank 2005. Data Mining: Practical machine learning tools and techniques. Morgan Kaufmann.
- Lent, R.W., Brown, S.D. and Hackett, G. 1994. Toward a Unifying Social Cognitive Theory of Career and Academic Interest, Choice, and Performance. Journal of Vocational Behavior. 45, 1 (Aug. 1994), 79–122. https://doi.org/10.1006/jvbe.1994.1027.
- Lundberg, S.M. and Lee, S.-I. 2017. A unified approach to interpreting model predictions. Proceedings of the 31st International Conference on Neural Information Processing Systems (Red Hook, NY, USA, Dec. 2017), 4768–4777.
- Michie, D., Spiegelhalter, D.J., Taylor, C.C. and Campbell, J. eds. 1995. Machine learning, neural and statistical classification. Ellis Horwood.
- Mitchell, T.M. 1997. Machine Learning. McGraw-Hill Education.
- Nair, V. and Hinton, G.E. 2010. Rectified linear units improve restricted boltzmann machines. Proceedings of the 27th International Conference on Machine Learning (ICML-10) (2010), 807–814.
- Platt, J. 1998. Fast Training of Support Vector Machines Using Sequential Minimal Optimization. (Jan. 1998).
- Quille, K. and Bergin, S. 2019. CS1: how will they do? How can we help? A decade of research and practice. Computer Science Education. 29, 2–3 (Jul. 2019), 254–282. https://doi.org/10.1080/08993408.2019.1612679.
- Ribeiro, M.T., Singh, S. and Guestrin, C. 2016. “Why Should I Trust You?”: Explaining the Predictions of Any Classifier. Proceedings of the 22nd ACM SIGKDD International Conference on Knowledge Discovery and Data Mining (New York, NY, USA, Aug. 2016), 1135–1144.
- Schölkopf, B. and Smola, A.J. 2002. Learning with Kernels: Support Vector Machines, Regularization, Optimization, and Beyond. MIT Press.
- van Tuijl, C. and van der Molen, J.H.W. 2016. Study choice and career development in STEM fields: an overview and integration of the research. International Journal of Technology and Design Education. 26, 2 (May 2016), 159–183. https://doi.org/10.1007/s10798-015-9308-1.
Appendix
Table 3 lists the relevant survey questions that were used in this study. The checkbox answers were translated into attributes with a value of 0 or 1; an additional attribute was created to indicate if no option was selected.
© 2022 Copyright is held by the author(s). This work is distributed under the Creative Commons Attribution-NonCommercial-NoDerivatives 4.0 International (CC BY-NC-ND 4.0) license.