ABSTRACT
Self-regulated learning (SRL) is a critical component of mathematics problem solving. Students skilled in SRL are more likely to effectively set goals, search for information, and direct their attention and cognitive process so that they align their efforts with their objectives. An influential framework for SRL, the SMART model, proposes that five cognitive operations (i.e., searching, monitoring, assembling, rehearsing, and translating) play a key role in SRL. However, these categories encompass a wide range of behaviors, making measurement challenging – often involving observing individual students and recording their think-aloud activities or asking students to complete labor-intensive tagging activities as they work. In the current study, we develop machine-learned indicators of SMART operations, in order to achieve better scalability than other measurement approaches. We analyzed student’s textual responses and interaction data collected from a mathematical learning platform where students are asked to thoroughly explain their solutions and are scaffolded in communicating their problem-solving process to their peers and teachers. We built detectors of four indicators of SMART operations (namely, assembling and translating operations). Our detectors are found to be reliable and generalizable, with AUC ROCs ranging from .76-.89. When applied to the full test set, the detectors are robust against algorithmic bias, performing well across different student populations.
Keywords
INTRODUCTION
Work over the last two decades has developed automated detectors of a range of behaviors and constructs in students’ interaction with computer-based learning environments [12]. These detectors utilize log data collected from these learning environments to infer the presence or absence of a complex behavior or a construct in student learning. For example, detectors have been built to identify student affect (e.g., [7, 21, 31]), engagement (e.g.,[6, 37]), and problem-solving strategies [43]. Such detectors can be split into two broad categories: detectors for post-hoc analysis and detectors for real-time adaptation. Post-hoc analysis allows researchers to detect constructs retrospectively and subsequently understand their prevalence (e.g., [32]) and conduct further analysis (e.g., [17, 41]). Detectors designed for real-time use facilitate adaptive experiences and real-time feedback [48], as well as reports to teachers[1].
In particular, considerable work has been devoted to detecting and understanding behaviors and strategies involved in self-regulated learning (SRL). By examining student behavior patterns, automated detectors have been developed for a range of SRL related constructs, including help avoidance [3], gaming the system [7], setting goals [5, 14], and planning and tracking progress [14]. However, these constructs have not been clearly linked to any of the growing number of theoretical models of SRL (although [29] is an exception to this) and have mostly been operationalized in terms of high-level strategies that combine several of behaviors treated as separate in SRL theories, rather than the finer-grained behaviors used in those theories [cf. 46, 48]. Capturing fine-grained indicators of key aspects of SRL in terms of these theoretical models may yield a better understanding of the process of SRL and help EDM research make more direct theoretical contributions.
Self-regulation is a critical component of learning, and has been positively associated with learning outcomes [20, 34, 57]. In mathematics problem-solving, students who are skilled in SRL are able to effectively set goals, search for information, and direct their attention and cognitive resources to align their efforts with their objectives [56]. As a result, SRL facilitates the successful problem-solving process [20, 34, 57] and enables students to acquire a deep and conceptual understanding of the embedded knowledge [31]. Given its benefits, theory-based interventions have been developed to promote SRL [21]. However, current SRL assessments, such as self-reports and think-aloud activities, are not sufficient to provide measurement at scale; at the same time, existing scalable SRL assessments based on automated detection in log data are typically not connected back to theory, making it difficult to use them in theory-driven interventions. SRL assessments based on automated detectors have therefore been used in more ad-hoc, system-specific interventions, often with unintended consequences or unexpected patterns of findings [2, 35]
In the current study, we develop automated detectors that identify fine-grained evidence of SRL constructs drawn from theory. This study does so in the context of CueThink, a digital learning application that focuses on enhancing middle school student mathematics problem-solving skills. Through the lens of the SMART model of SRL (described in greater detail below) [53], we identify and operationalize five SRL indicators: numerical representation, contextual representation, strategy orientation, outcome orientation, and data transformation. We then build automated detectors for each indicator, evaluate their performance, and check them for algorithmic bias.
Background
SRL and the SMART Model
Grounded in information processing theory, Winne and Hadwin [55] characterize the process of SRL as four interdependent and recursive stages, in which learners: 1) define the task, 2) set goals and form plans, 3) enact the plans, and 4) reflect and adapt strategies when goals are not met.
The SMART model of SRL [53] was later proposed to further elucidate the processes involved in these four tasks. Specifically, the model separates the “cognitive and behavioral actions applied to perform the task” into five categories: searching, monitoring, assembling, rehearsing, and translating. Each operation describes a way that learners cognitively engage and interact with information. For example, when working on a task, learners direct their attention to particular information (searching) and compare the information with a standard (monitoring), evaluating the relevance or the importance of the information. When relevant information is identified, students relate pieces of information to one another (assembling), in order to create a comprehensive understanding of the problem. When information does not fit into the current problem representation, learners manipulate the ways information is presented in order to find a solution (translating). Throughout the process, working memory is used to actively maintain and reinstate information (rehearsing).
These cognitive operations are an integral aspect of self-regulation: they help determine student success at completing each of the four SRL tasks, which, in turn, influences the progression of the problem-solving process [52]. However, despite the SMART categories' importance for SRL, they are often difficult to observe or measure, as most learning activities (whether online or offline) do not fully reify the cognitive process involved in their learning tasks. Further, these operations may occur non-linearly, and multiple operations can be employed when completing the same task– making the measurement of these constructs challenging.
Challenges in SRL Measurements
SRL has typically been measured using three common approaches: self-reports, think-aloud activities, and log data collected in computer-based learning environments [51]. With traditional self-report studies, students are asked about their SRL process either outside of a task (i.e., before or after completing a task) or while working on a task. In decontextualized self-report (outside of a task), students report on the SRL strategies they plan to use or recall on the strategies they used, using a pre- or post-task survey. Even though this approach is widely used, the nature of surveying cognitive processes outside of the task may lead to inaccuracies in the representation of cognition [51]. For example, when recalling a cognitive process retrospectively, students may aggregate the out-of-context, self-reported experience across numerous tasks, failing to demonstrate the relationship between the task and the corresponding SRL strategies. For this reason, several studies have adopted in-context self-report (e.g., [42, 47, 54]), in which students are asked to tag their SRL strategies as they occur.
Other research has leveraged think-aloud activities that ask students to verbalize their cognitive processes when solving a problem [28]. As with in-context self-reports, think-alouds give researchers an opportunity to identify processes that are contextualized in the problem-solving activity and are approximately concurrent with their occurrences. However, this process can suffer from an observation effect. Students being prompted to discuss their thinking process in real-time may alter that process and not provide an accurate representation of the processes they would engage in naturally [16, 44]. This, in turn, calls into question the validity of findings obtained using this type of measurement and whether they are generalizable to new students and contexts.
Use Log Data to Measure SRL in Computer-Based Learning Environments
Both self-report and think-aloud approaches are labor-intensive and time-consuming, which make them difficult to scale. As such, a third approach, analyzing log data collected from computer-based learning environments, has emerged as a promising way to measure SRL.
Aleven and colleagues [3] designed an exhaustive set of production rules to represent help-seeking behaviors within a geometry learning system, and then compared these rules to student problem-solving steps to determine whether those steps were warranted by the current situation. Similarly, Biswas et al. [14] used sequences of student behaviors to model a range of SRL behaviors, such as monitoring through explanation, self-assessment, tracking progress, and setting learning goals. Additionally, Segedy et al. [45] utilized log data and coherence analysis to assess students’ ability to seek out, interpret, and apply information in an open-ended learning environment, examining if a student’s subsequent action is coherent based on the information presented.
Researchers have also used textual responses within dialogue-based learning systems to measure SRL. Graesser and colleagues [27] used latent semantic analysis to study student conversations with animated pedagogical agents to assess and support SRL. Students who frequently use questions in a conversation can be interpreted as showing initiative, and engagement in monitoring can be inferred when students demonstrate in their responses that they feel they know the answer [26].
However, often the log data collected does not straightforwardly reflect a SRL construct [4]. Researchers must decide what data to use, what constructs to measure, and how to operationalize the constructs with the existing data [30]. SRL, as a process, covers a range of behaviors and strategies, so the constructs can vary depending on how SRL is conceptualized and also based on the design of the activity the learner is participating in. To ensure the validity of the operationalization, it is recommended that the operationalization should be conceptualized in terms of a SRL model and contextualized in the learning environment where the data is generated [51].
Algorithmic Bias
In order to use detectors at scale, we must ensure that they will be valid for the entire populations they are scaled to rather than only subgroups of students. Recent evidence suggests that many published detectors are prone to algorithmic bias, functioning better for some populations of learners than others [11]. However, there has been limited attention to algorithmic bias within the field of educational data mining, where analyses of algorithmic bias are rare and even overall population demographics are only reported in 15% of publications [38]. Verifying detector fairness is particularly pertinent to our study given the diverse student population who use CueThink, making it important to evaluate detector effectiveness across demographic groups before deploying and using the detectors at scale.
Current Study
In the current study, we address the challenges noted above by building automated detectors of SRL constructs from a theory-driven lens. Using a dataset of 79 students as they interacted with the online math learning platform CueThink, we first examine the learning environment understanding how students interact with the platform and the context of where the log data is generated. Based on the context and the log data available, we identify relevant theoretical constructs grounded in the SMART model. In particular, five SRL indicators relating to cognitive operations in the SMART model (in this case, all either assembling or translating) are identified for investigation.
We use text replay to code student interactions for each defined indicator. These labels are then used as ground truth for machine learning. We distill a variety of features from the log data to represent multiple aspects of a student’s interaction, including the number of responses and the content in the responses. The ground truth and the features are then input into a machine learning process, training a model to emulate human coders’ judgement, making predictions on the presence or absence of a SRL indicator.
We demonstrate that trained detectors provide accurate detection, suitable for real-time use. Finally, we also evaluate, through slicing analysis, the performance of our models across different demographic groups.
Methods
Learning Environment
CueThink is a digital learning application that focuses on enhancing middle school student math problem-solving skills, by encouraging students to engage in self-regulated learning and to develop math language to communicate problem-solving processes. CueThink asks students both to solve a math problem and to create a shareable screen-cast video that provides the student’s answer and also demonstrates their problem-solving process. As Figure 1 shows, CueThink structures a problem into a Thinklet, a process that includes four phases—Understand, Plan, Solve, and Review—that closely align with Winne & Hadwin’s model of SRL [55].

Each phase of the Thinklet (outlined in Table 1 and described in more detail below), asks students to focus on a different part of the problem-solving process. While working on a Thinklet, students can move freely across the four phases, including going back to a previous phase or skipping phases.
Starting with the Understand phase, students read a problem and provide text-based responses to three questions: (1) “What do you notice?” (2) “What do you wonder?” and (3) “What is your estimated answer to the problem?” This phase encourages students to actively look for information in the problem and create a representation of the problem space. Thus, students demonstrate their understanding of what they know and what they need to know at this phase.
In the Plan phase, students build on what they have established in the Understand phase by planning how they will solve the problem. Students are first prompted to select what strategies they will use to solve the problem. They may choose from a predefined strategy list (i.e., draw a picture, model with an equation, work backwards, etc.) or define their own strategies. Once the student has selected which strategies they will use, the student is prompted to write a plan on how they will use the strategies to solve the problem.
In the Solve phase, students explain and present their answer. Specifically, they create a screen cast video using an interface that provides them with a whiteboard and mathematical tools (i.e., number lines, ruler, etc.).
In the Review phase, students provide the final answer to the math problem, but also reflect on whether the answer makes sense and whether their communication is clear, using checklists to scaffold their reflection.
Once students have completed the problem, they share their screencast explanation for Peer Review. In this phase, teachers and peers annotate both the textual responses and video, often asking the student for their underlying reasoning or why the student picked specific methods. These annotations are then sent back to the video’s author for possible revision.
Phase | Tasks Description & Data Types |
|---|---|
Understand | What I notice is (textual response) |
Plan | Choose your strategies (select all that apply, textual response) |
Solve* | Video creation tools (Whiteboard, math tools, and recording tools) |
Review | Check your math (select all that apply) |
* Student activity in the Solve phase is not used in this paper’s analyses
Student Demographics
In this study, 79 students in grade 6 and 7 at a suburban school in the southwestern U.S. used CueThink during the 2020-21 school year. The school contains a diverse student population with around 40% Hispanic or Latino, 40% White, 15% African American, and 5% Asian students. Students’ self-reported demographic information on gender and race/ethnicity was collected. For gender, students could choose to identify as male, female, non-binary, or leave the question blank. For race/ethnicity, options included African America, Hispanic/Latinx, White, Asian, Native American, two or more races, other, or prefer not to say. Students reporting “other” for their race/ethnicity were provided the option to give detail.
Log Data
CueThink was implemented in six classrooms over multiple weeks, with teachers assigning problems for students to complete in the application. We collected log files that reflect how students use the application and their problem-solving process. On average, students spent 5.2 hours in CueThink and 1.8 hours working on each Thinklet. Specifically, for each problem, encapsulated in a Thinklet, data generated during the problem-solving process that includes the questions students answered and their textual responses at each phase were collected. In this study, we analyzed textual and click-stream data, but did not analyze data from the videos. In total, we collected 349 Thinklets from 79 students working on 24 different problems. Of those 349 Thinklets, not all were first attempts. Students have the opportunity to revise their work, which creates another Thinklet. In those cases, it is possible that students do not go through the entire problem-solving process. Of the total number of Thinklets, 146 were duplicate attempts.
Building Detectors
Building automated detectors of self-regulated behaviors was a multi-step process (detailed in the following subsections). First, we distilled human-readable text replays from log data. Using these text replays, we identified and operationalized qualitative categories that corresponded with SRL constructs, grounding the operationalization in Winne’s SMART model. We then labeled the self-regulated behaviors, generating ground truth data. Feature engineering and feature distillation were conducted and used to train the predictive models. Lastly, we evaluated model performance and checked for algorithmic bias.
Text Replays of Interaction Logs
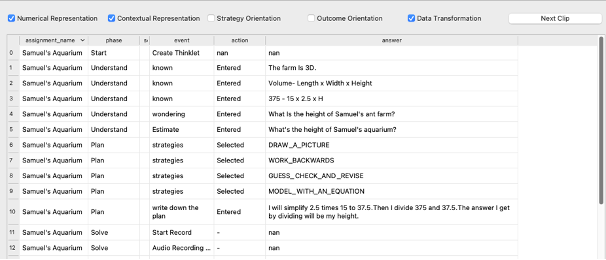
To facilitate inspection and exploration of the data, we used text replays. This method presents segments of interaction data (referred to as clips) in a human-readable presentation. This process facilitates both initial exploration of the data (such as in section 4.2) along with the final coding process (section 4.3). Clips are then viewed by human coders who label them accordingly [8]. Previous studies have used text replay coding to label student affect, disengagement, and learning strategies, such as gaming the system [10], confrustion [32], player goals [22], and SRL strategies such as whether a student is using a table to plan their analyses [43].This approach demonstrates a similar level of reliability as classroom observations and is 2-6 times faster compared to other methods of generating labels, such as classroom observations, screen replay, and retrospective think/emote-aloud protocols [8].
The length and the grain-size of text replay clips can vary depending on both the available data and the granularity of the predictions the researcher intends to make. Because this study seeks to detect cognitive SRL operations in the problem-solving process, which requires a comprehensive examination across questions and phases, the log files were delineated into clips on the level of entire Thinklets. Each clip contains a student's actions and text-based responses that were submitted as that student worked through the four phases to produce a single Thinklet. (Note that because video data was not available in these replays, our coders did not see information from the Solve phase.) The clips were distilled from log files and presented using a Python window, shown in Figure 2.
Construct Operationalization
To identify constructs to detect, we first examined the clips containing student responses in Thinklets and coded student responses for indicators of SRL—qualitative categories that correspond with SRL constructs (we discuss the details of exactly how the data was coded in section 4.3). The definitions of the indicators we coded were developed through dialogue between the research team and system developers. This process followed the recursive, iterative process used in [49] that includes seven stages: conceptualization of codes, generation of codes, refinement of the first coding system, generation of the first codebook, continued revision and feedback, coding implementation, and continued revision of the codes [49]. The conceptualization of codes included a review of related literature, including several theoretical frameworks and perspectives [13, 15, 24], primarily focusing on the SMART model [53]. Using grounded theory [18], we identified common behaviors that were (1) indicative of SRL as characterized by Winne’s SMART model [53] and (2) salient in the log files. A draft lexicon and multiple criteria were generated for a coding system to help identify these constructs.
Given the learning environment's design and the available data, our efforts focused on defining behaviors related to two categories of cognitive operations (the assembling and translating operations from the SMART model) as they are frequently employed in the initial stages in SRL that help learners define tasks and set goals. Following the process used in [49], two coders (the first and second authors) coded a set of clips together, identified five SRL indicators (i.e., numerical representation, contextual representation, strategy orientation, outcome orientation, and data transformation), outlined the criteria for each indicator, and created a rubric.
The draft coding manual was discussed with all members of the research team and developers and designers at CueThink to build a common understanding of the criteria and constructs being examined as well as the features of the system to gain feedback for further refinement. This process was repeated until the entire team had reached a shared understanding of the criteria and constructs being examined by the codebook. The SRL indicators identified, the criteria, and alignment with the SMART model are included in Table 2.
Numerical and contextual representation consider a learner’s process of creating a problem representation, which often occurs in the initial stage in the problem-solving process (i.e., define the task), outlined in the four-phase model of SRL [55]. In problem representation, learners create a problem space by identifying information they know and information they need to know. The two SRL indicators encode how learners represent and process information in math problems, denoting if numerical components and/or contextual details are noted. We consider both of these processes to reflect assembling in the SMART model as students are creating their representation of the data from the information provided. There may also be overlap with translating in some cases, especially if the question provides a different representation to the one the students use. However, as this is not always the case, we primarily consider both indicators to reflect assembling actions and tag translating actions in a different code (see below).
Strategy and outcome orientation also reflect student assembling behaviors. Both indicators consider how students set their goals and form plans for the problem-solving process. These two indicators demonstrate a difference in focuses (process vs. output).
Lastly, data transformation reflects behaviors that are associated with the translating operation, in which the learner manipulates the ways information is represented to them in the problem to find a solution.
SMART | SRL Indicator | Working Definition |
|---|---|---|
Assembling | Numerical Representation (NR) | The learner’s representation of the problems includes numerical components and demonstrates a level of understanding of how the numerical values are used in the math problem. |
Assembling | Contextual Representation (CR) | The learner’s representation of the problem includes contextual details relating to the setting/characters/situations within the given math problem. |
Assembling | Strategy Orientation (SO) | Learners explicitly state a plan for how they will find the answer for the given math problem, decomposing information into a step-by-step process. |
Assembling | Outcome Orientation (OO) | The learner provides only a numerical estimate of the final answer for the given math problem, suggesting that learners are focused on the output instead of the process itself. |
Translating | Data | The learner manipulates the ways information is represented to them in the problem to find a solution. This suggests active problem solving. |
Coding the Data
After constructs were operationalized and defined, we proceeded to code the remainder of the data. Two coders, (the same as in the previous section), completed the text replay coding in three phases: preliminary coding (discussed above), separate coding (two coders per clip; for establishing inter-rater reliability), and individual coding (one coder per clip; for completeness).
The two coders each used the codebook/rubric to code the same set of clips separately. They then compared the labels and computed the inter-rater reliability (IRR) kappa. For constructs with low kappa, the two coders discussed their differences in labeling and conducted another round of coding. This step of separate coding and comparing is repeated until an acceptable reliability is established. After two rounds of coding, as shown in Table 3, the two coders reached an acceptable IRR above 0.60 for all five SRL indicators (M=0.75).
SRL Indicator | IRR Kappa |
|---|---|
Numerical Representation (NR) | 0.83 |
Contextual Representation (CR) | 0.63 |
Strategy Orientation (SO) | 0.74 |
Outcome Orientation (OO) | 0.78 |
Data Transformation (DT) | 0.74 |
Once the reliability was established, the coders moved on to the individual coding where they split the rest of the clips and coded them individually.
In total, the two coders coded 349 clips. However, in order to consistently examine the entire problem-solving process, 167 clips that were marked incomplete because students stopped before completing the entire problem were excluded. Of the remaining 182 clips, coding resulted in the following distribution of labels: 64% numerical representation, 77% contextual representation, 8% strategy orientation, 72% outcome orientation, and 73% data transformation. These were produced by 72 students, who, on average, each contributed 3 clips (max=4, min=1, median=3).
Feature Distillation
Two sets of features were distilled to build the detectors. Both sets of features consist solely of features that can be extracted and used in real-time. The first set of features were designed to provide an overview of a Thinklet by examining the number of responses in a Thinklet. These features (N = 10) were distilled at the Thinklet level. For example, we distilled the number of questions students answered in a Thinklet and the number of responses in each phase. To understand the strategies that students select in the Plan phase, we also created a feature that counts the number of strategies a student selects among the top two strategies used by peers for the same problem.
The second set of features were designed to examine the content and the linguistic features of students’ text-based responses. These features (N = 90) were first extracted at the response level and then aggregated to the phase level. These aggregations were calculated for the Understand, Plan, and Review phases. (No textual data was extracted from the Solve phase as there was no textual input in this phase.)
Specifically, we distilled whether each response: 1) contains a numerical value, 2) consists of only numerical values, 3) has mathematical operation signs, 4) contains a question (if it contains a question mark or uses keywords such as “wonder”, “why”, etc.), 5) uses language that indicates the formation of a plan (e.g., the use of keywords like “plan”, “I will”, “going to”, etc.) , and 6) is the exact repetition of a previous answer. These criteria generate a set of binary variables for each response. We averaged these binary variables across the responses within a phase, creating 18 features for each Thinklet.
Additionally, in each response, we counted the number of 7) characters, 8) words, 9) numerical values, 10) verbs, 11) nouns, and 12) pronouns. Features 10-12 were counted using Udpipe, a natural language processing toolkit [50]. We also 13) counted the number of keywords used from a predefined list that provides the context of each problem; and 14) computed how similar each response is to the problem item using the Smith-Waterman algorithm [46]. For these continuous variables, we computed the mean, standard deviation, and max of the values for each phase, creating 72 features.
Features distilled from the two sets were combined. In total, 100 features were extracted from each Thinklet process and were then used to construct the automated detectors. Note that we did not extract any features from the video that students make in the current work. Similarly, we did not use any of the audio from the video (or transcription thereof) for any features.
Machine Learning Algorithms
We used the scikit-learn library [40] to implement commonly-used models, including Logistic Regression, Lasso, Decision Tree, Random Forest as well as Extreme Gradient Boosting (XGBoost) as implemented in the XGBoost library [19]. XGBoost outperformed other algorithms in all cases; we therefore only discuss the XGBoost results below.
XGBoost uses an ensemble technique that trains an initial, weak decision tree and calculates its prediction errors. It then iteratively trains subsequent decision trees to predict the error of the previous decision tree, with the final prediction representing the sum of the predictions of all the trees in the set. We tested the detectors with 10-fold student-level cross-validation. For this approach, the dataset was split into 10 student-level folds, meaning that in cases where students had multiple Thinklets, all of their data would be contained within the same fold and at no time could data from a student be included in both the training and testing set. Nine folds were used to train the model, and the trained model was used to make predictions for the 10th fold. Each fold acted as the test set once. Student-level cross-validation was conducted to verify generalizability to new students.
Models were evaluated using the area under the Receiver Operating Characteristic curve (AUC ROC), which indicates the probability that the model can correctly distinguish between an example of each class. An AUC ROC of 0.5 represents chance classification, while an AUC ROC of 1 represents perfect classification. Results were calculated for each fold and averaged to yield one AUC ROC score per detector.
Results
Model Performance
Due to the rarity of strategy orientation (only 14 clips were labeled with this construct), a detector could not be built for this construct. Automated detectors were built for the other four constructs. As shown in Table 4, the average AUC ROC derived from 10-fold student-level cross-validation is 0.894 for numerical representation (NR), 0.813 for contextual representation (CR), 0.761 for outcome orientation (OO), and 0.815 for data transformation (DT). These findings suggest that the detectors were generally successful at capturing these four SRL constructs. We also calculated the standard deviations (SD) of the AUC ROCs across the 10 folds for each detector.
SRL Indicator | AUC ROC (SD) |
|---|---|
Numerical Representation | 0.894 (.078) |
Contextual Representation | 0.813 (.132) |
Outcome Orientation | 0.761 (.076) |
Data Transformation | 0.815 (.163) |
Feature Importance
To better understand the detectors as well as to inform our understanding of how these features relate to the constructs, the SHapley Additive exPlanations (SHAP) [33] value, which reflects feature importance, was calculated for each feature within each test set.
These values were then averaged across the 10 testing sets and ranked based on their absolute values. Of the 100 features used, Table 5 reports the top five features with the highest absolute SHAP values for each detector. To understand the directionality, we examined the average SHAP values of the features listed. A positive average SHAP value was found for all the features listed (except for one, as indicated in the Contextual Representation section of Table 5). The positive values indicate that the features are positive predictors of the SRL indicators, suggesting that the higher the values in each feature, the more likely the model is to infer the presence of a SRL indicator.
Feature Phase | Feature |
|---|---|
Numerical Representation | |
Understand | Mean N of responses that give numerical values |
Understand | Max value of the similarity feature which indicates how parallel a student’s response is to the original problem |
Understand | SD of the similarity feature |
Understand | Total N of responses |
Plan | Avg value of the similarity feature |
Contextual Representation | |
Understand | Is there a response to the "what do you notice" question? |
Understand | Avg N of keywords used |
Understand | SD of the N of characters used (Contextual Representation less likely) |
Thinklet | Total N of responses |
Plan | Max value of the N of characters used |
Outcome Orientation | |
Review | Avg N of keywords used |
Review | Avg N of words used |
Understand | SD of the N of numerical values used |
Understand | Is there a response to the "what is your estimated answer" question? |
Review | Avg N of nouns used |
Data Transformation | |
Plan | N of strategies selected that were among the most common strategies used by peers |
Understand | SD of the similarity feature |
Plan | SD of the N of characters used |
Understand | SD of the N of nouns used |
Plan | Max value of N of words used |
We note that of the 20 features listed in Table 5, 11 are from the Understand phase, 5 are from the Plan Phase and 3 are from the Review phase. In other words, behaviors in the early phases contributed more heavily to the predictions. This finding aligns with how the Thinklets were initially coded. Specifically, the coders primarily examined student responses in the Understand phase for numerical and contextual representation as this phase contains information demonstrating how student assemble information and create a problem representation; the coders examined the Thinklet more broadly when coding for other SRL indicators, as they encompass behaviors that span across phases.
|
|
| Gender | Race/Ethnicity | |||||||
|---|---|---|---|---|---|---|---|---|---|---|---|
All Students (k-fold) | All Students (Pooled) | Male | Female | Left Blank | African American | Hispanic/ Latinx | White | Prefer Not to Say | Other | Two or more races | |
N. students | 72 | 72 | 33 | 28 | 9 | 6 | 18 | 8 | 19 | 14 | 5 |
N. clips | 182 | 182 | 81 | 73 | 24 | 20 | 38 | 19 | 50 | 37 | 12 |
NR | 0.89 | 0.89 | 0.82 | 0.93 | 0.97 | 0.92 | 0.88 | 0.96 | 0.86 | 0.85 | 0.86 |
CR | 0.81 | 0.80 | 0.74 | 0.75 | 0.94 | 0.75 | 0.72 | 0.80 | 0.90 | 0.65 | 0.78 |
OO | 0.78 | 0.75 | 0.78 | 0.74 | 0.72 | 0.71 | 0.81 | 0.80 | 0.74 | 0.78 | 0.46 |
DT | 0.82 | 0.86 | 0.88 | 0.87 | 0.78 | 0.92 | 0.91 | 0.83 | 0.84 | 0.82 | 0.86 |
Algorithmic Bias
Algorithmic bias occurs when model performance is substantially better or worse across mutually exclusive groups separated by generally non-malleable factors [11]. To validate our detectors, we tested the model performance in different student populations, based on gender and race/ethnicity using slicing analysis [25]. Specifically, utilizing the predictions made in the testing sets, AUC was computed for each subgroup of students in the data for which we received data on group membership. However, due to sample size, comparisons were not possible for gender non-binary students (N=2), Asian students (N=2), or Native American students (N=0).
As Table 6 shows, the difference in model performance measured by AUC between male and female students is small, ranging from 0.01-0.11 for the four detectors. The detectors for numerical representation and contextual representation performed somewhat better for female students (AUCNR = .93, AUCCR = .75) than for male students (AUCNR = .82, AUCCR = .74), while detectors for outcome orientation and data transformation preformed somewhat better for male students (AUCOO = .78, AUCDT = .88) than for female students (AUCOO = .74, AUCDT = .87).
Table 6 also shows the analysis of algorithmic bias in terms of race/ethnicity, comparing the AUC between student racial/ethnic subgroups that had more than 5 students in our sample: African American, Hispanic/Latinx, and White. Small to moderate differences were observed across the three groups, though the differences were not consistent (i.e., no racial/ethnic group consistently had the best-performing detectors). However, performance remained acceptable for all four detectors across all groups. When detecting numerical representation and contextual representations, the detectors performed somewhat better for White students (AUCNR = 0.96, AUCCR = 0.80), than for African American (AUCNR = 0.92, AUCCR = 0.75) and Hispanic/Latinx (AUCNR = 0.88, AUCCR = 0.72) students. However, the outcome orientation detector had somewhat higher performance for Hispanic/Latinx students (AUCOO = 0.81), than for White (AUCOO = 0.80) and African American (AUCOO = 0.71) students. The data transformation detector performed better for African American students (AUCDT = 0.92) than for Hispanic/Latinx (AUCDT = 0.91) and White (AUCDT = 0.83) students.
Performance was substantially lower for two constructs/group combinations: detecting contextual representation for students who identify race as other (AUCCR = 0.65) and detecting outcome orientation for students who identify as belonging to two or more races (AUCOO = 0.46). These more substantial differences may be due to the small sample size of these constructs within these subgroups; in future work, larger samples will be collected in order to validate performance in these groups.
Given the data collected, we noticed a considerable number of students who declined to report gender (N = 9) and race (N = 19). Both groups performed close to the average model performance, across groups and contexts.
Conclusion and discussion
Main Findings
Given the importance of self-regulation in learning, specifically in the problem-solving process, an increasing number of studies have looked into ways to promote self-regulated learning. This first requires the ability to accurately measure SRL, so that interventions can be introduced to encourage and guide students to self-regulate effectively. However, the most common ways of measuring SRL in a fine-grained fashion – either through self-report and think-aloud protocols –are difficult to automate and scale, and they can also interrupt or interfere with the learning task. Log data collected from computer-based learning environments offers an unobtrusive and potentially scalable solution to help understand when and how students self-regulate within the problem-solving process, in order to inform decisions on intervention (e.g., [3]). However, previous automated detection of SRL constructs using log data has mostly not been explicitly connected to SRL theory. In the current work, we explored the possibility of detecting SRL constructs at a fine-grained level, focusing on detecting cognitive operations (i.e., assembling and translating), outlined in the SMART model [53]. Specifically, we detected the presence of four self-regulation indicators related to two categories of operations: numerical representation, contextual representation, outcome orientation, and data transformation. Evaluated using 10-fold student-level cross-validation, our detectors were found to be accurate and valid across demographic groups, with AUC ROC ranging from .76-.89.
To understand the detectors, feature importance was examined using SHAP values. The top five features with the highest absolute SHAP values were identified for each detector. With the features identified, we find that except for outcome orientation, the detectors primarily rely on features extracted from the Understand and Plan phases of the learning activity, the two phases where students assemble information and make plans. In particular, the numerical representation detector mainly relies on features that examine the numerical values used in the Understand phase as well as features that compare the similarity between student responses and the problem item. The numerical value feature makes sense, as the detector is operationalized to identify if numerical components are processed and represented when students assemble information.
However, the maximum similarity feature, a feature that takes both numerical values and text into account, also contributes to the NR indicator. This finding suggests that the NR detector not only examines if numbers are used in responses, but also how they are used in relation to the problem. As such, this finding validates the operationalization of this indicator, showing that the learner demonstrates a level of understanding of how numerical values are used in math problems, creating a representation of the problem space utilizing numbers.
The contextual representation detector looks at the keywords used in student responses in the Understand phase and the length of the responses in the Plan phase, which indicates the relationship that the longer the responses are when a student is forming a plan, the more likely it is for the student to contextually representing the problem. When predicting the presence of outcome orientation, the model utilizes features extracted in the Understand and the Review phases, understanding students’ use of keywords, nouns, and numerical values in these two phases. At last, the data transformation detector checks the number of top strategies students select as well as the length and the variation in the length of the responses in the Understand and Plan phase.
Additionally, we examined model performance on different demographic subgroups of students, both in terms of gender and racial/ethnic groups, to verify their fairness and lack of algorithmic biases. Relatively small differences were observed in each comparison, and no student group (either gender or racial/ethnic group) consistently had the best-performing detectors.
Applications
The detectors built in the current study provide two advantages over previous SRL detectors. First, previous SRL detectors generally identify higher-level strategies and are not typically linked to theory; in contrast, we specifically based our detectors on a SRL model in order to identify theoretically-grounded SRL constructs at a finer-grain size. Having developed these fine-grained models of behavior associated with the assembling and translating operations of SMART, we can conduct analyses to further our understanding of the role that cognitive operations play in the broader process of SRL. For example, we can investigate questions about how often students use these cognitive operations in each of the four tasks outlined in the Winne and Hadwin’s four-stage model, and how the engagement and the frequency of the engagement in these cognitive operations contributes to the success of completing the tasks. Results from future analyses will help expand the current theoretical understanding on SRL, adding specificity to the still high-level processes represented in contemporary SRL theory.
Second, given that most previous detectors are not connected back to SRL theory, it has been difficult to use them with theory-driven interventions. The detectors proposed in the current study are developed based on a theoretical model of SRL [46, 48] and are operationalized to capture key aspects of the cognitive operations in the model. These detectors can therefore be used to facilitate the development of adaptive learning environments that respond to student SRL, in a fashion connected to theory. For instance, a student demonstrating an outcome orientation could be encouraged to reflect further on their strategy.
Similarly, these detectors could also provide theory-grounded information to teachers (e.g., through a dashboard), providing insight on how students are approaching problems. This data can inform teachers as they create and refine their problems, as well as informing how they support their students. As with any application of this nature, careful attention will be needed in design to ensure that data is presented in the most useful form for teachers and appropriately represents the uncertainty in the model (i.e., false positives or false negatives).
Limitations and Future Work
This work has two principal limitations that should be addressed in future work. First, when validating the fairness of the models, the sample size is small (less than five students) for several student groups. Reliable comparison of the model performance for these groups of students is therefore not possible. In future work, larger and more representative samples should be collected in order to validate model performance for a broader range of student groups.
Second, although our detectors are based on a theoretical model of SRL, the operationalization of our constructs is contextualized in the current learning environment, so our detectors may be platform-specific. Future work should study the transferability of the current detectors by examining their applicability and predictive performance, and explore how they can be adapted for use in other learning environments. To the extent that some of our detectors (such as the data transformation detector) apply across learning environments, we can investigate their performance within those contexts to evaluate their transferability (see, for instance, [39]).
Additionally, since the detectors are trained primarily relying on complete Thinklets, when being implemented in a learning platform, the detectors will make predictions after a student has solved a problem, reflecting the student’s use or a lack of use of assembling and translating in the problem-solving process. Though these detectors may not provide real-time detection when students are working through a problem, they can be used to inform and direct following practices and instructions. Future studies may examine ways of incorporating incomplete Thinklets in order to provide detection during the problem-solving process, enabling real-time interventions.
As an explorative study, five constructs concerning two cognitive operations are identified in the current study. However, SRL as a process, covers a range of behaviors and strategies that elicit the use of various cognitive operations. Therefore, in future studies, it is our goal to continuously understand and detect the use of cognitive operations throughout the four stages of self-regulated learning in the context of problem-solving.
Conclusions
To better understand and facilitate the use of self-regulation in problem-solving, the current study tested the possibility of scaling up SRL measurement by leveraging machine learning to automatically detect individual SRL indicators through the lens of the SMART model. We built automated detectors that identify four commonly used strategies in math problem solving, indicating assembling and translating operations. Our detectors were found to be reliable and generalizable. Additionally, the detectors were also tested on different student populations to verify their fairness and lack of algorithmic bias, addressing a previously overlooked issue in the field of educational data mining. Given these properties, we anticipate implementing the detectors in the learning environment to collect more fine-grained data and to leverage the detection to inform interventions, creating more positive experiences in mathematical problem-solving.
Achknowledgements
The research reported here was supported by the EF+Math Program of the Advanced Education Research and Development Program (AERDF) through funds provided to the University of Pennsylvania, University of New Hampshire, and CueThink. The opinions expressed are those of the authors and do not represent views of the EF+Math Program or AERDF
REFERENCES
- Aguilar, S.J. et al. 2021. Associations between learning analytics dashboard exposure and motivation and self-regulated learning. Computers & Education. 162, (2021). DOI:https://doi.org/10.1016/j.compedu.2020.104085.
- Aleven, V. et al. 2016. Help Helps, But Only So Much: Research on Help Seeking with Intelligent Tutoring Systems. International Journal of Artificial Intelligence in Education. 26, 1 (2016), 205–223. DOI:https://doi.org/10.1007/s40593-015-0089-1.
- Aleven, V. et al. 2006. Toward Meta-cognitive Tutoring: A Model of Help Seeking with a Cognitive Tutor. International Journal of Artificial Intelligence in Education. 16, 2 (2006), 101–128.
- Azevedo, R. et al. 2017. Understanding and Reasoning about Real-Time Cognitive, Affective, and Metacognitive Processes to Foster Self-Regulation with Advanced Learning Technologies. Handbook of Self-Regulation of Learning and Performance. (2017), 254–270. DOI:https://doi.org/10.4324/9781315697048-17.
- Azevedo, R. et al. 2011. Use of hypermedia to assess and convey self-regulated learning. Handbook of Self-Regulation of Learning and Performance. 32, (2011), 102–121. DOI:https://doi.org/10.4324/9780203839010.ch7.
- Baker, R.S. et al. 2010. Detecting Gaming the System in Constraint-Based Tutors. Proceedings of the 18th Annual Conference on User Modeling, Adaptation, and Personalization. (2010), 267–278. DOI:https://doi.org/10.1007/978-3-642-13470-8_25.
- Baker, R.S. et al. 2004. Detecting student misuse of intelligent tutoring systems. International Conference on Intelligent Tutoring Systems. (2004), 531–540. DOI:https://doi.org/10.1007/978-3-540-30139-4_50.
- Baker, R.S. et al. 2006. Human Classification of Low-Fidelity Replays of Student Actions. Proceedings of the Educational Data Mining Workshop at the 8th International Conference on Intelligent Tutoring Systems. (2006), 29–36.
- Baker, R.S. et al. 2012. Towards Sensor-Free Affect Detection in Cognitive Tutor Algebra. Proceedings of the 5th International Conference on Educational Data Mining. (2012), 126–133.
- Baker, R.S. and Carvalho, A.M.J.A. 2008. Labeling student behavior faster and more precisely with text replays. Proceedings of the 1st International Conference on Educational Data Mining. (2008), 38–47.
- Baker, R.S. and Hawn, A. 2021. Algorithmic Bias in Education. International Journal of Artificial Intelligence in Education. (2021), 1–41. DOI:https://doi.org/10.35542/osf.io/pbmvz.
- Baker, R.S. and Yacef, K. 2009. The State of Educational Data Mining in 2009: A Review and Future Visions. Journal of Educational Data Mining. 1, 1 (2009), 3–17. DOI:https://doi.org/10.5281/zenodo.3554657.
- Bandura, A. 1986. Social foundations of thought and action: A social cognitive theory.
- Biswas, G. et al. 2010. Measuring Self-regulated Learning Skills Through Social Interactions in a Teachable Agent. Research and Practice in Technology Enhanced Learning. 05, 02 (Jul. 2010), 123–152. DOI:https://doi.org/10.1142/S1793206810000839.
- Boekaerts, M. 1999. Self-regulated learning: where we are today. International Journal of Educational Research. 31, 6 (1999), 445–457. DOI:https://doi.org/10.1016/S0883-0355(99)00014-2.
- Bosch, N. et al. 2021. Students’ Verbalized Metacognition During Computerized Learning. Proceedings of the 2021 CHI Conference on Human Factors in Computing Systems (May 2021), 1–12.
- Botelho, A.F. et al. 2018. Studying Affect Dynamics and Chronometry Using Sensor-Free Detectors. Proceedings of the 11th International Conference on Educational Data Mining. (2018), 157–166.
- Charmaz, K. 1983. The grounded theory method: An explication and interpretation. Contemporary Field Research. (1983), 109–126.
- Chen, T. and Guestrin, C. 2016. XGBoost: A Scalable Tree Boosting System. Proceedings of the 22nd ACM SIGKDD International Conference on Knowledge Discovery and Data Mining (San Francisco California USA, Aug. 2016), 785–794.
- Cleary, T.J. and Chen, P.P. 2009. Self-regulation, motivation, and math achievement in middle school: Variations across grade level and math context. Journal of School Psychology. 47, 5 (Oct. 2009), 291–314. DOI:https://doi.org/10.1016/j.jsp.2009.04.002.
- Devolder, A. et al. 2012. Supporting self‐regulated learning in computer‐based learning environments: systematic review of effects of scaffolding in the domain of science education. Journal of Computer Assisted Learning. 28, 6 (Dec. 2012), 557–573. DOI:https://doi.org/10.1111/j.1365-2729.2011.00476.x.
- DiCerbo, K.E. and Kidwai, K. 2013. Detecting player goals from game log files. Presented at the 6th International Conference on Educational Data Mining (2013).
- D’Mello, S.K. et al. 2008. Automatic detection of learner’s affect from conversational cues. User Modeling and User-Adapted Interaction. 18, 1–2 (Feb. 2008), 45–80. DOI:https://doi.org/10.1007/s11257-007-9037-6.
- Efklides, A. 2011. Interactions of Metacognition with Motivation and Affect in Self-Regulated Learning: The MASRL Model. Educational Psychologist. 46, 1 (Jan. 2011), 6–25. DOI:https://doi.org/10.1080/00461520.2011.538645.
- Gardner, J. et al. 2019. Evaluating the Fairness of Predictive Student Models Through Slicing Analysis. Proceedings of the 9th International Conference on Learning Analytics & Knowledge (Tempe AZ USA, Mar. 2019), 225–234.
- Graesser, A. and McNamara, D. 2010. Self-Regulated Learning in Learning Environments with Pedagogical Agents That Interact in Natural Language. Educational Psychologist. 45, 4 (Oct. 2010), 234–244. DOI:https://doi.org/10.1080/00461520.2010.515933.
- Graesser, A.C. et al. 2007. Using LSA in AutoTutor: Learning through mixed initiative dialogue in natural language. Handbook of Latent Semantic Analysis. 243–262.
- Greene, J.A. et al. 2017. Capturing and modeling self-regulated learning using think-aloud protocols. Handbook of Self-Regulation of Learning and Performance. 323–337.
- Hutt, S. et al. 2021. Investigating SMART Models of Self-Regulation and their Impact on Learning. Proceedings of the 14th International Conference on Educational Data Mining. (2021), 580–587.
- Kovanovic, V. et al. 2016. Does Time-on-task Estimation Matter? Implications on Validity of Learning Analytics Findings. Journal of Learning Analytics. 2, 3 (Feb. 2016), 81–110. DOI:https://doi.org/10.18608/jla.2015.23.6.
- Labuhn, A.S. et al. 2010. Enhancing students’ self-regulation and mathematics performance: the influence of feedback and self-evaluative standards. Metacognition and Learning. 5, 2 (Aug. 2010), 173–194. DOI:https://doi.org/10.1007/s11409-010-9056-2.
- Lee, D.M.C. et al. 2011. Exploring the Relationship between Novice Programmer Confusion and Achievement. International Conference on Affective Computing and Intelligent Interaction. (2011), 175–184. DOI:https://doi.org/10.1007/978-3-642-24600-5_21.
- Lundberg, S.M. et al. 2019. Consistent Individualized Feature Attribution for Tree Ensembles. arXiv:1802.03888. (2019). DOI:https://doi.org/10.48550/arXiv.1802.03888.
- Nota, L. et al. 2004. Self-regulation and academic achievement and resilience: A longitudinal study. International Journal of Educational Research. 41, 3 (Jan. 2004), 198–215. DOI:https://doi.org/10.1016/j.ijer.2005.07.001.
- Ocumpaugh, J. et al. 2021. Using Qualitative Data from Targeted Interviews to Inform Rapid AIED Development. Proceedings of the 29th International Conference on Computers in Education. (2021), 69–74.
- Paquette, L. et al. 2014. Sensor-Free Affect Detection for a Simulation-Based Science Inquiry Learning Environment. International Conference on Intelligent Tutoring Systems. (2014), 1–10. DOI:https://doi.org/10.1007/978-3-319-07221-0_1.
- Paquette, L. et al. 2014. Towards Understanding Expert Coding of Student Disengagement in Online Learning. Proceedings of the 36th annual cognitive science conference (2014), 1126–1131.
- Paquette, L. et al. 2020. Who’s learning? Using demographics in EDM research. Journal of Educational Data Mining. 12, 3 (2020), 1–30. DOI:https://doi.org/10.5281/zenodo.4143612.
- Paquette, L. and Baker, R.S. 2017. Variations of Gaming Behaviors Across Populations of Students and Across Learning Environments. Proceedings of the 18th International Conference on Artificial Intelligence in Education. (2017), 274–286. DOI:https://doi.org/10.1007/978-3-319-61425-0_23.
- Pedregosa, F. et al. 2011. Scikit-learn: Machine Learning in Python. Journal of Machine Learning Research. 12, (2011), 2825–2830. DOI:https://doi.org/10.1007/s13398-014-0173-7.2.
- Richey, J.E. et al. 2021. Gaming and Confrustion Explain Learning Advantages for a Math Digital Learning Game. Artificial Intelligence in Education. (2021), 342–355. DOI:https://doi.org/10.1007/978-3-030-78292-4_28.
- Sabourin, J. et al. 2012. Predicting Student Self-regulation Strategies in Game-Based Learning Environments. Intelligent Tutoring Systems. (2012), 141–150. DOI:https://doi.org/10.1007/978-3-642-30950-2_19.
- Sao Pedro, M.A. et al. 2013. Leveraging machine-learned detectors of systematic inquiry behavior to estimate and predict transfer of inquiry skill. User Modeling and User-Adapted Interaction. 23, 1 (Mar. 2013), 1–39. DOI:https://doi.org/10.1007/s11257-011-9101-0.
- Schooler, J.W. et al. 1993. Thoughts Beyond Words: When Language Overshadows Insight. Journal of Experimental Psychology: General. 122, 2 (1993), 166–183. DOI:https://doi.org/10.1037/0096-3445.122.2.166.
- Segedy, J.R. et al. 2015. Using Coherence Analysis to Characterize Self-Regulated Learning Behaviours in Open-Ended Learning Environments. Journal of Learning Analytics. 2, 1 (May 2015), 13–48. DOI:https://doi.org/10.18608/jla.2015.21.3.
- Smith, T.F. and Waterman, M.S. 1981. Identification of common molecular subsequences. Journal of Molecular Biology. 147, 1 (Mar. 1981), 195–197. DOI:https://doi.org/10.1016/0022-2836(81)90087-5.
- Taub, M. et al. 2014. Can the use of cognitive and metacognitive self-regulated learning strategies be predicted by learners’ levels of prior knowledge in hypermedia-learning environments? Computers in Human Behavior. 39, (Oct. 2014), 356–367. DOI:https://doi.org/10.1016/j.chb.2014.07.018.
- Walonoski, J.A. and Heffernan, N.T. 2006. Prevention of Off-Task Gaming Behavior in Intelligent Tutoring Systems. International Conference on Intelligent Tutoring Systems (2006), 722–724.
- Weston, C. et al. 2001. Analyzing Interview Data: The Development and Evolution of a Coding System. Qualitative Sociology. 24, 3 (2001), 381–400. DOI:https://doi.org/10.1023/A:1010690908200.
- Wijffels, J. et al. 2017. Package ‘udpipe’.
- Winne, P.H. 2010. Improving Measurements of Self-Regulated Learning. Educational Psychologist. 45, 4 (Oct. 2010), 267–276. DOI:https://doi.org/10.1080/00461520.2010.517150.
- Winne, P.H. 2005. Key Issues in Modeling and Applying Research on Self‐Regulated Learning. Applied Psychology. 54, 2 (2005), 232–238. DOI:https://doi.org/10.1111/j.1464-0597.2005.00206.x.
- Winne, P.H. 2017. Learning Analytics for Self-Regulated Learning. Handbook of Learning Analytics. (2017), 531–566. DOI:https://doi.org/10.18608/hla17.021.
- Winne, P.H. et al. 2019. nStudy: Software for Learning Analytics about Processes for Self-Regulated Learning. Journal of Learning Analytics. 6, 2 (Jul. 2019), 95–106. DOI:https://doi.org/10.18608/jla.2019.62.7.
- Winne, P.H. and Hadwin, A.F. 1998. Studying as Self-Regulated Learning. Metacognition in Educational Theory and Practice. (1998), 277–304.
- Zimmerman, B.J. 2000. Attaining self-regulation: A social cognitive perspective. Handbook of Self-Regulation. (2000), 13–39. DOI:https://doi.org/10.1016/B978-012109890-2/50031-7.
- Zimmerman, B.J. 1990. Self-Regulated Learning and Academic Achievement: An Overview. Educational Psychologist. 25, 1 (Jan. 1990), 3–17. DOI:https://doi.org/10.1207/s15326985ep2501_2.
© 2022 Copyright is held by the author(s). This work is distributed under the Creative Commons Attribution-NonCommercial-NoDerivatives 4.0 International (CC BY-NC-ND 4.0) license.