ABSTRACT
As online learning platforms become more ubiquitous throughout various curricula, there is a growing need to evaluate the effectiveness of these platforms and the different methods used to structure online education and tutoring. Towards this endeavor, some platforms have performed randomized controlled experiments to compare different user experiences, curriculum structures, and tutoring strategies in order to ensure the effectiveness of their platform and personalize the education of the students using it. These experiments are typically analyzed on an individual basis in order to reveal insights on a specific aspect of students’ online educational experience. In this work, the data from 50,752 instances of 30,408 students participating in 50 different experiments conducted at scale within the online learning platform ASSISTments were aggregated and analyzed for consistent trends across experiments. By combining common experimental conditions and normalizing the dependent measures between experiments, this work has identified multiple statistically significant insights on the impact of various skill mastery requirements, strategies for personalization, and methods for tutoring in an online setting. This work can help direct further experimentation and inform the design and improvement of new and existing online learning platforms. The anonymized data compiled for this work are hosted by the Open Science Foundation and can be found at https://osf.io/59shv/.
Keywords
1. INTRODUCTION
The use of online learning platforms has increased rapidly in the past decade [37]. As online learning platforms grow to become a permanent fixture of educational systems, they have the potential to democratize education by providing high quality free or low-cost resources to compliment traditional classroom practices [1]. While in some cases online tutoring has been shown to be at least as effective as traditional in-person educational practices [33, 11, 16], there is still a need to validate the effectiveness of the various methods by which educational content is delivered to students. Placing an emphasis on objectively measuring the effectiveness of these emerging methods through randomized controlled experimentation is essential for ensuring that the quality of educational resources continues to increase.
This study works towards that endeavor by aggregating the results from 50,752 instances of 30,408 students participating in 50 different randomized controlled experiments conducted by various groups of researchers since February, 2019 within the online learning platform ASSISTments. In these experiments, K-12 students were randomized between different conditions as they completed online mathematics assignments. These conditions changed factors such as students’ assignment completion requirements, the format of the tutoring students’ received when struggling with the assigned problems, and the types of interactions students could have within their assignment. While these types of studies have been conducted in ASSISTments before [34, 40], this work goes beyond reporting the results of each individual study, and instead aggregates the results of these studies together, ultimately investigating 19 different research questions across 50 randomized controlled experiments. To achieve this, the following steps were taken.
- Identify the independent measures of every condition in each experiment.
- Normalize the dependent measures of all the experiments so they can be compared to one another.
- Combine the data from different experiments when the research questions of the experiments match.
- Determine the effects of the various experimental instructional interventions using these combined datasets.
The results of this aggregate analysis revealed actionable trends that can contribute to a broader understanding of the effectiveness of different educational interventions, help direct further experimentation, and inform the design and improvement of new and existing online learning platforms.
2. BACKGROUND
2.1 Educational Experiments
Experiments revolving around educational practices have been conducted since the late 19th century [49]. These early experiments, conducted by William James, Edward Thorndike, and Alfred Binet along with others, focused on determining individual differences between students, why they occur, and what methods teachers can employ to improve educational outcomes for them [49]. By the early 20th century, with the increased accessibility of formal education, educational experiments were more focused on improving teaching methods [49] and connecting cognitive psychology to classroom practices [24]. These studies investigated the differences in learning between students of varying socioeconomic levels [7], the effect of increasing student autonomy in the classroom [29], and the value of assessment in learning [21].
In the years following these studies, theories on educational development, classroom practice and structure, and how to approach individual differences between students were developed. In particular, research around effective feedback has proven to increase performance [23], interest in learning [9], as well as increasing students’ abilities to self-regulate their learning [35]. These studies varied in the types of feedback students’ receive [9], level of specificity and frequency [48], level of praise present in the feedback [8], and what types of students benefit the most from certain types of feedback [14]. Data for these studies were collected from classroom observations of verbal feedback, collections of written feedback, and results on written assessments.
2.2 Experimentation within Online Learning Platforms
Computer-assisted instruction in education has been studied since the 1960s [47], results of these early studies show that providing specific, targeted feedback to student responses improves retention of information [19, 43]. In more recent years, educational data mining research has grown significantly, with large scale implementation of online A/B testing in web applications allowing thousands of users to be randomized into conditions simultaneously [3, 5]. With the rapid adoption of computers in the classroom in the past two decades, educational researchers now have access to an abundance of data on students. Online learning platforms track students’ performance, demographics, interactions within the platform, statistics on content usage, feedback, and more [38]. Additionally, during the 2020-2021 school year many schools that had not previously used online learning platforms migrated to online learning platforms as a result of the COVID-19 pandemic [28]. This increase in the size and scope of available data has made it possible to gain insights into educational practices that were not previously possible with traditional methods.
Recent studies have focused on predicting student outcomes, improving domain specific content, examining the effects of different kinds of pedagogical support, and advancing knowledge about how people learn [5]. Similar to early studies on computer-assisted learning, learning analytics research aims to determine what types of feedback and presentations work well for what types of students, in other words, discovering the potential for personalization in online learning platforms [31, 5]. Prior studies on personalization show the benefit of explanatory feedback over corrective feedback for novice students [31], differences in effect of feedback between male and female students [32], and the effects of immediate and delayed feedback for students with different prior knowledge levels [45, 10]. Additionally, by taking advantage of recent advances in data collection, research has been able to focus on determining methods for personalizing based on students characteristics, such as district locale and student interaction data [2] and what types of crowdsourced content is effective for students [39]. This work provides another data-intensive analysis on the effectiveness of different aspects of online learning platforms, but unlike the aforementioned analyses, this work compiled data from dozens of studies performed within an online learning platform instead of focusing on a single study. This revealed trends across experiments that provided deeper insight into the effectiveness of various instructional interventions and online tutor designs.
2.3 ASSISTments and E-TRIALS
The data in this work comes from ASSISTments, an online learning platform that focuses on providing teachers with mathematics content and resources to effectively manage their students. Within ASSISTments, teachers have the option to assign problem sets and skill builders to their students. Problem sets are a series of mathematics problems that must all be completed, in order, to finish the assignment. These problem sets come from various open educational resources for mathematics such as Engage New York, Illustrative Mathematics, and The Utah Middle School Math Project. Skill builders are assignments that focus on a specific mathematics skill. When students complete skill builders they are given a series of problems on the same mathematics skill until they get a specific number of problems correct in a row. Usually students must answer three problems correct in a row to finish the assignment, but this number is configurable by the teacher.
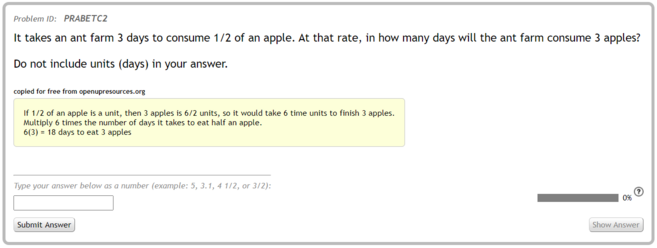
Regardless of whether the student is assigned a problem set or skill builder, they complete their assignment in the ASSISTments tutor [20]. In the tutor, students receive immediate feedback when they submit a response to a problem, which informs them if they are correct [27]. In addition to this immediate feedback, students are able to request tutoring, which is available to them at any point during their completion of a problem regardless of whether or not they have already attempted the problem. Tutoring comes in the form of hints, which are a series of messages the student can request, one at a time, that explain how to solve parts of the problem; explanations, which are full worked solutions to the problem; examples, which are full worked solutions of a similar problem; common wrong answer feedback messages, which explain how to correct a specific error made by the student; and scaffolding, which breaks the problem down into a series of simpler problems that guide the student through how to solve the original problem [27]. These different types of tutoring strategies can come in the form of videos, images, or text. An example of a student receiving a text-based explanation within the ASSISTments tutor is shown in Figure 1. Once students have finished their assignment, teachers are provided with reports that aggregate information such as how each student progressed through the assignment and what the class’ most common mistakes were.
The variety of assignments and tutoring strategies that can be delivered to students through ASSISTments provides opportunities to explore various research questions in learning science, educational psychology, and human-computer interaction. A research test-bed, E-TRIALS (an EdTech Research Infrastructure to Advance Learning Science), was built to deploy randomized controlled experiments in classwork and homework settings at scale within ASSISTments [25]. Since 2005, researchers have been able to create and modify problem sets, skill builders, and tutoring strategies. The modified content contains the original content within it, but adds experimental conditions. For example, a researcher could modify a skill builder for calculating the area of a triangle to randomly provide students with text-based or video-based hints. Teachers assign the modified content as if it were the original, and when teachers assign these modified assignments, students will be randomized (on an individual basis, not at the class level) to one of multiple conditions. This allows researchers to evaluate the impact of different pedagogical decisions on students’ learning [41]. The experiments run in ASSISTments cover a wide scope of research questions that range from whether offering students a choice in the difficulty of their instruction improves learning, to whether providing students with worked examples of similar problems is more effective than direct advice on the problem they are struggling with, to whether changing the number of problems students are required to complete affects their learning [44]. The following analysis of E-TRIALS experiments provides insight into the current state of experimentation within online learning platforms and can help inform the design of future experiments.
3. EXPERIMENT DATASET
The dataset used in this work comes from 50,752 instances of 30,408 unique students who participated in 50 E-TRIALS experiments since February, 2019. In addition to recording the purpose of the experiment, the experimental condition each student was placed in, and the resulting dependent measure, the dataset also includes information on students’ performance within ASSISTments prior to participating in the experiment, the prior performance of the students’ classes, the experience of their teachers, and an indicator of their socioeconomic status. Socioeconomic status is indicated by a student’s school district’s Opportunity Zone status, which is a particular tax classification in the United States of America that indicates whether a region has opportunities for economic growth. The regions in opportunity zones are typically low-income regions with fewer educational resources [15]. The Opportunity Zone status for each student was determined using the domain name of their teacher’s school-provided email address. No demographic information was requested from students using ASSISTments to preserve their anonymity and prevent any bias associated with answering questions on how they identify themselves. The full set of features collected for each participant is shown in Table 1. In addition to containing features for each experiment participant, the dataset contains information on the independent and dependent measures used in the various experiments, which had to be aggregated in order to determine the common trends among the 50 experiments. The details of these independent and dependant measures and how they were aggregated are discussed in Sections 4.1 and 4.2.
| Feature Name | Description |
|---|---|
| Experiment Condition | An indication of which condition students are in. |
| Student Prior Started Skill Builder Count | Number of skill builders previously started by students. |
| Student Prior Skill Builder Percent Completed | Percent of skill builders completed by students. |
| Student Prior Started Problem Set Count | Number of problem sets previously started by students. |
| Student Prior Problem Set Percent Completed | Percent of problem sets completed by students. |
| Student Prior Completed Problem Count | Total number of problems completed by students. |
| Student Prior Median First Response Time | Students’ median time to submit an answer to a problem. |
| Student Prior Median Time On Task | Students’ median time to complete a problem. |
| Student Prior Average Attempt Count | Student’s average attempts required to complete a problem. |
| Student Prior Average Correctness | The fraction of problems students answered correctly. |
| Class Age In Days | The number of days classes existed in ASSISTments. |
| Class Student Count | The number of students in the class. |
| Class Prior Started Skill Builder Count | Number of skill builders previously started by classes. |
| Class Prior Skill Builder Percent Completed | Percent of skill builders started by classes that were completed. |
| Class Prior Started Problem Set Count | Number of problem sets previously started by classes. |
| Class Prior Problem Set Percent Completed | Percent of problem sets started by classes that were completed. |
| Class Prior Completed Problem Count | Total number of problems completed by classes. |
| Class Prior Median First Response Time | Class’ median time to to submit an answer to a problem. |
| Class Prior Median Time On Task | Class’ median time to complete a problem. |
| Class Prior Average Attempt Count | Class’ average attempts required to complete a problem. |
| Class Prior Average Correctness | The fraction of problems classes answered correctly. |
| Teacher Account Age In Days | The number of days teachers have had an ASSISTments account. |
| Experiment Id | The experiment students participated in. |
| Opportunity Zone | The school district’s Opportunity Zone status [15]. |
4. METHODOLOGY
Due to the diversity in research questions, independent and dependent measures, and structure of the experiments, the first step to evaluate their overall trends was to identify similar conditions within multiple experiments. This process involved documenting each condition of each experiment and identifying when different experiments had an identical pair of conditions or the same research question. The second step was to normalize the various dependent measures such that they all represented similar metrics and used the same scale.
4.1 Pooling Experiment Data
To pool experimental data together, similar experiments had to be identified. To do this, every condition from every experiment was documented such that data from multiple experiments that each had an identical pair of conditions or research question could be aggregated. For example, if the following three experiments were run in ASSISTments, then Experiment 1 would have six documented conditions (one condition for each of the hint types for both choice and no choice), Experiment 2 would have two conditions (one for text-based hints and one for video-based hints), and Experiment 3 would have four conditions (one condition for each text color for both choice and no choice).
- Experiment 1: Randomize between A: giving students a choice of no hints, text-based hints, or video-based hints, or B: randomly selecting which type of hint to give them.
- Experiment 2: Randomize between A: text-based hints, or B: video-based hints.
- Experiment 3: Randomize between A: giving students a choice of black or red text color, or B: randomly selecting the text color.
In addition to documenting the conditions for the three experiments, Experiments 1 and 3 would be recorded as having the higher-level research question “Choice vs. No Choice” and Experiment 2 would be recorded as having no higher-level research question. To combine the results of these three experiments, students randomized to the text-based hint option of Condition B of Experiment 1 would be combined with students randomized to Condition A of Experiment 2 and students randomized to the video-based hint option of Condition B of Experiment 1 would be combined with students randomized to Condition B of Experiment 2. These groups would be used to evaluate the overall effect of giving video-based hints compared to text-based hints. Additionally, students randomized to Condition A of Experiments 1 and 3 would be grouped, and students randomized to Condition B of Experiments 1 and 3 would be grouped. These two groups would be used to evaluate the overall effect of offering students a choice.
When performing this aggregation on the real experiments, many experiments were too unique to have similar experimental conditions as other experiments. Additionally, some experiments were created incorrectly in ASSISTments or had broken links to videos, leading students to never be randomized to a condition. Even though 103 experiments have been deployed in ASSISTments since 2019, only 50 had at least one condition similar to a condition in another experiment and were complete enough to be included in the analyses. After parsing through the data and removing poorly structured and broken experiments, the most common research questions were selected for further analysis. Table 2 shows the selected research questions and statistics on the data aggregated to evaluate the research questions. Students were typically divided evenly between the different conditions, but for the research question “Emotion vs. No Emotion”, there were six conditions that included positive emotional content and two conditions that did not include emotional content, which is why about three fourths of students are placed in the treatment condition.
| Research Question | Experiment # | Student # | % in Treatment |
|---|---|---|---|
| 2 Correct for Mastery vs. 3 Correct for Mastery | 4 | 1192 | 0.487 |
| 2 Correct for Mastery vs. 4 Correct for Mastery | 4 | 1165 | 0.475 |
| 2 Correct for Mastery vs. 5 Correct for Mastery | 3 | 846 | 0.483 |
| 3 Correct for Mastery vs. 4 Correct for Mastery | 5 | 2030 | 0.492 |
| 3 Correct for Mastery vs. 5 Correct for Mastery | 4 | 1683 | 0.494 |
| 4 Correct for Mastery vs. 5 Correct for Mastery | 4 | 1681 | 0.495 |
| Example vs. Answer Only | 3 | 765 | 0.467 |
| Explanation vs. Answer Only | 1 | 85 | 0.471 |
| Hint vs. Answer Only | 5 | 1192 | 0.513 |
| Scaffolding vs. Answer Only | 7 | 2010 | 0.546 |
| Video Example vs. Answer Only | 1 | 366 | 0.484 |
| Video Scaffolding vs. Answer Only | 3 | 1033 | 0.509 |
| Video vs. Text | 5 | 2492 | 0.497 |
| Common Wrong Answer Feedback vs. No Feedback | 2 | 7046 | 0.497 |
| Adaptive vs. Non-Adaptive | 9 | 7754 | 0.498 |
| Fill-In vs. Multiple Choice | 2 | 4057 | 0.493 |
| Choice vs. No Choice | 9 | 12789 | 0.499 |
| Emotion vs. No Emotion | 2 | 1211 | 0.766 |
| Motivational vs. Non-Motivational | 14 | 12243 | 0.581 |
The six research questions containing the phrase “Correct for Mastery” all investigated differences in the requirements to complete a skill builder assignment. In a skill builder, students must correctly answer a specific number of problems in a row to complete the assignment. The different values in these research questions represent the different number of problems students had to get correct in a row before finishing the assignment or completing a posttest. The six research questions that compare something to “Answer Only” investigated how six different tutoring strategies improved student learning compared to just giving struggling students the answer. Table 3 describes each tutoring strategy investigated by these research questions. The other seven research questions are not related to other research questions, but examined different aspects of the structure of assignments and tutoring in online learning platforms.
- Video vs. Text investigated the difference between providing two different types of tutoring which were almost identical, except in one condition the tutoring content was text-based, and in the other condition the same tutoring was provided in a video format.
- Common Wrong Answer Feedback vs. No Feedback investigated the effect of providing students with specific feedback messages when they submitted a common wrong answer to any of the the problems in their assignment.
- Adaptive vs. Non-Adaptive investigated the impact of changing the difficulty of problems based on how well students performed at the beginning of their assignment. Students that got problems correct at the beginning were given more challenging problems than the students that got the beginning problems incorrect.
- Fill-In vs. Multiple Choice investigated the impact of requiring students to write the correct answer in themselves compared to selecting from multiple preset options when answering questions.
- Choice vs. No Choice investigated the impact of allowing students to choose which version of various configurations for their assignments they would complete.
- Emotion vs. No Emotion investigated the impact of including positive emotional phrases and images in the body of the problems in the assignment. For example, an emotional problem would say “Susan excitedly purchased three apples.” instead of “Susan purchased three apples.”.
- Motivational vs. Non-Motivational investigated the impact of interjecting motivational messages and videos into the assignment.
| Tutoring Strategy | Description |
|---|---|
| Example | An explained solution to similar problem. |
| Explanation | An explained solution to the current problem. |
| Hint | Step-by-step advice on how to solve the current problem. |
| Scaffolding | A series of problems that break the current problem into smaller steps with explanations. |
| Video Example | An example recorded in a video instead of text. |
| Video Scaffolding | A scaffolding with explanations recorded in videos instead of text. |
4.2 Normalizing Student Learning
In addition to identifying similar conditions and research questions, the different experiments dependent measures had to be normalized such that the results from one experiment could be compared to another experiment. Normally, it would be very difficult to combine dependent measures from different experiments, but conveniently, all of the experiment in ASSISTments are attempting to increase student learning, and therefore the various dependent measures are just different ways of measuring student learning and can thus be normalized and combined. In the various E-TRIALS experiments, there are five different dependent measures used, described in Table 4.
| Dependent Measure | Frequency of Use | Description |
|---|---|---|
| Problems to Mastery | 44% | # of problems the student completed to get correct in a row. |
| Posttest Score | 44% | % correct on posttest. |
| Learning Gains | 7% | % correct on posttest - % correct on pretest. |
| Assignment Correctness | 3% | # of problems correct / # of problems in condition. |
| Assignment Completion | 1% | Binary indicator for if the student completed the assignment. |
While all of these measures represent student learning, they do not all increase as student learning increases, nor do they all have the same range, nor do they all take into account when a student fails to complete the experimental assignment, which presumably means they learned the least. To rectify these concerns, Table 5 shows the function applied to each of the dependent measures. After is applied to the dependent measures, the values are -scored within each experiment using the pooled standard deviation grouped by experimental condition. This ensured that all of the different measures of learning increased as student learning increased, had the same scale, and accounted for incomplete assignments. These transformations converted all the dependent measures into a measurement of how many standard deviations above or below average each student performed compared to other students that participated in the same experiment. for problems to mastery is particularly complicated because unlike the other dependent measures, problems to mastery goes down the more a student learns, and problems to mastery is bounded in the range . Therefore, to ensure that for problems to mastery increases the more a student learns, problems to mastery was transformed by inverting it, then multiplying it by 3. However, this transformation alters problems to mastery non-linearly, so to correct some of the non-linearity, the square root is taken, which makes appear linear in the range where most of the results lie.
| Dependent Measure | |
|---|---|
| Problems to Mastery | 0 if incomplete else |
| Posttest Score | 0 if incomplete else |
| Learning Gains | 0 if incomplete else |
| Assignment Correctness | |
| Assignment Completion |
4.3 Evaluating Differences in Student Learning
To measure the effects of the various experimental treatment conditions, Cohen’s [12] was used to calculate the effect size between the control and treatment conditions for each research question. To test for a difference between treatment and control, we ran ordinary least squares models and examined the associated p-values and 95% confidence intervals of the mean differences between conditions, and used Cohen’s to capture the magnitude of any effect. This model was used to predict normalized student learning based on the experiment condition the student was placed in, the experiment the student participated in, and features of the student, their class, their teacher, and their school district. Including fixed effects for which experiment the student participated in allowed the model to associate differences in normalized student learning between experiments with those coefficients, and not the experiment condition coefficient, helping to reduce noise from covariates. The inputs related to students, classes, teachers, and school districts also helped to remove noise from the experiment condition coefficient. For example, students with high prior knowledge performed better on the experimental assignments than students with low knowledge, and by including students’ prior knowledge in the model, the variability in students’ success based on their prior knowledge will be associated with the prior knowledge coefficient, and have a lesser effect on the treatment coefficient. Table 1 contains a full list of the features used to model the effects of the various experimental conditions. The “Experiment Condition” feature was used to determine the 95% confidence interval and -value of the impact of the various experimental instructional interventions. When some features were not available, such as when students that had not previously used ASSISTments participated in the experiments, the missing values were filled using the average value across the data used to fit the model. This limited the extent to which the missing values biased the model’s coefficients.
5. RESULTS
5.1 Different Completion Requirements
Investigating the impact of different mastery requirements for skill builders found that requiring fewer problems led to higher student learning than requiring more problems, but that this effect is mostly due to students not completing the assignment when they were required to answer more problems correct in a row to proceed. Figure 2 shows the effect size and, in parentheses, the -value of the effect of requiring students get different numbers of problems correct in a row. For example, the cell at row two, column three contains the effect size and -value of requiring students get two problems correct in a row instead of three problems correct in a row. Figure 2 only shows significant positive effects when requiring students to complete two problems in a row correctly instead of three, four, or five.
To investigate further, the effect of changing problem completion requirements on assignment completion and the effect of changing problem completion requirements on student learning for only students that completed the assignment were calculated. Figure 3 shows the results of these analyses. Based on these results, there is no statistically significant effects on student learning for students that completed their assignment, regardless of how many problems they had to complete correctly in a row before finishing the assignment. The vast majority of the effects seen in Figure 2 come from more students failing to complete their assignment when having to complete more problems correct in a row. Essentially, when students have to complete more problems they are less likely to complete their assignment, but if students complete their assignment their learning will be unaffected by how many problems they had to complete.
One would expect that if any of these mastery requirements were a meaningful metric for determining if students had learned the material, then there would be a statistically significant difference in students’ learning between students that had to complete above or below a certain number of problems correct in a row. However, this was not the case. These results imply that a more sophisticated method could be necessary to evaluate whether students have mastered the mathematics concepts present in their assignments. It may therefore be advisable to integrate Knowledge Tracing [13] or Performance Factors Analysis [36], which are both effective methods for evaluating students’ mastery of individual skills, into ASSISTments and other online learning platforms.
5.2 Different Tutoring Strategies
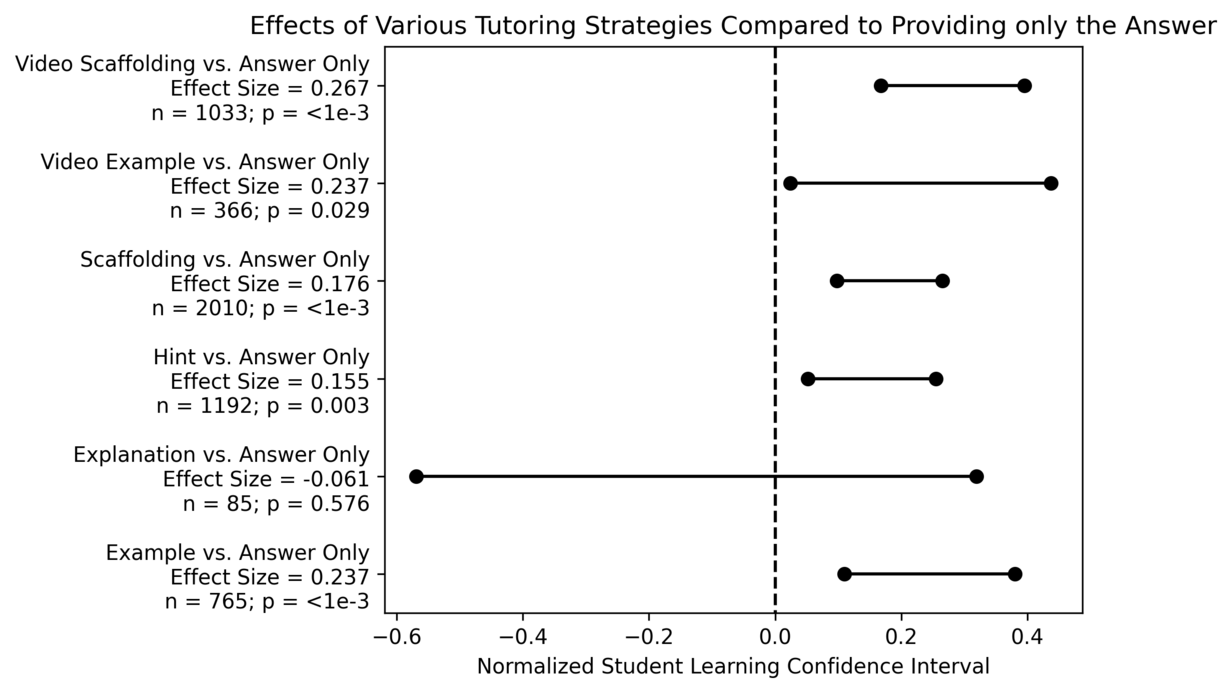
Investigating the effects of different types of tutoring on student learning found that most tutoring is effective, and that giving students tutoring instead of showing them the answer is more effective for low knowledge students than high knowledge students. Figure 4 shows the confidence interval, effect size, number of students, and -value for the effect of giving students each type of tutoring instead of just providing the answer. The only tutoring strategy that had no significant impact on student learning was explanations, which had a wide confidence interval and relatively few participants.
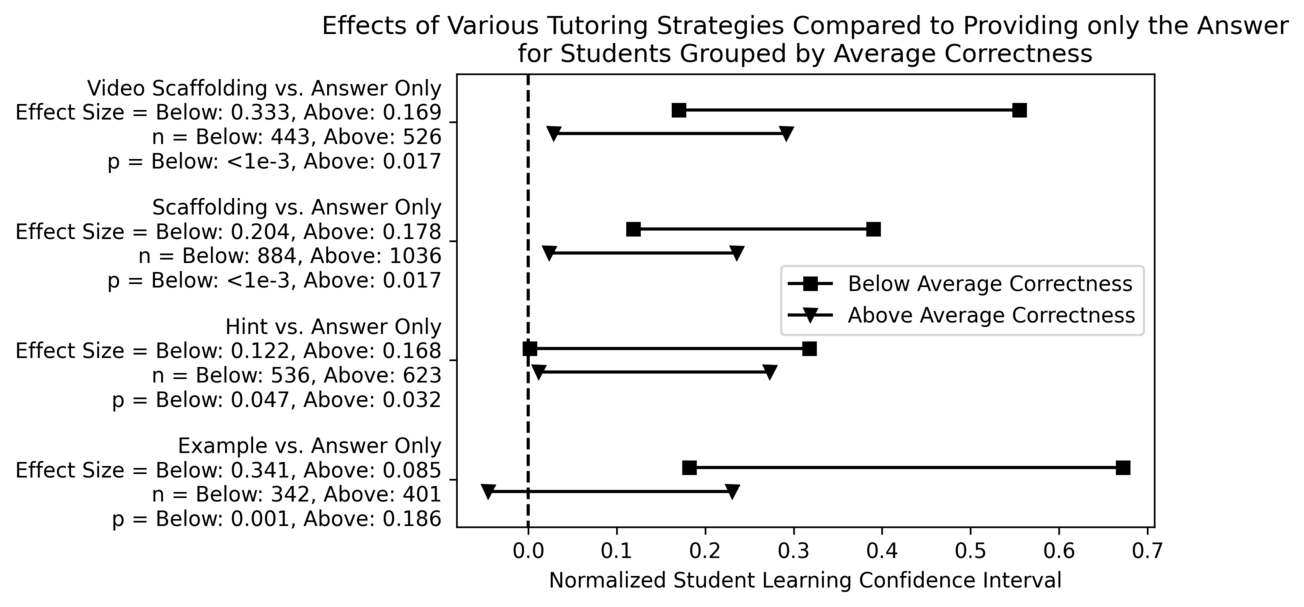
Prior studies done in ASSISTments reported that lower knowledge students benefited more from scaffolding while higher knowledge students benefited more from short explanations [42]. Therefore, in addition to evaluating the effect of each of the above tutoring strategies on all students that participated in the experiments, the data from the experiments were divided into below and above average prior knowledge groups based on whether students’ prior average correctness was above or below the average of all students’ prior average correctness. Figure 5 shows the difference in the effectiveness of four of the six tutoring strategies for each of these groups of students. Only four of the six tutoring strategies from Figure 4 are included in these plots because the other two tutoring strategies were used in experiments that did not have any participants that had used ASSISTments previously, and therefore no prior average correctness was available for those students. The below average prior knowledge students consistently had statistically significant positive effects from being provided with tutoring and greater effect sizes for three out of the four tutoring strategies. These results agree with previous studies on the effectiveness of different tutoring strategies on different groups of students [42]. Additionally, Figure 5 shows that examples had the largest difference in their effectiveness between below and above average prior knowledge students and were the only tutoring strategy that had a statistically significant positive effect for below average prior knowledge students, but not for above average prior knowledge students.
Disparities in education, particularly in math, are often due to unequal access to opportunities to learn from highly qualified educators, otherwise known as the “opportunity gap” [17]. Although online learning platforms cannot replace a highly qualified educator, these results indicate that some online tutoring strategies can support in closing this opportunity gap for the most vulnerable students instead of just helping the more knowledgeable students succeed.
5.3 Other Instructional Interventions
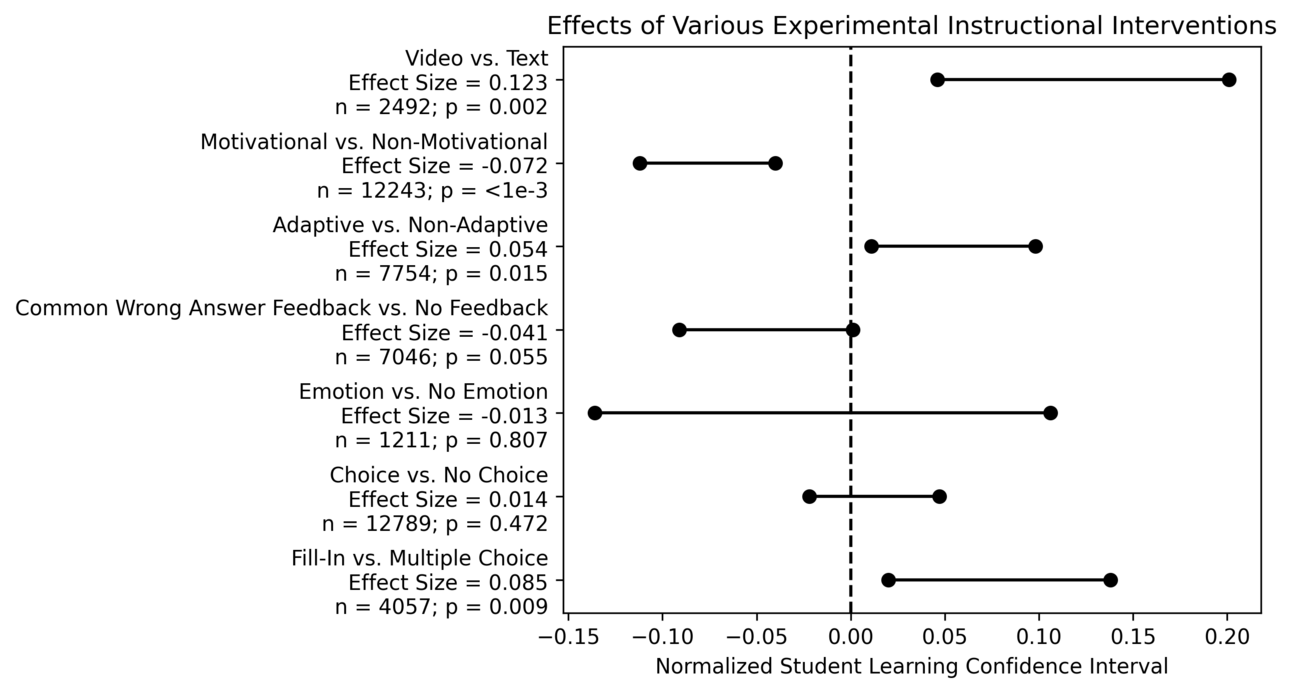
Sections 5.1 and 5.2 covered two groups of related research questions, but there were many other research questions that did not fall into a group. Figure 6 shows the confidence intervals, number of participants, -values, and effect sizes of these research questions. Of the various experiments, the effect of giving video-based tutoring compared to text-based tutoring had the largest effect size, with students learning more from video-based tutoring than text-based tutoring. This could have been due to videos being more engaging and not requiring students to also be proficient readers. Additionally, giving students mathematics problems with open responses, where they are not given optional answers to choose from, resulted in more learning than when they were given problems with multiple choices. This could have been due to the added difficulty of attempting to answer a problem without knowing what the potential solutions are. Another significant finding was that adapting students’ assignments based on their prior knowledge by altering the material given to them had a statistically significant positive effect, lending support to the idea that learning platforms should personalize students’ learning based on their prior knowledge, which has been found to be true in various studies and meta-analyses [42, 26]. Lastly, it was found that motivational messages have a negative impact on students’ learning. This could be a result of students finding the messages distracting. However, students’ perceptions of the messages were not recorded as part of these experiments, and follow-up experiments should be performed to investigate further.
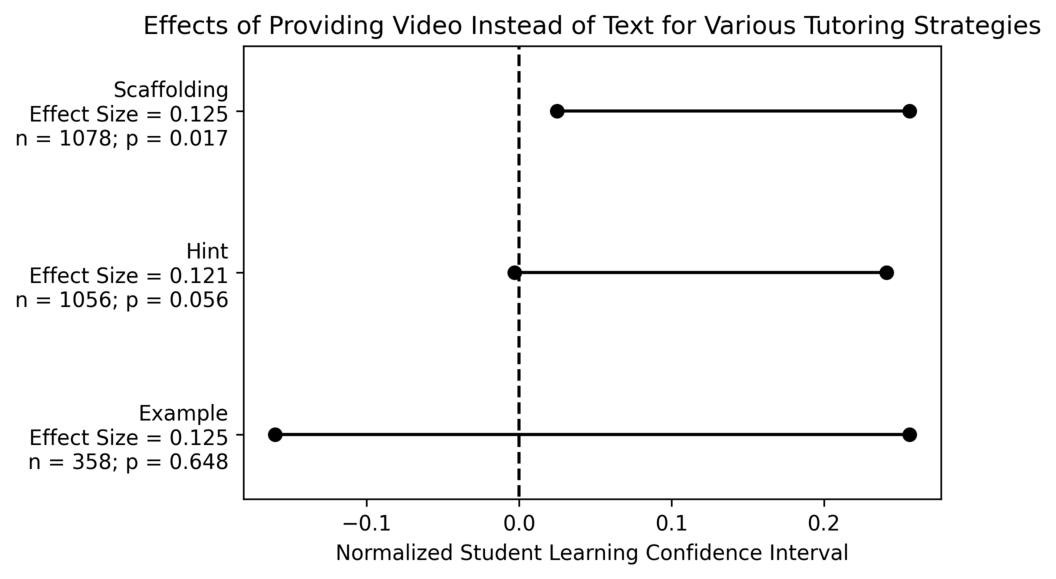
5.3.1 Video vs. Text
Although providing students with video-based tutoring instead of text-based tutoring resulted in an overall positive effect for all types of tutoring, it is possible this was due to a particularly large impact of receiving video instead of text for one type of tutoring strategy. Figure 7 shows the effect of providing video-based tutoring instead of text-based tutoring for the three types of tutoring strategies that were used in experiments where a video-based and text-based version of the same content was provided to students. Video-based scaffolding had the only significant positive effect on learning compared to a text-based control. Hints and examples had no statistically significant difference in their effectiveness when video-based or text-based. From these results, one can infer that students benefit differently from different types of tutoring being video-based. Scaffolding offers a series of simpler problems to help students understand the problem they are struggling with. It could be that students are more likely to engage with videos that give them necessary context. The scaffolding videos ask students questions that they must solve to move on, without watching the videos, they cannot know what the question is. Students may not be as willing to watch videos that provide relevant, but not entirely necessary information on a problem they must solve.
6. LIMITATIONS
The results in this work help to reinforce a foundation of knowledge on educational experimentation and can be used to influence the next generation of experimentation, but there are two notable limitations to the extent to which these results can be applied in the future. Firstly, the scope of the experiments analyzed in this work is limited to experiments conducted within ASSISTments. It could be that the user interface of ASSISTments effects how beneficial certain instructional interventions are. For example, the way ASSISTments takes away partial credit for some tutoring strategies but full credit for others could impact the generalizability of these findings into a context where there is no scoring of student responses. All of the experiments also take place within skill builder assignments, in which students are given a series of similar problems on the same mathematics topic. The instructional interventions in the experiments analyzed in this work could have different effects on students completing assignments on topics outside of mathematics, or even a variety of mathematics topics within the same assignment. There could also be an issue generalizing these findings to contexts outside of online learning platforms. The differences between different tutoring strategies could be inconsequential if there is a teacher in the room to answer questions, and while the results of these experiments implied that motivational messages had a negative impact on learning, this was likely due to the distracting and impersonal nature of the motivational messages. Previous studies have shown the need for trust between teachers and their students and how this can lead to more motivated and academically successful students [4], but the trusting relationship needed for that impact is unlikely to exist between a student and a website.
Secondly, this work investigates many different research questions using data from a combination of experiments with similar, but not identical designs, which has increased the potential of discovering false positives in the analysis. This should influence the confidence that one has in the results of this work. While the results with effect sizes greater than 0.1 and -values in range of of can likely be trusted, there are many weaker findings that some might consider significant while others may be more critical. By providing the sample sizes, effect sizes, confidence intervals, and -values for every comparison carried out, for all the research questions investigated in this work, others can make an informed decision on the extent to which they should believe each of these findings, and which findings merit follow-up investigations and repeat experiments.
7. CONCLUSION
In this work, data from 50,752 instances of one of 30,408 students participating in one of 50 different experiments on a variety of instructional interventions conducted within ASSISTments were combined to investigate their impact on learning. Using this data, 19 different research questions regarding the effectiveness of these various instructional interventions were investigated, and this investigation revealed multiple actionable findings that can be used to design more effective online learning experiences.
The first insight discovered was that changing the number of problems students must get correct in a row to be considered as having mastered a skill had no impact on the learning gains of the students that were able to complete the assignment, but the more problems required, the more likely students were to stop doing the assignment before mastering the material, which overall decreased their learning gains. Based on this result, when creating mastery-based content, it might be better to use something like Knowledge Tracing [13] to evaluate mastery instead of forcing students to complete a fixed number of problems.
It was also discovered that across multiple experiments, the tutoring provided to students by ASSISTments had almost entirely a positive effect on students’ learning compared to just giving students the answer when they were struggling. This falls in line with the larger findings from cognitive psychology that show students learn more when they productively struggle with solving problems, rather than being provided solutions [6]. Additionally, below average prior knowledge students benefited more from this tutoring overall than above average prior knowledge students, which can help to close opportunity gaps, and for all students, when scaffolding problems were video-based, they had a larger positive impact than when they were text-based. These results could help inform developing platforms on how to allocate limited resources when creating tutoring. For example, creating new tutoring could be prioritized for remedial courses, and the extra effort of making video-based tutoring could be saved for scaffolding.
Another insight from these analyses was that students showed greater learning patterns when they completed open-response questions rather than multiple choice questions. This corroborates some research that finds that memory and learning benefit most from free recall of information (e.g. answering an open-ended question) compared to cued-recall (e.g. multiple-choice items) during learning [22, 30]. Based on this, online learning platforms could move away from multiple choice questions when possible.
This study also found that adjusting students’ assignments based on their prior knowledge level had a positive effect on their learning. This supports the idea that personalized learning can help students. Within ASSISTments, a previous study found that high-knowledge students learned more from explanations, while low-knowledge students learned more from scaffolding [42]. This is one example of how personalization based on prior knowledge within online learning platforms has been found to be effective in the past. Additionally, a meta-analysis of studies that measured the learning gains of students after grouping them by ability level found that the instructional material was more than twice as effective when it was tailored to the students’ ability levels than when it was held constant for all students [26]. The results of this study agree with prior work, and imply that personalizing students’ education based on their prior knowledge increases their learning.
Another interesting result from these experiments was that motivational messages had a negative impact on learning. Past research has found positive effects of motivational interventions for some students, so why might these studies show a negative effect? One speculation is that the motivational videos may have unintentionally produced an effect similar to what is referred to as “seductive details” or highly engaging but unrelated information that is unnecessary for learning [46]. Including seductive details can lead to worse performance both in the classroom and in online learning environments [18], and is theorized to disrupt learning by redirecting attention away from the material and toward superfluous information, stopping students from appropriately allocating cognitive resources to the educational material. Providing motivational videos in the middle of the learning period may have produced a negative effect on learning because it disrupted cognitive processes necessary for learning, but more research is needed to fully investigate this and other possible mechanisms at play.
In addition to these results’ capacity for improving online learning platforms, these results can help inform the next round of experimentation within online learning platforms. Future experiments could continue to investigate the inconclusive findings in this analysis, and expand upon the conclusive findings. For example, more types of problems besides multiple choice and open response problems could be compared to each other, and the effectiveness of different tutoring strategies could be investigated for differences based on subject matter or grade level. Through these analyses, learning platforms can continue to improve their design and increase their positive impact for all students that use them.
8. ACKNOWLEDGMENTS
We would like to thank NSF (e.g., 2118725, 2118904, 19506-83, 1917808, 1931523, 1940236, 1917713, 1903304, 1822830, 1759229, 1724889, 1636782, & 1535428), IES (e.g., R305N21-0049, R305D210031, R305A170137, R305A170243, R305A1-80401, & R305A120125), GAANN (e.g., P200A180088 & P200A150306), EIR (U411B190024 & S411B210024), ONR (N00014-18-1-2768) and Schmidt Futures. None of the opinions expressed here are that of the funders.
9. REFERENCES
- D. Acemoglu, D. Laibson, and J. A. List. Equalizing superstars: The internet and the democratization of education. American Economic Review, 104(5):523–27, 2014.
- S. Adjei, K. Ostrow, E. Erickson, and N. Heffernan. Clustering students in assistments: exploring system-and school-level traits to advance personalization. In The 10th International Conference on Educational Data Mining, pages 340–341. ERIC, 2017.
- R. S. Baker, K. Yacef, et al. The state of educational data mining in 2009: A review and future visions. Journal of educational data mining, 1(1):3–17, 2009.
- A. Bennett, B. L. Bridglall, A. M. Cauce, H. T. Everson, E. W. Gordon, C. D. Lee, R. Mendoza-Denton, J. S. Renzulli, and J. K. Stewart. All students reaching the top: Strategies for closing academic achievement gaps. a report of the national study group for the affirmative development of academic ability. North Central Regional Educational Laboratory, 2004.
- M. Bienkowski, M. Feng, and B. Means. Enhancing teaching and learning through educational data mining and learning analytics: An issue brief. Office of Educational Technology, US Department of Education, 2012.
- E. L. Bjork, R. A. Bjork, et al. Making things hard on yourself, but in a good way: Creating desirable difficulties to enhance learning. Psychology and the real world: Essays illustrating fundamental contributions to society, 2(59-68), 2011.
- J. S. Bruner and C. C. Goodman. Value and need as organizing factors in perception. The journal of abnormal and social psychology, 42(1):33, 1947.
- P. C. Burnett and V. Mandel. Praise and feedback in the primary classroom: Teachers’ and students’ perspectives. Australian Journal of Educational & Developmental Psychology, 10:145–154, 2010.
- R. Butler. Enhancing and undermining intrinsic motivation: The effects of task-involving and ego-involving evaluation on interest and performance. British journal of educational psychology, 58(1):1–14, 1988.
- C. Candel, E. Vidal-Abarca, R. Cerdán, M. Lippmann, and S. Narciss. Effects of timing of formative feedback in computer-assisted learning environments. Journal of Computer Assisted Learning, 36(5):718–728, 2020.
- A. K. Clark and P. Whetstone. The impact of an online tutoring program on mathematics achievement. The Journal of Educational Research, 107(6):462–466, 2014.
- J. Cohen. Statistical power analysis for the behavioral sciences. Academic press, 2013.
- A. T. Corbett and J. R. Anderson. Knowledge tracing: Modeling the acquisition of procedural knowledge. User modeling and user-adapted interaction, 4(4):253–278, 1994.
- K. P. Cross. Feedback in the classroom: Making assessment matter. ERIC, 1988.
- S. Eastman and N. Kaeding. Opportunity zones: What we know and what we don’t. Tax Foundation Fiscal Fact, 630, 2019.
- M. Feng, J. Roschelle, N. Heffernan, J. Fairman, and R. Murphy. Implementation of an intelligent tutoring system for online homework support in an efficacy trial. In International Conference on Intelligent Tutoring Systems, pages 561–566. Springer, 2014.
- A. Flores. Examining disparities in mathematics education: Achievement gap or opportunity gap? The High School Journal, 91(1):29–42, 2007.
- L. Fries, M. S. DeCaro, and G. Ramirez. The lure of seductive details during lecture learning. Journal of Educational Psychology, 111(4):736, 2019.
- D. A. Gilman. Comparison of several feedback methods for correcting errors by computer-assisted instruction. Journal of Educational Psychology, 60(6p1):503, 1969.
- N. T. Heffernan and C. L. Heffernan. The assistments ecosystem: Building a platform that brings scientists and teachers together for minimally invasive research on human learning and teaching. International Journal of Artificial Intelligence in Education, 24(4):470–497, 2014.
- A. T. Jersild. Examination as an aid to learning. Journal of Educational Psychology, 20(8):602, 1929.
- J. D. Karpicke. Retrieval-based learning: A decade of progress. Grantee Submission, 2017.
- A. N. Kluger and A. DeNisi. The effects of feedback interventions on performance: A historical review, a meta-analysis, and a preliminary feedback intervention theory. Psychological bulletin, 119(2):254, 1996.
- D. R. Krathwohl. A revision of bloom’s taxonomy: An overview. Theory into practice, 41(4):212–218, 2002.
- N. J. Krichevsky and K. P. Spinelli. E-trials: Developing a web application for educational research. 2020.
- C.-L. C. Kulik and J. A. Kulik. Effects of ability grouping on secondary school students: A meta-analysis of evaluation findings. American educational research journal, 19(3):415–428, 1982.
- P. McGuire, S. Tu, M. E. Logue, C. A. Mason, and K. Ostrow. Counterintuitive effects of online feedback in middle school math: results from a randomized controlled trial in assistments. Educational Media International, 54(3):231–244, 2017.
- K. V. Middleton. The longer-term impact of covid-19 on k–12 student learning and assessment. Educational Measurement: Issues and Practice, 39(3):41–44, 2020.
- M. Montessori. The advanced Montessori method, volume 1. Frederick A. Stokes Company, 1917.
- B. F. T. Moreira, T. S. S. Pinto, D. S. V. Starling, and A. Jaeger. Retrieval practice in classroom settings: a review of applied research. In Frontiers in Education, page 5. Frontiers, 2019.
- R. Moreno. Decreasing cognitive load for novice students: Effects of explanatory versus corrective feedback in discovery-based multimedia. Instructional science, 32(1):99–113, 2004.
- S. Narciss, S. Sosnovsky, L. Schnaubert, E. Andrès, A. Eichelmann, G. Goguadze, and E. Melis. Exploring feedback and student characteristics relevant for personalizing feedback strategies. Computers & Education, 71:56–76, 2014.
- T. Nguyen. The effectiveness of online learning: Beyond no significant difference and future horizons. MERLOT Journal of Online Learning and Teaching, 11(2):309–319, 2015.
- K. Ostrow and N. Heffernan. Testing the multimedia principle in the real world: a comparison of video vs. text feedback in authentic middle school math assignments. In Educational Data Mining 2014, 2014.
- J. M. Parr and L. Limbrick. Contextualising practice: Hallmarks of effective teachers of writing. Teaching and Teacher Education, 26(3):583–590, 2010.
- P. I. Pavlik Jr, H. Cen, and K. R. Koedinger. Performance factors analysis–a new alternative to knowledge tracing. Online Submission, 2009.
- A. G. Picciano, J. Seaman, P. Shea, and K. Swan. Examining the extent and nature of online learning in american k-12 education: The research initiatives of the alfred p. sloan foundation. The internet and higher education, 15(2):127–135, 2012.
- E. Prihar, A. Botelho, M. Corace, A. Shanaj, Z. Dia, and N. T. Heffernan. Student engagement during remote learning. In Companion Proceedings 11th International Conference on Learning Analytics Knowledge, pages 49–51, 2021.
- E. Prihar, T. Patikorn, A. Botelho, A. Sales, and N. Heffernan. Toward personalizing students’ education with crowdsourced tutoring. In Proceedings of the Eighth ACM Conference on Learning@ Scale, pages 37–45, 2021.
- L. Razzaq and N. T. Heffernan. Scaffolding vs. hints in the assistment system. In International Conference on Intelligent Tutoring Systems, pages 635–644. Springer, 2006.
- L. M. Razzaq, M. Feng, G. Nuzzo-Jones, N. T. Heffernan, K. R. Koedinger, B. Junker, S. Ritter, A. Knight, E. Mercado, T. E. Turner, et al. Blending assessment and instructional assisting. In AIED, pages 555–562, 2005.
- L. M. Razzaq and N. T. Heffernan. To tutor or not to tutor: That is the question. In AIED, pages 457–464, 2009.
- W. Roper. Feedback in computer assisted instruction. Programmed learning and educational technology, 14(1):43–49, 1977.
- D. Selent, T. Patikorn, and N. Heffernan. Assistments dataset from multiple randomized controlled experiments. In Proceedings of the Third (2016) ACM Conference on Learning@ Scale, pages 181–184, 2016.
- M. H. Smits, J. Boon, D. M. Sluijsmans, and T. Van Gog. Content and timing of feedback in a web-based learning environment: Effects on learning as a function of prior knowledge. Interactive Learning Environments, 16(2):183–193, 2008.
- N. Sundararajan and O. Adesope. Keep it coherent: A meta-analysis of the seductive details effect. Educational Psychology Review, 32(3):707–734, 2020.
- P. Suppes et al. Computer-assisted instruction: Stanford’s 1965-66 arithmetic program. 1968.
- L. Voerman, P. C. Meijer, F. A. Korthagen, and R. J. Simons. Types and frequencies of feedback interventions in classroom interaction in secondary education. Teaching and teacher education, 28(8):1107–1115, 2012.
- B. J. Zimmerman and D. H. Schunk. Educational psychology: A century of contributions: A Project of Division 15 (educational Psychology) of the American Psychological Society. Routledge, 2014.
© 2022 Copyright is held by the author(s). This work is distributed under the Creative Commons Attribution-NonCommercial-NoDerivatives 4.0 International (CC BY-NC-ND 4.0) license.