ABSTRACT
In collaborative problem solving (CPS), people’s actions are interactive, interdependent, and temporal. However, it is unclear how actions temporally relate to each other and what are the temporal similarities and differences between successful vs. unsuccessful CPS processes. As such, we apply a temporal analysis approach, Multilevel Vector Autoregression (mlVAR) to investigate CPS processes. Our data were collected from college students who collaborated in triads via a video-conferencing tool (Zoom) to collaborately engage a physics learning game. Video recordings of their verbal interactions were transcribed, coded using a validated CPS framework, and organized into sequences of 10-second windows. Then, mlVAR was applied to the successful vs. unsuccessful CPS sequences to build temporal models for each. A comparison of the models together with a qualitative analysis of the transcripts revealed six temporal relationships common to both, six unique to successful level attempts, and another eight unique to unsuccessful level attempts only. Generally, for successful outcomes, people were likely to answer clarification questions with reasons and to ask for suggestions according to the current game situation, while for unsuccessful CPS level attempts, people were more likely to struggle with unclear instructions and to respond to inappropriate ideas. Overall, our results suggest that mlVAR is an effective approach for temporal analyses of CPS processes by identifying relationships that go beyond a coding and counting approach.
Keywords
1. INTRODUCTION
Collaborative problem solving (CPS) is a process where multiple people pool knowledge, skills, and efforts to solve complex problems [1, 26], and can be an effective approach compared to working individually [27, 28]. For example, in one study, pairs of people performed better than single individuals in discovering scientific laws [27]. In recent decades, CPS has appeared in more and more contexts such as schools [26, 36], online learning [34] and military tasks [41], and is recognized as an essential 21st century skill [1, 26].
But what exactly does CPS ential? Swiecki et al. argued that CPS is an interactive, interdependent, and temporal process [41]. Specifically, a typical CPS process involves two types of interactions: 1) people-task interactions where people interact with the environment or tools to solve problems [3] and 2) people-people interactions where team members interact with each other (e.g. exchanging information or coordinating behavior) to facilitate taskwork [23]. Interdependence refers to the fact that people rely on other people’s contributions to complete tasks, such as incorporating other people’s work/ideas into the solution and getting help from other people [25, 21]. Temporality refers to the fact that actions are produced as a series of inter-connected steps, and the strength of these connections relates to the temporal distance of the actions (the larger the distance, the weaker the connection) [8]. Thus, actions taken by the team at a certain time have an impact on the actions that the team will take in the near future, but this impact diminishes as time goes on. For example, when a question is asked, there is an immediate increase in the likelihood that the question will be answered, but this likelihood decreases as time progresses.
Since CPS is interactive, interdependent, and temporal, people’s behaviors ostensibly affect how tasks will be explored and whether tasks will be completed successfully or unsuccessfully. Emerging research has focused on discovering relationships between team behaviors and problem solving success [42, 1, 17, 6, 39]. However, as reviewed below, most existing work has investigated CPS behaviors independently, without effectively considering the interaction and interdependence between them [42, 1, 17]. This raises the following questions that motivate our work: how do teammates’ behaviors temporally relate to each other and what are the temporal similarities and differences between successful vs. unsuccessful CPS processes?
Further, with rapid development of remote collaboration tools and the high risk imposed by COVID-19 for holding face-to-face meetings, more and more collaborations are carried out remotely. Although remote collaboration has many advantages, it also narrows the communicative bandwidth [29]. For example, gesturing to physical objects is much more complex than in face-to-face communication [40] and certain patterns of social-visual attention (e.g., mutual gaze) are disrupted [43]. Given the necessity and challenges of remote collaboration, we focus on investigating the temporal dynamics of behaviors in remote CPS contexts.
2. RELATED WORK
Our literature review mainly focuses on two aspects of CPS processes related to our study: 1) successful vs. unsuccessful CPS and 2) temporal analysis of CPS behaviors.
2.1 Successful vs. Unsuccessful CPS Processes
Prior research has applied several methods to investigate CPS processes, such as qualitative analysis [2], coding-and-counting [1, 17, 6], and temporal analysis [6, 39]. For qualitative analysis, Barron studied face-to-face collaboration while solving math problems [2] using data from two three-people teams whose verbal interactions during collaboration were coded with three distinct functions: 1) articulation of solutions, 2) repetitions of proposals, and 3) responses to proposals. A qualitative analysis on the conversations revealed that successful CPS exhibited more effective mutual exchanges, better joint engagement, and shared goals.
Coding-and-counting analyses mainly count the occurrence of particular behaviors/actions and relate them to a desired outcome [42, 1, 17, 6, 39]. For example, Tausczik et al. analyzed data from an online mathematical problem solving community (MathOverflow) [42]. They first human-coded the discussion data with five distinct behavioral indicators and then built regression models to discover the association between indicator occurrences and solution quality [42]. Results showed that clarifying questions, critiquing answers, revising an answer and extending an answer significantly predicted solution quality. Similarly, Andrews-Todd et al. applied coding-and-counting to analyze college students’ chat texts generated while collaboratively solving simulated electronics problems [1]. Based on the coded behaviors, they categorized students into four groups by a 2 2 median split - social (high vs. low) cognitive (high vs. low). Analysis results showed that the low social - low cognitive group performed worse than the other three groups. Additionally, having at least one high social - high cognitive student in the team could increase performance.
A few studies applied basic temporal analyses of CPS behaviors in addition to coding-and-counting methods. For example, Hao et al. analyzed CPS skills at the unigram and bigram levels [17]. They manually coded participants’ collaboration chat texts generated while completing simulation-based tasks with four skills: sharing ideas (Share), negotiating ideas (Negotiation), regulating problem solving (Regulation), and maintaining communication (Maintain). Results indicated that at the unigram level (i.e., individual skills), effective CPS processes contained more negotiation than ineffective processes. At the bigram level (e.g., Share-Negotation), effective processes had more share negotiate, negotiate share, regulate share, and negotiate negotiate patterns.
In another study, Chang et al. applied coding-and-counting and lag sequential analysis to examine students’ interactions in simulated CPS scenarios [6]. Participants collaborated as triads (teams of three) via a chat box to solve physics problems. The chat texts were coded based on the Programme for International Student Assessment (PISA) CPS framework [26]. A counting based analysis indicated that successful groups had a high percentage (out of the total number of actions taken by the group) of two actions: 1) monitoring and reflecting on what they have done and 2) discussing the actions to take. Temporal lag sequential analysis showed that some students who engaged in trial-and-error failed to solve the problem in the end, while those demonstrating effective reasoning were more likely to solve the problem successfully. Similarly, Sun et al. applied coding-and-counting together with a pattern analysis approach to examine remote collaboration while students played a physics learning game [39]. Audio recordings of their verbal communications were transcribed and coded based on a validated CPS framework [38]. A coding-and-counting analysis showed that certain actions (e.g. discussing appropriate ideas, confirming understanding) were predictive of success in the game. Pattern analysis examining the co-occurrence of actions within short temporal windows revealed the importance of forming interactive communications among team members to establish common ground and support each other.
In sum, results from prior research suggested that CPS success is associated with both the occurrences of individual actions [2, 42, 1, 17] and connections between actions [17, 6, 39]. However these studies mainly utilized coding-and-counting to examine CPS success [42, 1, 17], and the temporal analyses were limited [17, 6, 39]. Next, we review studies that go beyond basic counts of individual behaviors by investigating temporal relationships of CPS behaviors.
2.2 Temporal Analysis of CPS
Prior work on temporal analyses of CPS has mainly focused on detecting the connections between individual actions from team interaction sequences [19, 7, 41, 9, 30, 22]. For example, Kapur applied lag sequential analysis to discover the most frequent communication patterns that emerged in CPS discussions [19]. Participants in the study coordinated in triads via online text chat to solve physics problems. Two experimental conditions (well-structured vs. ill-structured problems) were compared. The resultant chat texts were coded based on the Functional Category System framework [31]. Then, lag sequential analysis was separately applied to each condition to compute the transition frequency between indicators in consecutive utterance pairs. A comparison of the two resulting models showed that the ill-structured condition had several temporal between-action connections that occurred at least twice as frequently as those in the well-structured condition, whereas the well-structured condition had no such connections. This is a finding that coding-and-counting approaches did not reveal.
Csanadi et al. applied epistemic network analysis to investigate collaboration and thought processes of problem solving [7] and compared it with a coding-and-counting analysis. In that study, pre-service teachers were asked to reason about a pedagogical problem either in pairs or individually (following a think aloud protocol). Audio recordings of the discussions were segmented into propositional units, and coded with eight distinct indicators. Then epistemic network analysis was applied by sliding a window of two utterances on the coded sequences to discover co-occurrences of indicators. Based on the co-occurrence frequencies, a weighted, undirected graph was generated to represent the connections between indicators. A comparison of the networks for dyads and individuals showed that these two conditions had different indicator co-occurrence patterns. Again, the coding-and-counting analysis did not reveal such a finding.
Similarly, Swiecki et al. also applied epistemic network analysis to investigate the verbal interactions between team members in simulated military training scenarios [41]. In that study, 16 Navy air defense warfare teams performed the detect-to-engage sequence, which detects and identifies vessels or tracks, assesses whether tracks are threats, and decides what actions to take. Each team consisted of six roles and the analysis focused on the interactions between the tactical action officer and the other five members. Audio recordings of the verbal interactions were transcribed and coded via an automated coding scheme (nCodeR) [24]. Two conditions using a standard system (control) vs. a decision support system (experimental) were compared. In the epistemic network analysis, a sliding window of 5 utterances was applied to discover the temporal co-occurrence of indicators. Results showed that in the control condition, the tactical action officers frequently sought out information, while in the experimental condition, they mainly contributed information about the tactical situation. Again, the coding-and-counting analysis did not reveal such a finding.
Besides examining coded sequences, researchers have also investigated other types of sequences such as transcripts [9] and log traces [30, 22]. For transcripts, Dowell et al. applied group communication analysis to detect roles that emerged during group collaboration [9]. The analysis relied on computational linguistic techniques to map utterances into a latent semantic space (a n-dimension numerical space) upon which six measures were defined to describe the profile of each individuals’ verbal contributions (e.g. social impact, overall responsivity, newness). Then, k-means clustering was applied to the profiles to detect emerging roles, resulting in six clusters with unique characteristics (e.g. “high social impact, responsiveness, and internal cohesion”). For log trace analysis, Perera et al. used sequential pattern mining to examine the process of competing a group course project for software development [30]. In that study, students collaborated in an online learning environment which logged events of group wiki editing, ticket management, and version changes. The event sequence of each group was then segmented into shorter sequences and sequential pattern mining was used to count the frequency of consecutive events (patterns) for each team. The analyses identified patterns (e.g., “1 version activity by 1 author” followed by “1 ticket activity by 1 author”) that can distinguish the well-performing teams from the ill-performing ones.
2.3 Research Questions and Contributions
As reviewed above, researchers are beginning to uncover the specific behaviors - both individually as well as behavioral sequences - that predict CPS outcomes. Prior studies indicate that there are meaningful and detectable temporal connections between people’s verbal actions (or problem solving actions) in CPS processes [19, 7, 41, 9]. Further, temporal analyses are sometimes more effective than coding-and-counting analyses for understanding collaborations [19, 7]. In the current study, we continue this line of research by utilizing multi-level vector autoregression (mlVAR) for a temporal analysis of CPS behaviors. mlVAR is a network analysis approach that examines temporal connections between actions in consecutive windows via linear mixed-effects models, thereby accounting for clustered/nested data. Specifically, for each variable in window , mlVAR builds a linear model that uses all the variables in the window to predict its value. mlVAR has been successfully applied in many domains, such as patient-physician interactions [16] and symptom-psychopathology interplays [10]. However, to our knowledge, it has yet to be utilized to investigate collaborative problem solving behaviors.
Towards this goal, we analyzed data from a study where students collaborated in triads via video conferencing to play a physics learning game. Next, we transcribed and segmented recordings of students’ verbal communication into utterances, human-coded each utterance based on a validated CPS framework [39] and aggregated the occurrence of indicators with 10-second windows. We then applied mlVAR to the resultant multivariate time series to generate temporal graphs depicting relationships among indicators. Our primary research question is what are the temporal similarities and differences between successful vs. unsuccessful CPS interactions. We investigate this question by building separate mlVAR models for multivariate behavioral sequences associated with successful vs. unsuccessful CPS outcomes (i.e., solving a game level vs. failing to solve a level). Then, we compare the two resultant networks to discover the similarities and differences and conduct a qualitative analysis to further examine what interactions may facilitate CPS and what are the challenges people may face during CPS.
Our work extends existing CPS research in several ways. Whereas temporal approaches have been applied to analyze CPS data, some previous studies only focused on logged system actions rather than verbal communications [30, 22], which provides limited insights into how the collaboration unfolds (e.g. how students share information and negotiate). Of the studies that applied temporal analysis on coded sequences, some only considered the co-occurrence of indicators in a sliding window (e.g. epistemic network analysis), without specifying the direction of the relations [7, 41, 39]. Others only focused on the 1-to-1 temporal connections between variable pairs at time and (e.g. lag sequential analysis) [17, 6, 19], rather than n-to-1 connections as an action can be predicted by multiple prior actions [8, 9].
The approach we use in this work, mlVAR, has a number of desirable statistical properties over other approaches. First, unlike lag sequential analysis, which examines the 1-to-1 temporal connections between variables, mlVAR uses a set of variables at time to predict a variable at time , resulting in n-to-1 temporal connections. This allows it to discover temporal connections fully in context. Second, as a statistical procedure, mlVAR allows for uncertainty quantification of findings through the use of p-values and standard errors. Finally, mlVAR analysis is inherently multilevel, thereby statistically accounting for the fact that CPS data is generally clustered within teams. Failure to take such clustering into account may yield untrustworthy results due to phenomena such as the Simpson’s Paradox [20]. The multilevel nature of mlVAR also allows for the estimation of both team-specific networks and general networks representing the dynamics of the average team. Another novelty is that we employed a quasi-experimental matching procedure to balance the number of successful vs. unsuccessful instances across multiple factors (e.g. school, experimental block, time duration) to factor out their possible impacts. Finally, rather than emphasizing short-term temporal relationships between actions (i.e., using the previous utterance to predict the next), we combined behaviors across short windows spanning an average of three utterances to better capture aspects of the unfolding trialogue (conversations involving three participants).
3. DATA SET
The data were collected as part of a larger study [11] involving collaborative problem solving. Only aspects germane to the present work are reported here.
3.1 Participants
A total of 303 Students (56% female, average age = 22 years) from two large public universities participated in the study. Self-reported race/ethnicity information indicated that 47% of participants were Caucasian, 28% Hispanic/Latino, 18% Asian, 2% Black or African American, 1% American Indian or Alaska Native, and 4% “other”. Students were assigned to 101 triads based on their scheduling availability. Thirty participants from 18 teams indicated they knew at least one person in their team prior to study. Participants were compensated with a $50 Amazon gift card (96%) or course credit (4%) after completing the study.
3.2 CPS Task
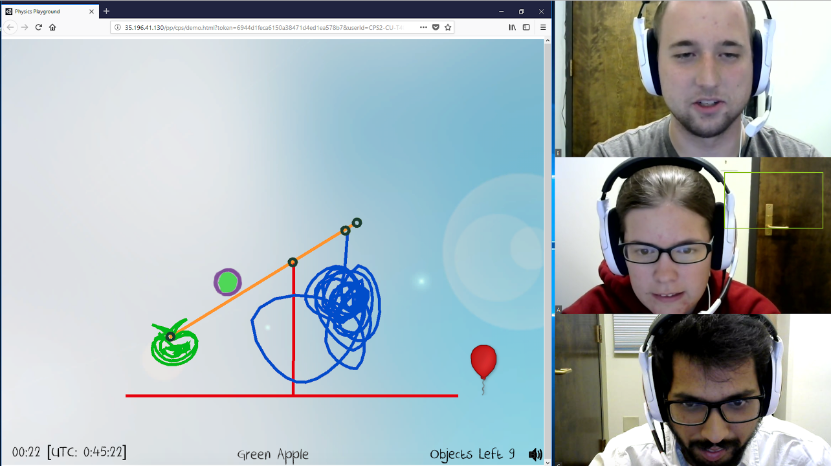
Participants were tasked with collaboratively solving levels in a learning game “Physics Playground” [37], which is designed for young adults to learn Newtonian physics (e.g., Newton’s laws of force and motion). The goal for each level is to create objects and use physics laws to move a ball to a designated target (a red balloon) as shown in Figure 1. Everything in the game obeys basic physics laws (e.g., there is gravity, each object has its own mass). As such, to move the ball in a desired way, students need to use simple machines such as levers and springboards. These, along with other objects (e.g., weights) are drawn using the mouse, upon which the new object becomes “alive” in the game and interacts with other existing objects following basic physics laws. Students can restart (clearing objects) or quit a game level at any time. They receive a gold coin if they solve a level with an optimal solution (i.e., with minimal objects), and they receive a silver coin for a sub-optimal solution (i.e., with more objects). No coin is rewarded for unsolved levels.
The game includes 17 levels covering two physics concepts: “energy can transfer” (EcT, 9 levels) and “properties of torque” (PoT, 8 levels). Each concept contains several subconcepts. For example, kinetic energy and gravitational potential energy belongs to EcT. The 17 levels varied in difficulty (as rated by two physics experts) and the levels were organized into three “playgrounds”, one per block in the study (detailed below). In the navigation page, students can choose a level to enter from the “playground” they are in or view the tutorials that introduce the game mechanics.
3.3 Procedure
The study involved an individual “at-home” part and a collaborative “in-lab” part. Materials (Qualtrics surveys) for the “at-home” part were emailed to students at least 24 hours prior to the lab session. It included several individual difference measures (e.g., prior knowledge, personality), a short tutorial on how to use Physics Playground, a short (around 15-mins) individual practice with the game, and other aspects unrelated to this study.
Students completed the “in-lab” part of the study in triads, using computer-enabled workstations equipped with a webcam and headset microphone. All collaborations occurred via the Zoom video-conferencing tool (as shown in Figure 1), and participants in the same group sat away from each other to avoid in-person interactions. The study involved three 15-min CPS blocks. (There was a fourth block for a different task not analyzed here.) In each block, one person was randomly assigned the role of a controller and the other two were tasked with being contributors. Assignment of the controller role rotated across blocks, so each teammate served as the controller for one of the three blocks. The game was loaded on the controller’s computer, so only the controller could directly interact with the game. The controller’s screen was shared with the contributors using the screen sharing feature of Zoom. Contributors participated in the problem solving process through verbal communications (e.g., proposing ideas, giving instructions).
The first block included five easy-to-medium levels involving a mix of EcT and PoT concepts. After that, all teams completed two 15-min experimental blocks, on either EcT or PoT levels (counterbalanced across teams) and with a specific CPS goal (delivered via verbal and on-screen messages): “solve as many levels as possible” or “get as many gold coins as possible”. The CPS goal and physics concept for the two experimental blocks were within-subjects factors, counter-balanced across teams.
3.4 Coding Collaboration Behaviors
| Facet | Indicator |
|---|---|
| 1) Talks about challenge situations (Situations) | |
| Constructing | 2) Suggests appropriate ideas (ApporIdeas) |
| Shared | 3) Suggests inappropriate ideas (InapporIdeas) [N] |
| Knowledge | 4) Confirms understanding (Confirms) |
| 5) Interrupts others (Interrupts) [N] | |
| 6) Provides reasons to support a solution (Reasons) | |
| 7) Questions/Corrects others’ mistakes (Questions) | |
| 8) Responds to other’s questions/ideas (Responds) | |
| Negotiation | 9) Criticizes, makes fun of, or being rude |
| and | to other (Criticizes) [N] |
| Coordination | 10) Discusses the results (DiscuResults) |
| 11) Brings up giving up the challenge (GivingUp) [N] | |
| 12) Strategizes to accomplish task goals (Strategizes) | |
| 13) Tries to quickly save an almost successful | |
| attempt (Saves) | |
| 14) Asks others for suggestions (AskSuggest) | |
| Maintaining | 15) Compliments or encourages others (Compliments) |
| Team | 16) Initiates off-topic conversation (InitOffTopic) |
| Function | 17 ) Joins in off-topic conversation (JoinOffTopic) [N] |
| 18) Provides instructional support (Instructions) | |
| 19) Apologizes for one’s mistakes (Apologizes) |
We adopted the validated coding scheme developed by Sun et al. [39] to code student’s verbal communications, which includes three main CPS facets: constructing shared knowledge, negotiation/coordination, and maintaining team function. Within each facet, there are several indicators that specify the concrete function(s) of each utterance as shown in Table 1 (see coding examples in Section 5.2). Constructing shared knowledge contains two aspects: a) disseminating knowledge, ideas, and resources among team members and b) establishing common ground for understanding the task and solutions [1, 26, 32]. Negotiation and coordination pertains to reaching a consensus on a solution plan to be carried out, such as dividing labor, resolving conflicts, integrating different perspectives, and monitoring execution [1, 18, 35]. Maintaining team function reflects efforts to maintain a functional team via assuming individual responsibilities, taking initiative, and co-regulation [5, 18, 33]. Most of the indicators in Table 1 describe positive (beneficial) CPS behaviors, and the negative behaviors were marked with N.
Coding was done on machine generated transcripts of students’ verbal communications using IBM Watson’s automatic speech recognition software [14]. IBM Watson both segments the audio into individual utterances and provides transcriptions of the utterances along with word timings. Utterances spoken by the same person within two seconds were merged to address segmentation errors (a 2-sec threshold was selected after considering a range of thresholds). The coders also viewed the video recordings of gameplay during coding to understand the context of students’ interactions, nonverbal behaviors of the group dynamics, and to address speech recognition errors. An utterance was coded with an indicator if it contained evidence of the function described by the indicator. The coders marked the number of occurrences of each indicator per utterance, and multiple indicators could occur for a given utterance (see Table 7 in Section 5.2 for an example). Three trained human coders coded the data. Each received two rounds of training before performing individual coding. After the second round of training, they all reached a high percentage of agreement (89% – 100%) and a high Gwet’s AC1 value (0.91 to 1.00), a measure of interrater reliability specifically designed for cases of high agreement where more traditional metrics like Cohen’s kappa yield unexpected results (sometimes called the paradoxes of kappa [15]).
3.5 Level Matching
Considering that besides collaboration behaviors, other factors such as level difficulty, the physics concept involved, and the problem solving goal (originally designed for other studies and not involved in our analysis) could also affect the problem solving outcome, we used a quasi-experimental matching procedure to factor out their possible impacts on level attempt success in our analysis. Specifically, an initial processing of the game logs yielded 1,164 level attempts (27% gold, 29% silver, and 44% no coin). Then, level attempts shorter than 60s were excluded, resulting in 808 level attempts. We removed short attempts because they are likely to be cases that students were exploring a level to decide whether to attempt it or not.
A preliminary analysis indicated that Energy can Transfer (EcT) levels (18% attempts succeeded, 7% earned a gold coin) were more difficult than Properties of Torque (PoT) levels (63% attempts succeeded, 40% earned a goal coin). To ensure a sufficient number of matches, matches for EcT levels focused on a coin (gold or silver) vs. a no coin comparison, whereas matches for PoT levels focused on gold vs. silver vs. no coin outcomes (i.e., a triplet). Matching was based on the following covariates: 1) school, 2) level identifier, 3) manipulation (i.e., gold coins vs. solve many levels), 4) block number (first or second) for the experimental blocks, and 5) duration of the level attempt. Level attempt duration was constrained to be at most 0.25 standard deviations of the mean duration of all the level attempts. An initial matching (using the “bmatch” function in the R package “designmatch” [46]) yielded 131 level attempt matches (33 Warmup, 69 EcT, and 29 PoT). Given the labor intensive nature of coding, 81 matches were randomly selected from the 131 candidates for analyses. The resulting data set included 209 level attempts: 66 (22 3) Warmup attempts from 47 unique teams, 68 (34 2) EcT attempts from 49 unique teams, and 75 (25 3) PoT attempts from 54 unique teams. A preliminary analysis on the resulting matches revealed that the matching indeed balanced school, manipulation, and block across the outcome groups (coins in this case). These data were coded for the CPS indicators as noted above. In our analysis, the level attempts that resulted in a coin (either gold or silver) were considered as successful attempts, whereas those resulted in no coin were treated as unsuccessful ones.
4. ANALYTICAL METHODS
4.1 Data Organization
Since students collaborated in triads in our studies, we aggregated the utterances into windows spanning an average of three utterances to investigate how their CPS interactions unfolds. We used windows instead of utterance batches for the aggregation because the utterances varied in length and the windows can better balance the amount of information across units in the sequences. To find an appropriate window size, we tested 11 different sizes from 5 seconds to 15 seconds (sample shown in Table 2). As expected, the number of speaker changes (i.e., when the speaker changes between utterance t+1 and t) and number of utterances in each window increased for larger window sizes. We selected the window size of 10 seconds because it has an average of two speaker changes and three utterances in each window, which would accommodate one utterance for each of the three speakers, though windows ranging from 9 to 11 seconds would also have been suitable.
| Size (Seconds) | Speaker changes | Utterances |
|---|---|---|
| 8 | 1.604 (1.531) | 2.559 (1.721) |
| 9 | 1.850 (1.672) | 2.849 (1.853) |
| 10 | 2.087 (1.793) | 3.150 (1.979) |
| 11 | 2.340 (1.940) | 3.457 (2.112) |
| 12 | 2.587 (2.064) | 3.741 (2.240) |
The aggregation sums up the occurrences of each indicator in each window, resulting in sequences of integer vectors. An utterance was assigned to a window if: 1) the center (midpoint) of the utterance lies in the window or 2) it overlaps with the window for more than one second (since the mean utterance duration was 2.08 seconds). Of the 19 indicators, 9 were exceedingly rare, occurring in less that 1 percent of the utterances. Accordingly, we merged these into a miscellaneous other indicator category (OtherIndi). We also grouped the utterances that were not coded with any indicators into a no indicator category (NoIndi). Finally, to reflect changes in the game, we applied a validated motion tracker tool [45] to capture changes in the game area. We used screen motion instead of logs to reflect game state because the logs only recorded the addition/deletion of objects, but not their interactions, and are generally limited for open-ended games where players can draw objects of any shape. The use of screen motion is also more generalizable and has been used in other studies investigating CPS [44]. In sum, our models contained 13 variables (12 indicator-related variables as shown in Table 3 + Screen Motion).
| Facet | Variable | Successful | Unsuccessful |
|---|---|---|---|
| Constructing | Confirms | 0.30 (0.60) | 0.33 (0.60) |
| Shared | ApporIdeas | 0.23 (0.51) | 0.14 (0.41) |
| Knowledge | InapporIdeas | 0.15 (0.43) | 0.21 (0.49) |
| Situation | 0.17 (0.49) | 0.16 (0.49) | |
| Negotiation | Responds | 0.33 (0.63) | 0.31 (0.60) |
| and | Reasons | 0.14 (0.38) | 0.11 (0.34) |
| Coordination | DiscuResults | 0.09 (0.33) | 0.08 (0.30) |
| Maintaining | Instructions | 0.27 (0.60) | 0.33 (0.65) |
| Team | Compliments | 0.20 (0.48) | 0.16 (0.42) |
| Function | AskSuggest | 0.03 (0.17) | 0.04 (0.21) |
| Other | OtherIndi | 0.21 (0.50) | 0.24 (0.54) |
| Variables | NoIndi | 1.22 (1.31) | 1.31 (1.30) |
We conducted a few additional data processing steps prior to constructing the models. First, sequences shorter than 150s were excluded to ensure that each sequence has at least 13 transitions for our 13-variable models (detailed below). Second, windows shorter than 5 seconds (50% of normal window length) at the end of the sequences were removed because they were too short to be considered as a complete window, and then the last window of each sequence was removed. The second step removed the last 5 - 15 seconds of each level attempt to alleviate the concern that the language/indicators might have focused on the success or failure of the outcome rather than the problem solving process.
The final data set contains 133 level attempts (82 successful [silver or gold coin] and 51 unsuccessful [no coin]) from 74 matches (detailed in section 3.5). For successful attempts, sequence length ranges from 14 to 85, with an average of 30.82 (SD = 15.93). Each window has 2.03 (SD = 1.79) speaker changes on average, 3.03 (1.89) utterances, and 17.08 (11.78) words. For unsuccessful attempts, sequence length ranges from 15 to 87, with an average of 36.92 (SD = 21.00). Each window has 2.12 (SD = 1.73) speaker changes on average, 3.14 (1.80) utterances, and 18.02 (11.42) words. In both data sets, each sequence has at least 13 transitions (minimal sequence length (14) - 1) for our 13-variable models. Table 3 shows the average number of each indicator per window, showing mean (SD).
4.2 Multilevel Vector Autoregression
Multilevel vector autoregression (mlVAR) is a network analysis method for understanding temporal dynamics between multiple variables nested within multiple higher order clusters (e.g., individuals or teams) [4, 13]. It is multilevel in that linear mixed-effects models are built to examine temporal connections at the individual level while accounting for group differences. Vector autoregression is the process of predicting a vector of variables at time using the same vector at time ( is known as the lag). We utilized the R package “mlVAR” (version 0.5) for all analyses [12].
mlVAR analyzes the relations between temporal vectors by building a series of linear mixed-effects models, each of which uses the vector at time to predict an element of the vector at time , denoted as , where is subject id (in our case, level attempt id), is variable id, and is the length of the vectors (in our case, as we have 13 variables). The mixed-effects models can be described by the following equations:
where is the vector at time forsubject , ; each of is a coefficient vector for the fixed-effects, which associates to ; each of is a random-effects vector, describing the deviation of individual from the fixed-effects ; each of is a residual variable, describing the difference (error) between the model’s prediction and the actual value. Before estimating parameters for the linear mixed-effects models, all the variables are standardized using a z-transformation to ensure that the coefficient values are in the same range and comparable. We set the lag to be 1 as we were interested in fine-grained temporal effects (i.e., between 10-second consecutive windows). We also explored lag 2, but the resulting models had very few connections in them.
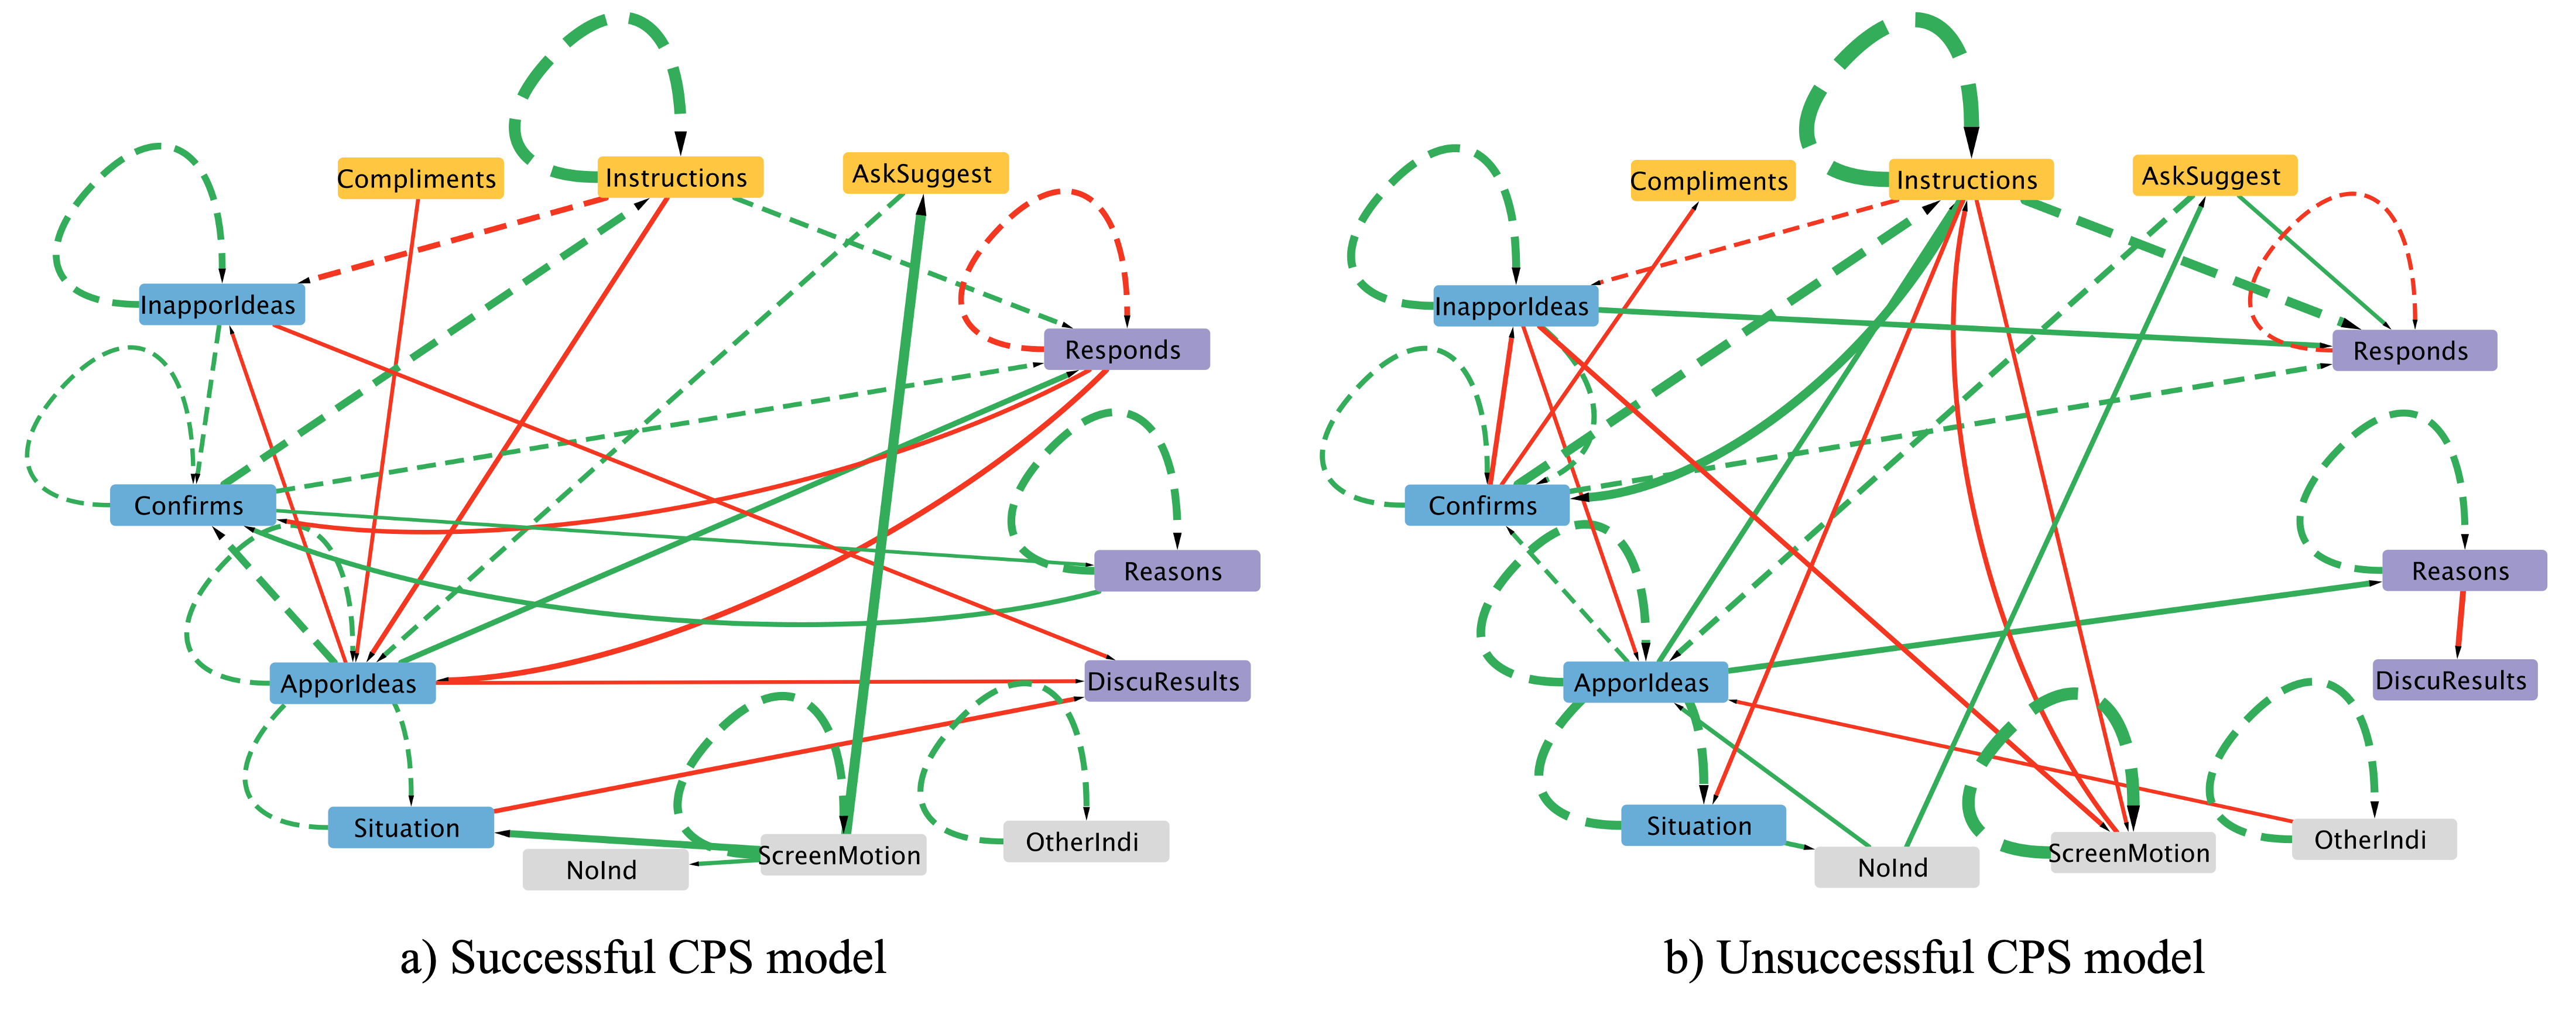
In mlVAR, a temporal connection exists between two variables if the “earlier” one is a significant predictor of the “later” one in the corresponding linear mixed-effects model. We used a p-value of .05 to denote a significant effect as other studies did [16, 10]. The temporal connections between variables can be represented by a directed, weighted graph (network), as shown in Figure 2.
5. RESULTS
Our temporal analysis of CPS processes consists of a quantitative analysis comparing the mlVAR models built on successful vs. unsuccessful level attempts and a qualitative analysis to interpret the patterns in the data.
5.1 mlVAR Analysis
For the successful and unsuccessful outcomes, the linear mixed-effects sub-models in the mlVAR model reached an average root mean squared error of 0.887 (SD = 0.062) and 0.906 (0.045) respectively in our standardized data. Figure 2 shows a comparison of the network for the successful vs. unsuccessful model. Since we are interested in whether there exist temporal connections between indicators rather than how strong the connections are, we treated all the significant connections equally (indicated by the lines in the networks) and did not account for their strength (indicated by line thickness). As we can see, the graphs contain several kinds of relations, including self-loops, positive relations and negative relations. A positive self-loop suggests that the appearance of an action in window informs the appearance of the same kind of actions in window . Generally, positive self-loops indicate that the indicator occurs across multiple consecutive windows. By contrast, a negative self-loop indicates that if an action appears in a window, it is less likely that the same kind of actions will appear in the next window. Given that the self-loops are easy to understand, we do not discuss them further.
Regarding between-indicator relations, most of the negative relations only exist in one of the two models. This is not surprising because actions can be absent for many reasons, such as being replaced by other actions or simply not being appropriate with respect to collaborative discourse (e.g., discussing the challenge situation after receiving a complement) or the stage in the problem solving process. As such, we mainly focus on the positive between-action relations.
| Common |
|---|
| Proposes appropriate ideas Confirms understanding |
| Proposes inappropriate ideas Confirms understanding |
| Confirms understanding Provides instructional support |
| Confirms understanding Responds to other’s questions/ideas |
| Asks others for suggestions Proposes appropriate ideas |
| Provides instructional support Responds to other’s |
| questions/ideas |
| Successful |
| Confirms understanding Provides reasons to support a solution |
| Provides reasons to support a solution Confirms understanding |
| Screen motion Asks others for suggestions |
| Screen motion Talks about challenge situations |
| Screen motion No indicators |
| Proposes appropriate ideas Responds to other’s questions/ideas |
| Unsuccessful
|
| Provides instructional support Confirms understanding |
| Proposes appropriate ideas Provides instructional support |
| Proposes appropriate ideas Provides reasons to support a |
| solution |
| Proposes inappropriate ideas Responds to other’s questions/ |
| ideas |
| No indicators Proposes appropriate ideas |
| No indicators Asks others for suggestions |
| Talks about challenge situations No indicators |
| Asks others for suggestions Responds to other’s questions/ideas |
Table 4 shows a summary of the positive between-action relations, where they were grouped into three categories based on whether they occurred in 1) both models (Common), 2) the successful model only (Successful), and 3) the unsuccessful models only (Unsuccessful). The “Common” category had 6 relations, 4 of which involved “confirms understanding”. Among them, “proposes appropriate ideas” and “proposes inappropriate ideas” were likely to influence “confirms understanding” questions, while “provides instructional support” and “responds to others’ ideas/questions” were likely reactions to “confirms understanding” questions. The other two relations “asks others for suggestions” “proposes appropriate ideas” and “provides instructional support” “responds to others’ ideas/ questions” are ordinary interactions. The common relations suggest that the process of establishing shared understanding via asking and reacting to “confirms understanding” (clarification) questions was common to both successful and unsuccessful level attempts and likely underlies basic collaborative discourse.
Successful model: For the successful level attempts, there was a bidirectional temporal relation between “confirms understanding” questions and “provides reasons to support a solution”. Both reflect efforts to enhance shared understanding and thus the interactions between them may facilitate successful CPS. Importantly, we found that the degree of screen activity (“screen motion”) was a significant temporal predictor for three variables: “asks others for suggestions”, “talks about challenge situations”, and “no indicator utterances”. This suggests that people in successful CPS processes reflected on the current game situation. Among the three relations, “screen motion” “talks about challenge situations” reflects that successful teams were linking what occurred in the game with the underlying challenge situation, which can be considered a form of metacognitive processing. The “screen motion” “no indicator utterances” indicates that people were likely to talk following screen change but the language was not captured by the coding scheme since it might not have been CPS-related discourse. The “screen motion” “asks others for suggestions” suggests that people were likely to ask for suggestions according to the current game state. Ostensibly, this relation connects people to the game and thus may facilitate CPS. The “proposes appropriate ideas” “responds to others’ ideas/questions” reflects that people were likely to express their thoughts towards appropriate ideas, suggesting a form of affirming dialogue.
Unsuccessful model: In the “unsuccessful” model, “confirm understanding” questions were likely to appear following “provides instructional support”. This relation together with the “confirms understanding” “provides instructional support” in the “common” category forms a bidirectional relation, which indicates that people were looping between giving instructions and confirming understanding. This loop suggests that people had difficulty with conveying and understanding instructions accurately.
There were three relations involving proposing ideas, both appropriate and inappropriate. The “proposes inappropriate ideas” “responds to others’ ideas/questions” suggests that people were likely to discuss inappropriate ideas, which is different from the “proposes appropriate ideas” “responds to others’ ideas/questions” in the “successful” model. This contrast suggests that devoting efforts to appropriate ideas rather than inappropriate ideas may help solve the problem. Additionally, “proposes appropriate ideas” was a significant temporal predictor of “provides instructional support” and “provides reasons to support a solution”. Given that providing instructions and reasons both give details to support an idea, these two relations suggest that the proposed ideas, though appropriate, needed further illustration or justification. The “no indicator utterances” (NoInd) were involved in three relations. Since these relations involved communication functions that were not described by the CPS coding scheme, we do not discuss them further. Finally, “asks others for suggestions” was a significant predictor of “responds to others’ ideas/questions”. We noticed that there was a common relation “asks others for suggestions” “proposes appropriate ideas” in both the “successful” and “unsuccessful” models. This suggests that the most common reaction to suggestion requests is directly proposing an idea. Thus, reacting to suggestion requests by simply responding to others, rather than proposing new and task appropriate ideas, reflects that people were unsure about what to say, or how to proceed with solving the problem.
| Example 1: Asking for suggestions after starting a level
| ||
|---|---|---|
| Time | Window | Speech/Actions |
| 40-50 | 1 | [controller actions]: Entered the game and made a few objects, but did not figure out how to |
| solve the level. [Screen motion] value: 0.117 (> 99.32% instances) | ||
| 54-58 | 2 | Controller: Do you guys have any suggestions? [AskSuggest] |
| Example 2: Asking for suggestions after an attempt
| ||
| 490-500 | 46 | [controller actions]: Created a heavy weight and deleted it to spring the ball up, but it did not go |
| high enough. [Screen motion] value: 0.010 (> 78.62% instances) | ||
| 502-504 | 47 | Controller: Should I try it again with, like Bigger? [AskSuggest] |
Example 1: “Confirms understanding” “Provides reasons to support a solution”
| ||
|---|---|---|
| Time | Window | Speech/Actions |
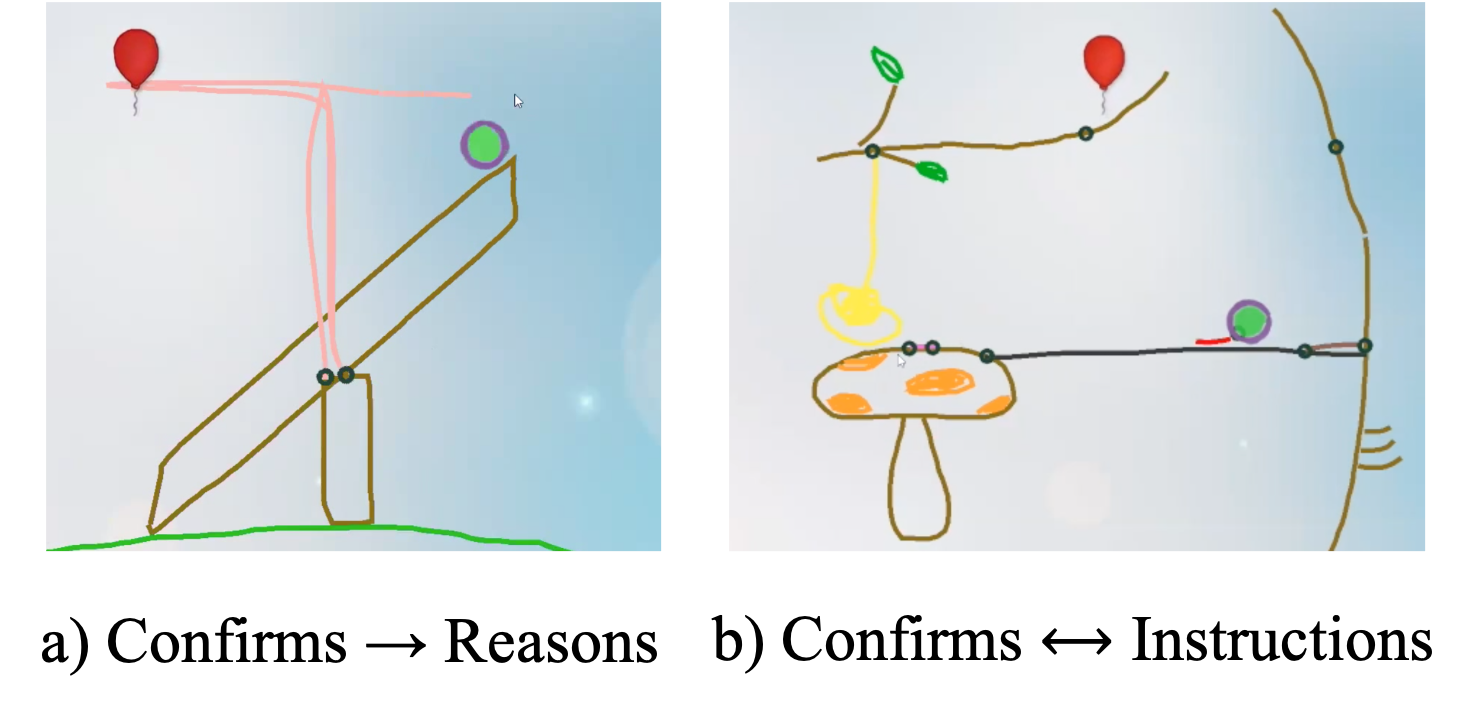
[Scenario]: The ball is dropping repeatedly and the team is trying to figure out how to capture and move it, as shown
| ||
in Figure 3.a. (The key to solve this level is to catch the right timing.)
| ||
| 317-319 | 17 | Contributor1: When you see the ball start to drop, let go. [Instructions] |
| 319-323 | 17 | Controller: To drop and let go? [Confirms] |
| 323-325 | 18 | Contributor1: So when the ball begins falling on the screen- |
| 325-325 | 18 | Controller: Uh-huh. |
| 325-328 | 18 | Contributor1: Then stop drawing, [Instructions] ’cause that’s when it’ll start to fall. [Reasons] |
| 328-329 | 18 | Controller: Okay. (silence) [Responds] [in-game action: the controller then solved the level] |
Example 2: “Provides reasons to support a solution” “Confirms understanding”
| ||
[Scenario]: The team is trying to rotate an object.
| ||
| 392-410 | 18-19 | Contributor1: Oh. I would maybe try to put... now, um, get rid of those dots and um, put a new |
| dot where um, the tip is. [ApporIdeas] So it could like move more forward. [Reasons] | ||
| 410-411 | 19 | Controller: Like here? [Confirms] [in-game action: pointed to a position using mouse] |
| 411-417 | 19 | Contributor1: Um, yeah. Like how you connected them. Connect them again at like, the bottom |
| of the thing. [Instructions] | ||
| Time | Window | Speech/Actions |
|---|---|---|
[Scenario]: One contributor is trying to convey the idea of using a springboard to bounce the ball up (see Figure 3.b).
| ||
| 281-291 | 26-27 | Contributor1: Like, put it like under. Actually no, I feel like that’s too...No like, you have to like |
| connect and like, and like, put it underneath. [Instructions] Like you feel- | ||
| 291-292 | 27 | Contributor2: What? (laughs). [Confirms] |
| 292-307 | 27-28 | Contributor1: Like, connect the two dots, then like put it under the ball. [Instructions] Because like, |
| you’re going to delete that black line [Instructions] and then it’s going to fall on the...i-it’s going to | ||
| end up falling on the bouncy board and hopefully go up. [Reasons] | ||
| 307-308 | 28 | Controller: Oh, wait. So go like this? [Confirms] [in-game action: drew a short line that connected |
| two dots, but still did not make a springboard] | ||
| 308-312 | 29 | Contributor1: Yeah, and then make it go under, don’t hit that...um black. [Instructions] |
| 312-313 | 29 | Controller: Huh? [Confirms] |
| 313-313 | 29 | Contributor2: What? [Confirms] |
| 313-318 | 29 | Contributor1: Yeah, make it just, make it go under, like the black and under the ball. [Instructions] |
| ... ... | ||
5.2 Qualitative Analysis
To further interpret the temporal patterns revealed by mlVAR analysis, we conducted a qualitative analysis to examine what actually happened behind the patterns. Given the page limit, we focused on two important CPS factors: 1) establishing shared understanding, and 2) linking people to the game. As discussed above, shared understanding was often established via asking and reacting to “confirms understanding” (clarification) questions. Thus, we examined the temporal differences that involved “confirms understanding”: 1) “confirms understanding” “provides reasons to support a solution” in the “successful” model and 2) “confirms understanding” “provides instructional support” in the “unsuccessful” model. The link between people and game was reflected by “screen motion” involved connections. Among the three such relations (all in the “successful” model), the “screen motion” “talks about challenge situations” was easy to understand and “screen motion” “no indicator utterances” involved language that was not captured by our coding scheme. Thus, we examined only the “screen motion” “asks others for suggestions”.
Table 5 shows two typical scenarios for the “screen motion” “asks others for suggestions”, showing the time in the block in seconds (Time), order of the window in the level attempt sequence (Window), and the speech/actions that occurred in the window. In example 1, the controller asked for suggestions right after a level started, where a screen refresh resulted in a large screen motion. In example 2, the controller asked for suggestions after a failed attempt that contains a series of large in-game motions. These examples revealed that in successful level attempts, controllers were likely to ask for suggestions according to the current game situation.
Next, we investigate the bidirectional relation “confirms understanding” “provides reasons to support a solution”. An examination of the coded sequences showed that in most cases, these two relations exist independent of each other, rather than form a semantically connected loop. So, we investigate each of them independently as shown in Table 6. In the “confirms understanding” “provides reasons to support a solution” example, a contributor answered the controller’s clarification question with an instruction and a reason to clarify its purpose (to catch the right timing, which is the key to solve the level). This suggests that in successful CPS processes, people were likely to answer clarification questions with reasons. In the “provides reasons to support a solution” “confirms understanding” example, a contributor proposed an idea to move the object, and gave a reason to clarify the goal, but the controller did not fully understand the idea and asked a clarification question. This relation does not align with our intuition that providing reasons increases clarity and reduces confusion. A potential explanation is that reasons were used conditionally on unclear or complex ideas, rather than unconditionally or randomly on all ideas. However, more investigations are needed to understand how reasons were provided.
An examination of the coded sequences for the bidirectional relation “confirms understanding” “provides instructional support” showed that there exist many cases where these two relations were semantically connected, forming a loop. Table 7 shows an example of it, where we can clearly see that Contributor1’s unclear instructions repeatedly confused both the other two people and raised clarification questions. Note that the examples in Table 6 and Table 7 indicated that semantic connections do exist between utterances that are not in consecutive order. This suggests that aggregating utterances with windows is a valid way to examine the temporal relations between actions.
6. DISCUSSION
This work applied multilevel vector autoregression (mlVAR) to investigate the temporal similarities and differences in verbal behaviors between successful vs. unsuccessful collaborative problem solving (CPS) outcomes. The remainder of this section discusses the main findings, applications, limitations and future work.
Main findings Our comparison of the “successful” vs. “unsuccessful” model together with a qualitative analysis revealed six between-action temporal relationships common to both, six unique to successful level attempts, and another eight unique to unsuccessful level attempts. The common relations suggest that the process of establishing shared understanding via asking and reacting to “confirms understanding” (clarification) questions was common to both successful and unsuccessful level attempts. For successful level attempts, people were likely to answer “confirms understanding” questions with reasons and to ask for suggestions according to the current game situation, while for unsuccessful level attempts, teams were more likely to struggle with unclear instructions and to respond to inappropriate ideas. Next, we discuss why certain behaviors in successful level attempts may facilitate CPS processes and what makes it hard to convey instructions.
Our analysis revealed that controllers in successful level attempts were likely to ask for suggestions according to the current game situation (typically when they got stuck). This behavior may facilitate productive CPS because asking for suggestions can increase other people’s participation. Further, other people’s contributions are more helpful when the controller has no idea about how to solve the level. Additionally, in successful level attempts, people were more likely to answer clarification questions with reasons. As discussed above, this behavior may facilitate CPS because providing reasons enhances the clarity of the ideas/instructions being conveyed.
For unsuccessful level attempts, people were likely to struggle with unclear instructions. From the example in Table 7, we noticed at least two potential reasons for that. First, the team does not have a shared concept of a springboard, and thus Contributor1 had to describe how to make it (“connect the two dots, then like put it under the ball”) and how it works (“it’s going to end up falling on the bouncy board and hopefully go up”). Second, Contributor1 had to describe everything via words, rather than point to the screen directly, which largely reduced the clarity of her descriptions.
Future applications: A potential application of this work is to support the provision of timely CPS feedback in computer supported collaboration environments. For example, when a “confirms understanding” “provides instructional support” loop is detected, the system could send an interactive message to the team asking whether people are struggling with conveying clear instructions. If so, the system can provide suggestions such as describing the high level idea rather than low level actions. Another potential application is to provide CPS analytics for people to inspect their collaboration behaviors and improve CPS skills.
Limitations and future work: A limitation of our work is that we aggregated the data with 10-second windows, and thus the mlVAR analysis only effectively captures the connections between two consecutive windows. Connections with a short or longer temporal distance cannot be effectively discovered. Future studies could aggregate the data with different window sizes and see what other temporal patterns can be found. The second limitation is our data were collected in a specific lab setting where triads collaborated via video conferencing to play a physics learning game. Thus, it is unclear whether our findings can be generalized to other collaboration scenarios (e.g. real-world activities, face-to-face coordination). Third, we did not account for people’s roles in our analysis (due to limited sample size). Roles can largely influence people’s actions (e.g. only contributors “provide instructional support”), and therefore taking roles into account may provide more insights into the CPS processes. Finally, we did not compare mlVAR with other temporal analysis approaches (e.g. lag sequential analysis) to see whether they would generate similar or different insights. This is a potential future research direction.
7. ACKNOWLEDGMENTS
This research was supported by the NSF National AI Institute for Student-AI Teaming (iSAT) (DRL 2019805) and NSF DUE 1745442/1660877. The opinions expressed are those of the authors and do not represent views of the funding agencies.
8. REFERENCES
- J. Andrews-Todd and C. M. Forsyth. Exploring social and cognitive dimensions of collaborative problem solving in an open online simulation-based task. Computers in human behavior, 104:105759, 2020.
- B. Barron. Achieving coordination in collaborative problem-solving groups. The journal of the learning sciences, 9(4):403–436, 2000.
- C. A. Bowers, C. C. Braun, and B. B. Morgan Jr. Team workload: Its meaning and measurement. In Team performance assessment and measurement, pages 97–120. Psychology Press, 1997.
- L. F. Bringmann, N. Vissers, M. Wichers, N. Geschwind, P. Kuppens, F. Peeters, D. Borsboom, and F. Tuerlinckx. A network approach to psychopathology: new insights into clinical longitudinal data. PloS one, 8(4):e60188, 2013.
- E. Care, C. Scoular, and P. Griffin. Assessment of collaborative problem solving in education environments. Applied Measurement in Education, 29(4):250–264, 2016.
- C.-J. Chang, M.-H. Chang, B.-C. Chiu, C.-C. Liu, S.-H. F. Chiang, C.-T. Wen, F.-K. Hwang, Y.-T. Wu, P.-Y. Chao, C.-H. Lai, et al. An analysis of student collaborative problem solving activities mediated by collaborative simulations. Computers & Education, 114:222–235, 2017.
- A. Csanadi, B. Eagan, I. Kollar, D. W. Shaffer, and F. Fischer. When coding-and-counting is not enough: using epistemic network analysis (ena) to analyze verbal data in cscl research. International Journal of Computer-Supported Collaborative Learning, 13(4):419–438, 2018.
- A. Deppermann and S. Günthner. Temporality in interaction, volume 27. John Benjamins Publishing Company, 2015.
- N. M. Dowell, T. M. Nixon, and A. C. Graesser. Group communication analysis: A computational linguistics approach for detecting sociocognitive roles in multiparty interactions. Behavior research methods, 51(3):1007–1041, 2019.
- O. V. Ebrahimi, J. Burger, A. Hoffart, and S. U. Johnson. Within-and across-day patterns of interplay between depressive symptoms and related psychopathological processes: a dynamic network approach during the covid-19 pandemic. BMC medicine, 19(1):1–17, 2021.
- L. Eloy, A. EB Stewart, M. Jean Amon, C. Reinhardt, A. Michaels, C. Sun, V. Shute, N. D. Duran, and S. D’Mello. Modeling team-level multimodal dynamics during multiparty collaboration. In 2019 International Conference on Multimodal Interaction, pages 244–258, 2019.
- S. Epskamp, M. K. Deserno, and L. F. Bringmann. mlVAR: Multi-Level Vector Autoregression, 2021. R package version 0.5.
- S. Epskamp, L. J. Waldorp, R. Mõttus, and D. Borsboom. The Gaussian Graphical Model in Cross-Sectional and Time-Series Data. Multivariate Behavioral Research, 53(4):453–480, jul 2018.
- D. A. Ferrucci. Introduction to “this is watson”. IBM Journal of Research and Development, 56(3.4):1–1, 2012.
- K. L. Gwet. Computing inter-rater reliability and its variance in the presence of high agreement. British Journal of Mathematical and Statistical Psychology, 61(1):29–48, 2008.
- L. M. Hamel, R. Moulder, F. W. Harper, L. A. Penner, T. L. Albrecht, and S. Eggly. Examining the dynamic nature of nonverbal communication between black patients with cancer and their oncologists. Cancer, 127(7):1080–1090, 2021.
- J. Hao, L. Liu, A. A. von Davier, and P. C. Kyllonen. Initial steps towards a standardized assessment for collaborative problem solving (cps): Practical challenges and strategies. In Innovative assessment of collaboration, pages 135–156. Springer, 2017.
- F. Hesse, E. Care, J. Buder, K. Sassenberg, and P. Griffin. A framework for teachable collaborative problem solving skills. In Assessment and teaching of 21st century skills, pages 37–56. Springer, 2015.
- M. Kapur. Temporality matters: Advancing a method for analyzing problem-solving processes in a computer-supported collaborative environment. International Journal of Computer-Supported Collaborative Learning, 6(1):39–56, 2011.
- R. Kievit, W. E. Frankenhuis, L. Waldorp, and D. Borsboom. Simpson’s paradox in psychological science: a practical guide. Frontiers in psychology, 4:513, 2013.
- M. Laal. Positive interdependence in collaborative learning. Procedia-Social and Behavioral Sciences, 93:1433–1437, 2013.
- R. M. Maldonado, K. Yacef, J. Kay, A. Kharrufa, and A. Al-Qaraghuli. Analysing frequent sequential patterns of collaborative learning activity around an interactive tabletop. In Educational Data Mining 2011, 2010.
- M. A. Marks, J. E. Mathieu, and S. J. Zaccaro. A temporally based framework and taxonomy of team processes. Academy of management review, 26(3):356–376, 2001.
- C. Marquart, Z. Swiecki, B. Eagan, and D. Shaffer. ncoder, 2018.
- S. Nebel, S. Schneider, M. Beege, F. Kolda, V. Mackiewicz, and G. D. Rey. You cannot do this alone! increasing task interdependence in cooperative educational videogames to encourage collaboration. Educational Technology Research and Development, 65(4):993–1014, 2017.
- OECD. Pisa 2015 collaborative problem-solving framework. organisation for economic co-operation and development. page 131–188, 2017.
- T. Okada and H. A. Simon. Collaborative discovery in a scientific domain. Cognitive science, 21(2):109–146, 1997.
- J. K. Olsen, D. M. Belenky, V. Aleven, and N. Rummel. Using an intelligent tutoring system to support collaborative as well as individual learning. In International conference on intelligent tutoring systems, pages 134–143. Springer, 2014.
- C. O’Malley, S. Langton, A. Anderson, G. Doherty-Sneddon, and V. Bruce. Comparison of face-to-face and video-mediated interaction. Interacting with computers, 8(2):177–192, 1996.
- D. Perera, J. Kay, I. Koprinska, K. Yacef, and O. R. Zaïane. Clustering and sequential pattern mining of online collaborative learning data. IEEE Transactions on Knowledge and Data Engineering, 21(6):759–772, 2008.
- M. S. Poole and M. E. Holmes. Decision development in computer-assisted group decision making. Human Communication Research, 22(1):90–127, 1995.
- J. Roschelle and S. D. Teasley. The construction of shared knowledge in collaborative problem solving. In Computer supported collaborative learning, pages 69–97. Springer, 1995.
- Y. Rosen. Assessing students in human-to-agent settings to inform collaborative problem-solving learning. Journal of Educational Measurement, 54(1):36–53, 2017.
- Y. Rosen, I. Wolf, and K. Stoeffler. Fostering collaborative problem solving skills in science: The animalia project. Computers in Human Behavior, 104:105922, 2020.
- N. Rummel and H. Spada. Learning to collaborate: An instructional approach to promoting collaborative problem solving in computer-mediated settings. The journal of the Learning Sciences, 14(2):201–241, 2005.
- C. Scoular and E. Care. Monitoring patterns of social and cognitive student behaviors in online collaborative problem solving assessments. Computers in Human Behavior, 104:105874, 2020.
- V. Shute, R. Almond, and S. Rahimi. Physics playground (1.3)[computer software]. https://pluto.coe.fsu.edu/ppteam/pp-links/, 2019.
- C. Sun, V. J. Shute, A. Stewart, J. Yonehiro, N. Duran, and S. D’Mello. Towards a generalized competency model of collaborative problem solving. Computers & Education, 143:103672, 2020.
- C. Sun, V. J. Shute, A. E. Stewart, Q. Beck-White, C. R. Reinhardt, G. Zhou, N. Duran, and S. K. D’Mello. The relationship between collaborative problem solving behaviors and solution outcomes in a game-based learning environment. Computers in Human Behavior, 128:107120, 2022.
- D. Suthers, L. Girardeau, and C. Hundhausen. Deictic roles of external representations in face-to-face and online collaboration. In Designing for change in networked learning environments, pages 173–182. Springer, 2003.
- Z. Swiecki, A. R. Ruis, C. Farrell, and D. W. Shaffer. Assessing individual contributions to collaborative problem solving: a network analysis approach. Computers in Human Behavior, 104:105876, 2020.
- Y. R. Tausczik, A. Kittur, and R. E. Kraut. Collaborative problem solving: A study of mathoverflow. In Proceedings of the 17th ACM conference on Computer supported cooperative work & social computing, pages 355–367, 2014.
- H. Vrzakova, M. J. Amon, M. Rees, M. Faber, and S. D’Mello. Looking for a deal? visual social attention during negotiations via mixed media videoconferencing. Proceedings of the ACM on Human-Computer Interaction, 4(CSCW3):1–35, 2021.
- H. Vrzakova, M. J. Amon, A. Stewart, N. D. Duran, and S. K. D’Mello. Focused or stuck together: multimodal patterns reveal triads’ performance in collaborative problem solving. In Proceedings of the tenth international conference on learning analytics & knowledge, pages 295–304, 2020.
- J. K. Westlund, S. K. D’Mello, and A. M. Olney. Motion tracker: Camera-based monitoring of bodily movements using motion silhouettes. PloS one, 10(6):e0130293, 2015.
- J. R. Zubizarreta, M. J. R. Zubizarreta, and G. SystemRequirements. Package ‘designmatch’. Matched Samples that are Balanced and Representative by Design Version 0.3. 0, 2018.
© 2022 Copyright is held by the author(s). This work is distributed under the Creative Commons Attribution-NonCommercial-NoDerivatives 4.0 International (CC BY-NC-ND 4.0) license.