ABSTRACT
In Automated Essay Scoring (AES) systems, many previous works have studied group fairness using the demographic features of essay writers. However, individual fairness also plays an important role in fair evaluation and has not been yet explored. Initialized by Dwork et al. [10], the fundamental concept of individual fairness is “similar people should get similar treatment”. In the context of AES, individual fairness means that “similar essays should be treated similarly”. In this work, we propose a methodology to measure individual fairness in AES. The similarity of essays can be computed using the distance of the text representation of essays. We compare several text representations of essays, from the classical text features, such as BOW and TF-IDF, to the more recent deep-learning-based features, such as Sentence-BERT and LASER. We also show their performance against paraphrased essays to understand if they can maintain the ranking of similarities between the original and the paraphrased essays. Finally, we demonstrate how to evaluate the performance of automated scoring systems models with regard to individual fairness by counting the number of pairs of essays that satisfy the individual fairness equation and by observing the correlation of score difference with the distance of essays. Our analysis suggests that the Sentence-BERT, as the text representation of the essays, and Gradient Boosting, as the score prediction model, provide better results based on the proposed individual fairness evaluation methodology.
Keywords
1. INTRODUCTION
Automated Essay Scoring (AES) systems have been widely used in a vast number of educational institutions [25, 26]. However, there is a growing concern about the fairness issues in such a system so that no student should be treated unfairly [4, 5, 7, 16]. In recent years, many research studies have explored group fairness in AES with respect to demographic features, gender, race, socioeconomic status, and nationality of the writers [16]. Bridgeman et al. [4] studied the fairness of the essay scoring tool e-rater, and observed that in some cases, human and e-rater scores were incomparable across some subgroups. In particular, students’ essays from China tend to get higher scores from e-rater than from humans. The authors also mentioned that the rankings of subgroups would be different if machine scores were substituted for human scores. Additionally, Burstein and Chodorow [5] evaluated essays using the Test of Written English (TWE) and found that Arabic and Spanish speakers received relatively higher scores from humans, while Chinese speakers received higher scores from the machine. Although the differences between various ethnic groups are generally not large, they are still notable in some circumstances. Another study on the fairness of essay scoring system from the Analytical Writing Assessment to six subpopulation groups of GMAT® test takers was conducted in [12]. On the contrary, this study found that none of the subpopulation groups has an unfair advantage and is unfairly punished by the system. In addition, most of the work on automated essay scoring focuses on the effort of maximizing the agreement with the human raters, although human scores, which are treated as the gold standard for training a machine learning model, are not free from bias [1]. For group fairness, the availability of demographic features of the students is mandatory. However, privacy and legal concerns prevent the students’ personal information from being published, which is the main limitation in such works.
Besides group fairness, maintaining individual fairness for each graded essay is also important in AES systems. Initialized by Dwork et al. [10], the fundamental concept of individual fairness is that “similar people should get similar treatment". In the context of AES, this concept is transformed into “similar essays should get similar treatment". To study individual fairness extensively in AES, we propose a methodology to assess the performance of automated scoring systems with regard to individual fairness. In our work, the similarity and dissimilarity of essays are computed using the distance metrics on the textual feature representation of essays. We investigate the performance of several vector representations of the essays, from the classical text features, such as Bag-of-Words (BOW) and Term Frequency - Inverse Document Frequency (TF-IDF), to the more recent deep-learning-based features, such as Sentence-BERT [21] and Language Agnostic Sentence Representation (LASER) [2]. However, these text representations of the essays are numerical vectors, and it is not easy for humans to interpret such results. Therefore, we highlight the importance of defining interpretable essay features, such as answer length, unique word count, spelling errors, and language errors, to help humans judge whether pairs of essays are similar or not.
The similarity score computed using the distance metric on the textual feature representation of the essays assigns a numeric value to each pair of essays, and the number of pairs can be very large. Consider if our dataset contains 1500 data points, then there will be 1,124,250 unique pairs. It makes the job of human evaluators in judging the similarity of each pair practically impossible. Therefore, we present two ways to compare how the distance metrics perform in measuring the essay similarities in the presence of this large number of pairs: firstly, by examining the extreme cases (most similar and most dissimilar essays), and secondly, by using aggregates of features differences. We further assess the quality of the essay vector representations and the distance metric by evaluating their performance against paraphrased essays.
Finally, we assess the performance of automated essay scoring models with regard to individual fairness using the proposed methodology. Firstly, we calculate the percentage of the number of pairs that satisfy the individual fairness equation (described in subsection 5.3.2) and observe that different text features have different distance distributions that affect the fairness results. Secondly, we categorize the essays based on the distance metric and visualize the score difference between different categories of essays. We observe that the score difference of more similar pairs is lower than the score difference of the less similar ones, as expected.
To the best of our knowledge, this is the first work that addresses individual fairness in automated essay scoring systems. The rest of the paper is organized as follows. In Section 2, we discuss the problem statement. In Section 3, we discuss the individual fairness assessment methodology for AES. Sections 4 and 5 cover the experimental settings and evaluation results, respectively. The paper is concluded in the last section with future directions.
2. PROBLEM STATEMENT
In this work, we aim to evaluate individual fairness in Automated Essay Scoring (AES) systems. Individual fairness in AES means that “similar essays should be treated similarly", which raises several fundamental questions as follows.
- 1.
- How to define similar essays?
- (a)
- How to measure similarity between essays? If the similarity is computed using distance metrics on the text representation of essays, which text representation is good enough and which distance metric should be used?
- (b)
- How to make the evaluation of the distance metric interpretable for humans?
- (c)
- Are there any limitations to the text representations of the essays?
- 2.
- How to define individual fairness in AES?
- (a)
- How to define individual fairness in the presence of a large number of pairs of essays?
- (b)
- Can we define individual fairness using the interpretable features of essays?
- 3.
- How to evaluate individual fairness using essays’ similarity? Which machine learning model works best for maintaining individual fairness in essays evaluation?
3. INDIVIDUAL FAIRNESS ASSESSMENT METHODOLOGY FOR AES
To evaluate individual fairness in AES, we propose an end-to-end methodology from (i) selecting the text representation of essays to define the similarity, (ii) evaluating the performance of distance metrics, to (iii) evaluating the performance of the regression models with regard to individual fairness.
- 1.
- Text Representation Selection. To process the essays using a machine learning model, we first need to represent the essays in a vector format. In the field of Natural Language Processing (NLP), there have been proposed many methods to transform a text into a numeric vector, also known as the vector representation of the text. In this paper, we analyze several vector representations of essays, from the classical text feature, such as Bag-of-Words (BOW) and Term Frequency-Inverse Document Frequency (TF-IDF), to the more recent deep-learning-based extracted features, such as Sentence-BERT and LASER.
- 2.
- Distance Metrics Selection. There are many ways to calculate the distance of two vectors, and the most common distance metrics for textual data are cosine distance, Euclidean distance, Manhattan distance, and Jaccard distance. In our study, we choose cosine distance since it performs well for textual data, as shown in previous NLP studies [23, 6, 20].
- 3.
- Evaluate Essay Similarity. To evaluate the similarity of
essays using distance metrics, we propose the following
methods.
- (a)
- Define Interpretable Essay Features. The text representation of an essay, generated using text representation API, provides a numeric vector that is not interpretable for humans. However, it is important that humans can also compare whether two essays are similar or not using interpretable features. Therefore, we define the interpretable essay features, which are discussed in detail in subsection 5.1.1.
- (b)
- Extreme Cases. In the presence of a large number of pairs, it is an impossible task for humans to examine each pair one by one. Therefore, we suggest a method to get a quick understanding of the performance of the distance metrics using the extreme cases based on the distance of essays. In this context, extreme cases are the most similar and the most dissimilar pair of essays. We also visualize the similarity (or dissimilarity) of a pair based on the interpretable essay features.
- (c)
- Aggregate of Features Differences. Analyzing only the extreme cases is insufficient to make a concrete conclusion, as we can not judge the performance of the distance metrics of millions of pairs of essays only based on the nearest and farthest pairs. Therefore, to examine all of the essay pairs, we use aggregated feature differences computed using the normalized feature values. In this paper, we sampled 30,000 pairs of essays from three different similarity groups; lowest distant pairs (most similar), medium distant pairs (moderate similarity), and farthest distant pairs (most dissimilar). In each group, we average the score difference of 10,000 pairs of essays and compare this average score difference of all three groups. We visualize the average difference for different features that also help in understanding the dataset; more details are provided in Section 5.1.3.
- 4.
- Evaluate the Distance Metric against Paraphrased Essays. We further examine whether the text representation of the essays can recognize paraphrased essays and maintain their similarity ranking, as the original essay as well as its corresponding paraphrased essay should be treated similarly by an individual-fair AES system. To simulate this process, we compare the distance metric of the original essays and the paraphrased essays, and compare their similarity ranking. We measure the ranking quality using the Normalized Discounted Cumulative Gain (NDCG) score [13].
- 5.
- Evaluate Individual Fairness. The next step is to evaluate
the performance of the scoring models with regard to the
individual fairness measure. Individual fairness requires
that the distance between two individual essays’ outcomes
is no greater than their distance according to the distance
metric.
- (a)
- Based on the Individual Fairness Equation. We count the number of pairs that satisfy the Lipschitz mapping function by Dwork et al. [10] and represent what percentage of essays follows it.
- (b)
- Score Difference vs. Distance of Essays. We study the correlation of score difference versus the distance of essays based on their text representation, as this is a quick method to check whether similar essays are treated similarly or not. If the system is fair, then the score difference between essays must correlate with their distance in the vector space. The average score difference in the group of similar essays should also be lower than the average score difference in the group of dissimilar essays. The expected condition from the visualization is a left-triangle-shaped (linear increment in score difference as the distance of essays increases) graph for each scoring model.
4. EXPERIMENTAL SETUP
In this section, we introduce the experimental setup used in our work. We discuss the dataset, text representation of essays using several text encoding techniques in NLP, and regression models to predict the score of the essays that we use for the evaluation.
4.1 Dataset
We use the Automated Student Assessment Prize (ASAP) dataset1, hosted by the Kaggle platform, and use the dataset of prompt 7. These essays were written by Grade-7 students. The total number of essays in this prompt is 1569 and had an average length of 187 words. The students were asked to write a story about a time when they were patient or about a time when someone they knew was patient or write a story in their own way about patience. Their answers were graded according to four rubrics: (i) ideas, (ii) organization, (iii) style, and (iv) conventions. Each essay was scored by two human raters on a 0 - 3 integer scale. Final scores were resolved by adding the rubric scores assigned by the human raters, resulting in a resolved rubric score between 0 and 6.
4.2 Text Representation of Essays
We use the following text representation methods for generating the vector feature representation of essays.
4.2.1 Bag-of-Words (BOW)
We first evaluate the performance of the BOW representation of essays in measuring the similarities between them since BOW is one of the classical textual features that has been widely used in NLP. BOW vector is constructed using a set of n-grams from the text. The n-gram is a contiguous sequence of n words from a given text or speech and is extensively used in NLP tasks. Specifically, n-grams are named unigram, bigram, and trigram when is set to be 1, 2, and 3, respectively. In this paper, we generate our BOW features using unigram and bigram. For example, from a sentence ‘Patience is important’, the resulting n-grams are ‘patience’, ‘is’, ‘important’, ‘patience is’, and ‘is important’.
Before creating n-grams, we implemented some text preprocessing techniques on the essays. We removed all non-letter characters and lemmatized the words using WordNet Lemmatizer from NLTK (Natural Language Toolkit) python library [3]. While building the vocabulary for n-grams, we ignored the terms that appear in less than three documents to remove the infrequently used terms. As a result, for each essay, we obtain a feature vector with a length of 14,974.
4.2.2 Term Frequency-Inverse Document Frequency (TF-IDF)
TF-IDF is a statistical measure that evaluates how relevant a word is to a document in a collection of documents. TF-IDF consists of two components, (i) Term Frequency (TF) that measures how frequently a term occurs in a document, and (ii) Inverse Document Frequency (IDF) that diminishes the weight of terms that occur very frequently in the document set and increases the weight of terms that occur rarely. Formally, TF-IDF is defined as follows.
(1)where is the number of occurrence of term in document , and according to the scikit-learn documentation, the is computed as,
(2)where is the total number of documents and is the number of documents that contain term t.
The resulting TF-IDF vectors are then normalized by the Euclidean norm. The effect of adding “1” to the IDF in the equation above is that terms with zero IDF, i.e., terms that occur in all documents, will not be completely ignored. Furthermore, the constant “1” is added to the numerator and denominator of the IDF as if an extra document was seen containing every term in the dataset exactly once, which prevents zero divisions. Before creating the TF-IDF vector, we applied the same text preprocessing techniques on the essays as the Bag-of-Words (BOW) vector. To create the TF-IDF vector, we use the scikit-learn library of TfidfVectorizer [18].
4.2.3 Sentence-BERT
We enrich our experiments by including more recent deep-learning-based features, besides the aforementioned classical text features. Sentence-BERT, which is introduced by Reimers and Gurevych (2019), is a modification of the pre-trained BERT [14] network using Siamese and Triplet network [21]. It converts a sentence into a 768-dimension feature vector and produces semantically meaningful sentence embedding. The embedding results can be used for similarity calculation. The Sentence-BERT representation has been proven to be able to separate the topics in the ASAP dataset very well [9].
4.2.4 Language-Agnostic Sentence Representations (LASER)
LASER was released by Facebook to support multilingual sentence representations to carry out various NLP tasks. They provide an encoder that was trained on more than 90 languages, written in 28 different scripts [2]. LASER includes all European languages, many Asian, Indian, Arabic, and Persian languages, along with numerous minority languages and dialects. All these languages are encoded by the same BiLSTM encoder with a shared BPE (Byte-Pair Encoding) vocabulary. Compared to Sentence-BERT, which produces a 768 length vector, LASER generates a 1024 dimensional sentence vector representation. The pre-trained LASER model is available online2.
4.3 Regression Models & Evaluation Measures
We trained three regression models to predict essay scores: (i) Random Forest, (ii) Gradient Boosting, and (iii) Ridge Regression. We split the dataset into 80% training data and 20% testing data, and train the models using 5-fold cross-validation. We evaluate the performance of these models according to the three measurement criteria defined in [24]: (i) The agreement of scores between the human raters and the computer, which has been a long-established measure of the performance of automated scoring. The agreement is represented by the quadratic weighted kappa (QWK) [8]. (ii) The degradation from human-human score agreement. This measure helps to understand whether the human-automated scoring agreement is lower or higher than the human-human (rater 1 vs. rater 2) score agreement. (iii) The standardized mean score difference between human and automated scores.
5. EXPERIMENTAL RESULTS
In this section, we analyze the individual fairness of essays to answer the problem statements mentioned in Section 2. The fairness analysis is performed by evaluating the performance of different regression models on different text features.
5.1 Evaluating Essay Similarity
5.1.1 Interpretable Essay Features
In our experiment, to understand how the distance metrics perform, we need high-level feature representations of the essays, which make them easy for humans to interpret. We examine the similarity or dissimilarity of a pair of essays using twelve interpretable essay features as implemented by [9], shown in Table 1.
Six out of twelve features of the essays are extracted using EASE (Enhanced AI Scoring Engine) library3, written by one of the winners in the ASAP Kaggle competition. This feature set has been proven to be robust [19]. EASE produces 414-length features, but we exclude the features based on BOW vectors since they are not interpretable essay features. The considered six features are answer length, word counts, average word length, the number of “good" Part of Speech (POS) n-grams, the number of overlapping tokens between the prompt and the answer, and also the number of overlapping tokens between the prompt and the answer but including the synonyms. We generate the other six interpretable essay features from the answers. Those are the number of punctuations, the number of spelling errors, unique word count, similarity scores between answer and prompt using S-BERT and BOW vector representations, and the number of language errors.
The interpretable essay features help in providing a higher-level description of each answer. For example, language fluency and dexterity can be estimated by the average word length and long words count, according to Mahana et al. [17]. Moreover, Larkey also mentioned that the number of long words could indicate the complexity of term usage [15]. Meanwhile, unique words count is useful to estimate the richness of vocabulary in the answer, and it can exhibit students’ knowledge to use different words.
We measure the relevancy of an answer against the prompt using the degree of tokens overlap between the prompt and the answer (including their synonyms), and the cosine similarity value between the answer and the prompt using the Sentence-BERT and the BOW representation. Besides, we learn the grammar feature of the text, one of which is by measuring the number of good n-grams in the essay. The EASE library extracts the answer into its POS-tags and compares them with a list of valid POS-tag combinations in English. It defines the “good" POS n-grams as the ones that separate high- from low-scoring essays, determined using the Fisher test [11]. Additionally, we count the number of language errors in each answer using Language Tool Python library4. Finally, we also capture the mechanics of the text, which include aspects such as the usage of punctuation and the number of spelling errors found in the answer.
5.1.2 Extreme Cases
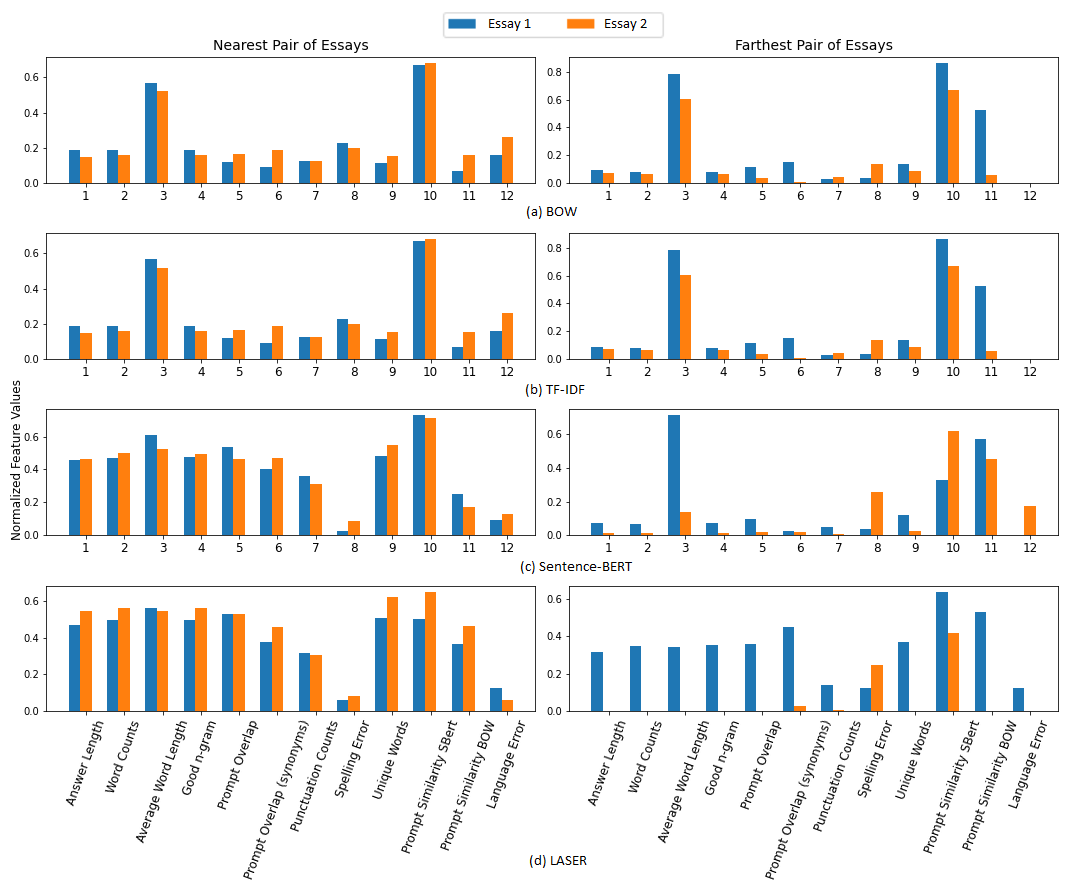
We use the dataset that consists of 1569 essays, which means that we obtain 1,230,096 unique essay pairs. The easiest and simplest way to get the first insight about the performance of the distance metrics is by examining the comparison between the most similar essay pair and the most dissimilar essay pair. We provide the visualization of each text feature in Figure 1, which highlights the similarity (or dissimilarity) for each of the twelve interpretable essay features, using the normalized feature values. Using this graph, we can observe in which aspects the essays are either similar or dissimilar.
BOW. Firstly, we inspect the comparison of extreme cases for BOW features. Figure 1 compares the difference of feature values between the most similar and the most dissimilar pair from the BOW representation of the essays. It is evident that it cannot distinguish the nearest pair and farthest pair of essays very well based on most of the features. BOW mainly focuses on the Prompt Similarity BOW feature.
TF-IDF. Secondly, we investigate the comparison of extreme cases for TF-IDF features. Here, both BOW and TF-IDF have the same essay pairs for the nearest and the farthest essays. This makes sense since the TF (Term Frequency) in the TF-IDF vector is actually the BOW vector, followed by the multiplication by the inverse document frequency (IDF), and then normalized by the Euclidean norm. So, it is not surprising if both of these vectors have similar pairs.
Sentence-BERT. Next, we investigate the comparison of extreme cases for Sentence-BERT features. As opposed to the BOW representation, based on our twelve interpretable features, Sentence-BERT can provide a more clear distinction between the nearest and farthest pair for most of the features. It is noticeable that for the nearest pair, both values are almost the same, contrary to the farthest pair, which shows very different values.
LASER. Finally, we investigate the comparison of extreme cases for the LASER features. Figure 1 compares the difference in feature values between the most similar and the most dissimilar pair using LASER representation of the essays. It is evident that based on our twelve interpretable features, LASER provides the best distinction between the nearest and farthest pair for most of the features. The normalized feature values for all twelve interpretable features look close to each other for the nearest pair. In contrast, the normalized feature values for the farthest pair appears very dissimilar for all of the essay features, and visibly has the largest differences compared to the other text representations.
5.1.3 Aggregate of Feature Difference
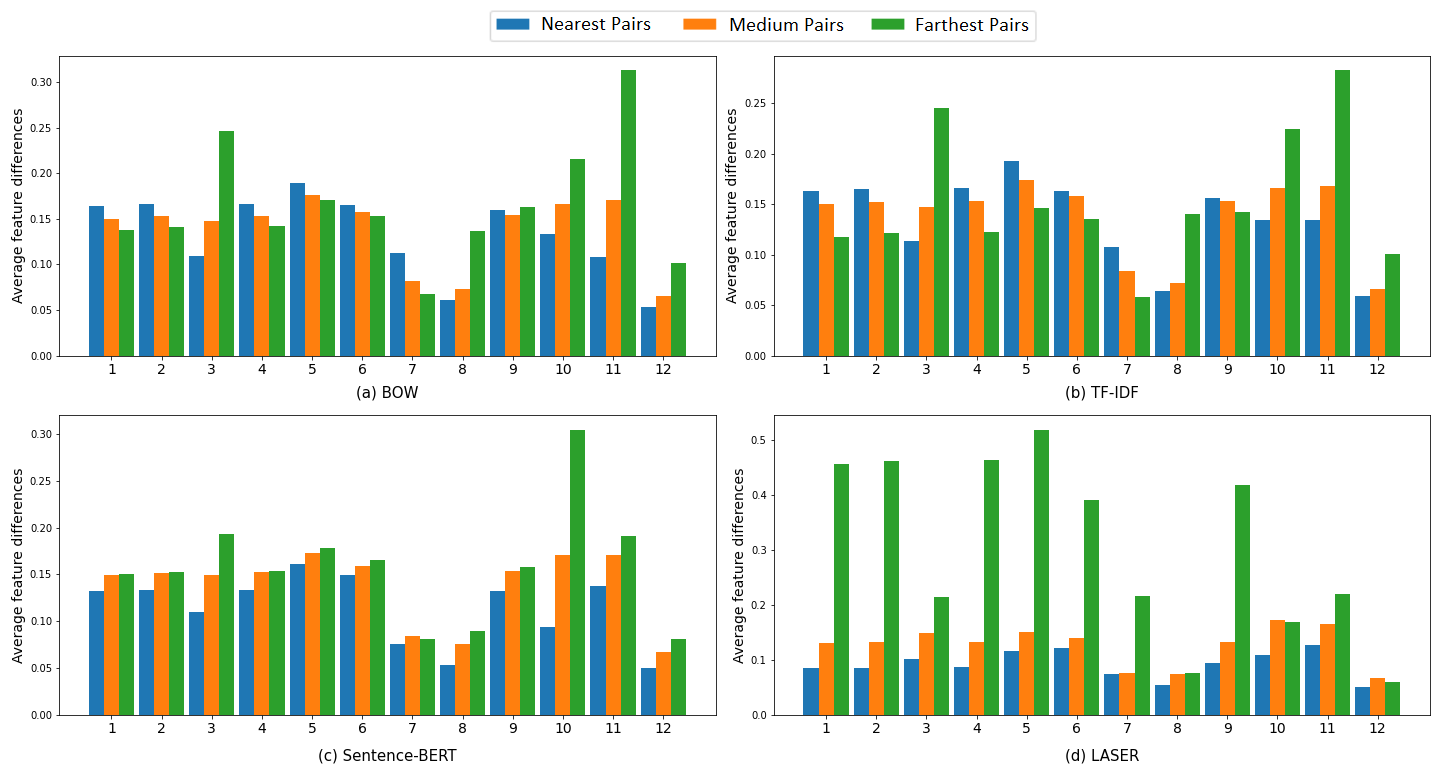
In this section, to get a wider overview of the performance of the distance metrics, we conducted the evaluation using more than just the extreme cases. For the experiment, we sampled 30,000 pairs of essays from three different distance distributions: 10,000 pairs from the nearest distance pairs, 10,000 pairs from the medium distance, and 10,000 pairs from the farthest distance. For the medium distance, we collected 5,000 pairs before the median value and the other 5,000 after the median value. In this research, the expected condition is that the average of features’ differences for all pairs in the nearest distance will be lower than the average of features’ differences of all pairs in the medium distance. Consequently, the average of features’ differences for the medium distance should be lower than those in the farthest distance.
The results are shown in Figure 2. The x-axis is labeled using numbers from 1 to 12 that refer to the twelve interpretable essay features in Table 1, in the same order. Consistent with the results of the extreme cases discussed before, LASER outperforms the other text representation of essays. Although for feature number 12 (Language Errors), it is not showing the expected result. This is also the case for the Sentence-BERT vector, with only one feature having an unexpected result (feature number 7: Number of punctuation). All of the other features for Sentence-BERT work well, even though mostly with smaller margins than those by the LASER vector.
The performance of Bag-of-Words (BOW) and TF-IDF representations is not as good as the deep-learning-based text representations. Some of the results are counterintuitive since the average of features’ differences in the nearer pairs are larger than the farther ones. However, several of the essay features worked well as the exceptions, i.e., feature numbers 3, 8, 10, 11, and 12. The complete feature names can be referred to in Table 1. It is visible that BOW and TF-IDF have similar characteristics as also the case for the extreme cases in the subsection 5.1.2.
5.2 Evaluation against Paraphrasing
We have evaluated the performance of the text representation with regards to their ability to measure similarities between essays. Our method proposes a further performance check concerning their ability to detect paraphrased essays. Students may write their answers using different words but still convey the same meaning. In this context, the scoring system should be able to perform consistently. We considered that two essays with the same content and arguments which were expressed using different words should be graded similarly.
We conducted this consistency check by inspecting whether the text features could maintain the similarity ranking between the original essays and their corresponding paraphrased essays. The rule is, if essay is more similar to essay than essay , then the paraphrase of also must be more similar to the paraphrase of than the paraphrase of .
For this purpose, the paraphrased essays were generated using the Spinbot
API5.
To understand how the API performed, a snippet of an essay
along with its paraphrased version is shown below as an
example:
Original essay. “One nice sunny day I was trapped in a doctors
office with no air conditioning. this doctor’s office had @NUM1
chairs in the dirty waiting room. I was already cramed in the
room with about @NUM2 people for @NUM3 minutes. I was
trying to be patient but the patience was wearing off..."
Paraphrased essay. “One decent bright day I was caught in a
specialists office with no cooling. this specialist’s office had
@NUM1 seats in the grimy lounge area. I was at that point
cramed in the room with about @NUM2 individuals for @NUM3
minutes. I was attempting to be patient however the tolerance
was wearing off..."
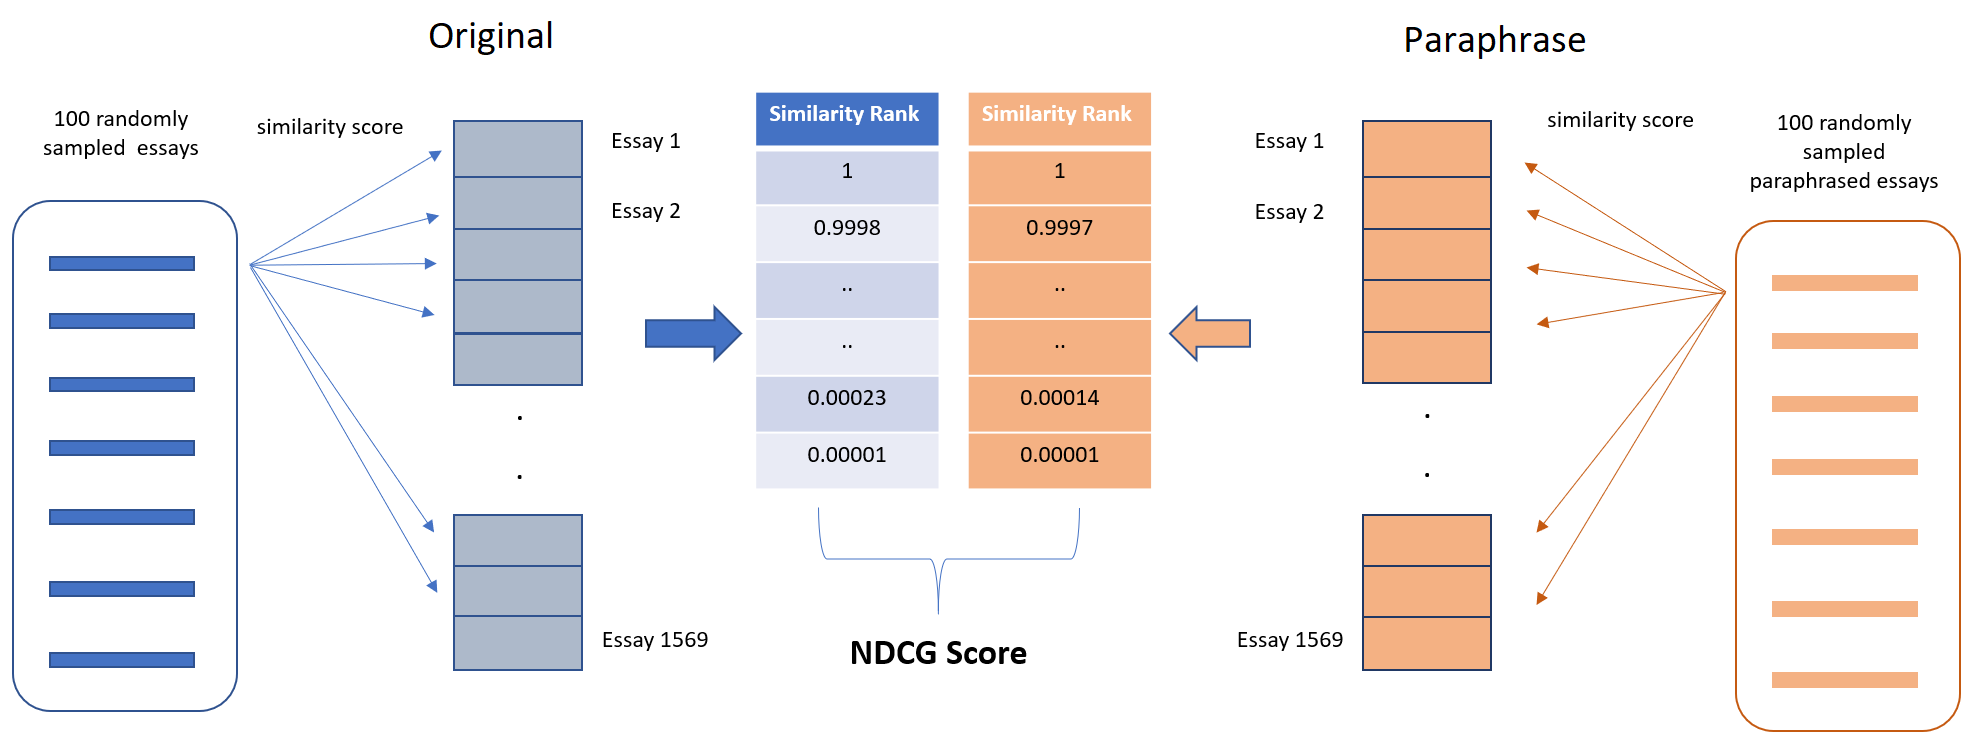
During the experiment, we first sampled 100 essays each from the original version and the paraphrased version. For each sample, we calculated the cosine similarity values between that sample with all of the other (1569) essays in the dataset. Afterward, we created a similarity ranking in descending order, from the highest similarity to the lowest. We implemented the same procedure on the paraphrased essay. Therefore, we also obtained another descending-ordered similarity ranking from the paraphrased version. From these two rankings, we measured the ability to maintain the ranking using Normalized Discounted Cumulative Gain (NDCG) score [13]. Finally, we repeated the same procedure 100 times with the other sampled essays. In the end, we obtained one hundred NDCG scores from 100 samples. Then we calculated the average NDCG score. The whole method is depicted in Figure 3.
NDCG value ranges from 0 to 1, where score 1 means a perfect ranking. In document retrievals, a score of 1 indicates that the order of document hits in a search is perfectly ordered by relevance. We calculated the average NDCG scores of 100 samples against the other essays (1569) in the dataset for each of the four text representations of the essays. The results were satisfying, as all of them had an NDCG score of . This means that all of the vector representations had no problem in maintaining the ranking of similarities between the original essays and the paraphrased essays.
5.3 Evaluating the Individual Fairness
5.3.1 Regression Model Results
Table 2 describes the performance for all of the regression models using different text features. Based on the vector representations of essays, it is evident that all three regression models using LASER features provide the best results. While according to the regression algorithm, Gradient Boosting performs best for all text features, followed by Ridge Regression, and lastly, Random Forest.
5.3.2 Equation-based Evaluation
Speicher et al. [22] consider individuals who belong to different sensitive groups yet share similar protected attributes should have the same decision outcomes. For instance, essays having the same protected attributes must not be treated discriminatively based on the students’ gender or race.
Individual fairness requires that the distance between two individuals’ outcomes is less than their distance according to the similarity metric. A mapping of : → satisfies the property if for every , we have:
(3)where, is a set of individual essays, is a function that assigns the essays into probability distribution over the outcomes , is a distance function that measures the difference in the outcomes, and represents the similarity metric between two essays.
We applied cosine distance to create the distance metric. For prompt 7 in ASAP dataset, we obtained an distance metric with . To have the distance metric and outcome metric in the same scale, we used Min-Max normalization to rescale the feature values into the range of . Min-Max scaler is defined as:
(4)where is the original value, is the minimum value, and is the maximum value. The cosine similarity between two vectors and is:
(5)
For each text feature, we count the number of pairs of essays that satisfy equation 3. The dataset contains 1,569 essays, and therefore, there are 1,230,096 unique pairs of essays. Table 3 shows the proportion of pairs of essays that satisfy the individual fairness constraint for every vector representation of essays with its corresponding regression model. It is important to note that we should read the table row by row. For example, if we applied Bag-of-Words vector as the text features, Random Forest has a higher proportion of pairs that satisfy the individual fairness equation than Gradient Boosting and Ridge Regression algorithms. If we use LASER, we can see that Ridge Regression outperforms the other algorithms with regard to the equation.
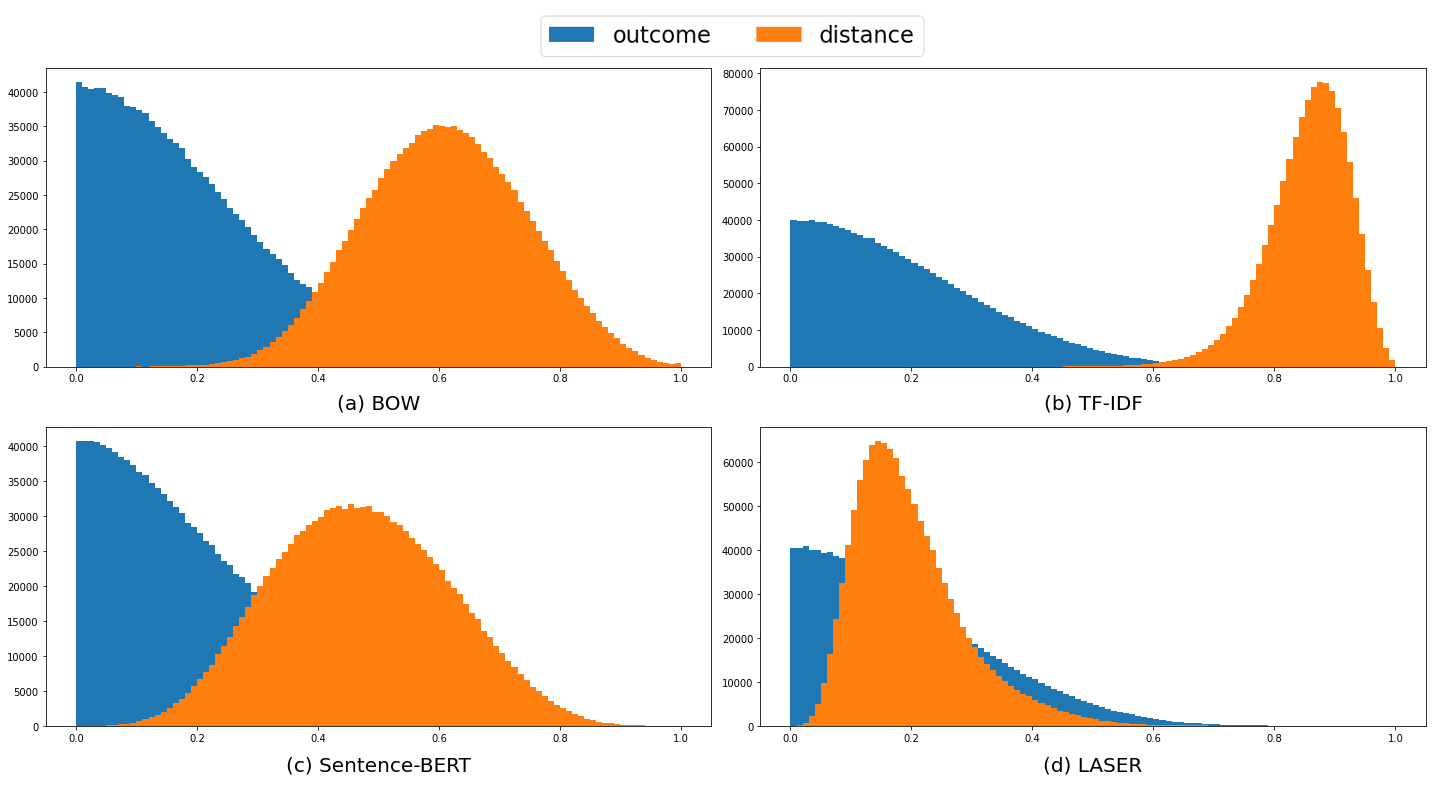
It is not possible to compare the performance between different vector representations since they work on different distance distributions. We can see their distance distribution in Figure 4. The orange curve is the distance distribution, and the blue one is the outcome distribution. To have a higher proportion of pairs that satisfy the equation, a major part of the blue curve should be on the left side of the orange curve, which will indicate that the outcome distance is lower than the vector distance. It is obvious that for BOW and TF-IDF vector, the majority part of the blue curve is on the left of the orange curve, which indicates that they had more pairs of essays that satisfy the equation. Meanwhile, LASER vector distance seemed to be more distributed on the left side, thus having more pairs with lower distances than the outcomes. It helps to explain why the proportion of pairs that satisfy the equation was much lower for LASER as compared to the other text features.
| Features | Random Forest | Gradient Boosting | Ridge Regression |
|---|---|---|---|
| BOW | 99.4% | 99% | 99.2% |
| Tf-Idf | 99.9% | 99.9% | 99.9% |
| Sentence-BERT | 92.2% | 94.7% | 97.9% |
| LASER | 51.7% | 53.9% | 67.8% |
5.3.3 Score Difference vs. Distance of Essays
In the presence of a large number of pairs of essays, it is impossible for humans to examine each pair one by one. We propose a method based on a simple idea by using a visual inspection of the distribution of score differences across different distance groups. Evaluating individual fairness is by looking at whether similar essays are treated similarly. It means that the score difference between essays must correlate with their distance in the vector space. The average score differences in the group of similar essays should naturally be lower than the average score difference in the group of dissimilar essays.
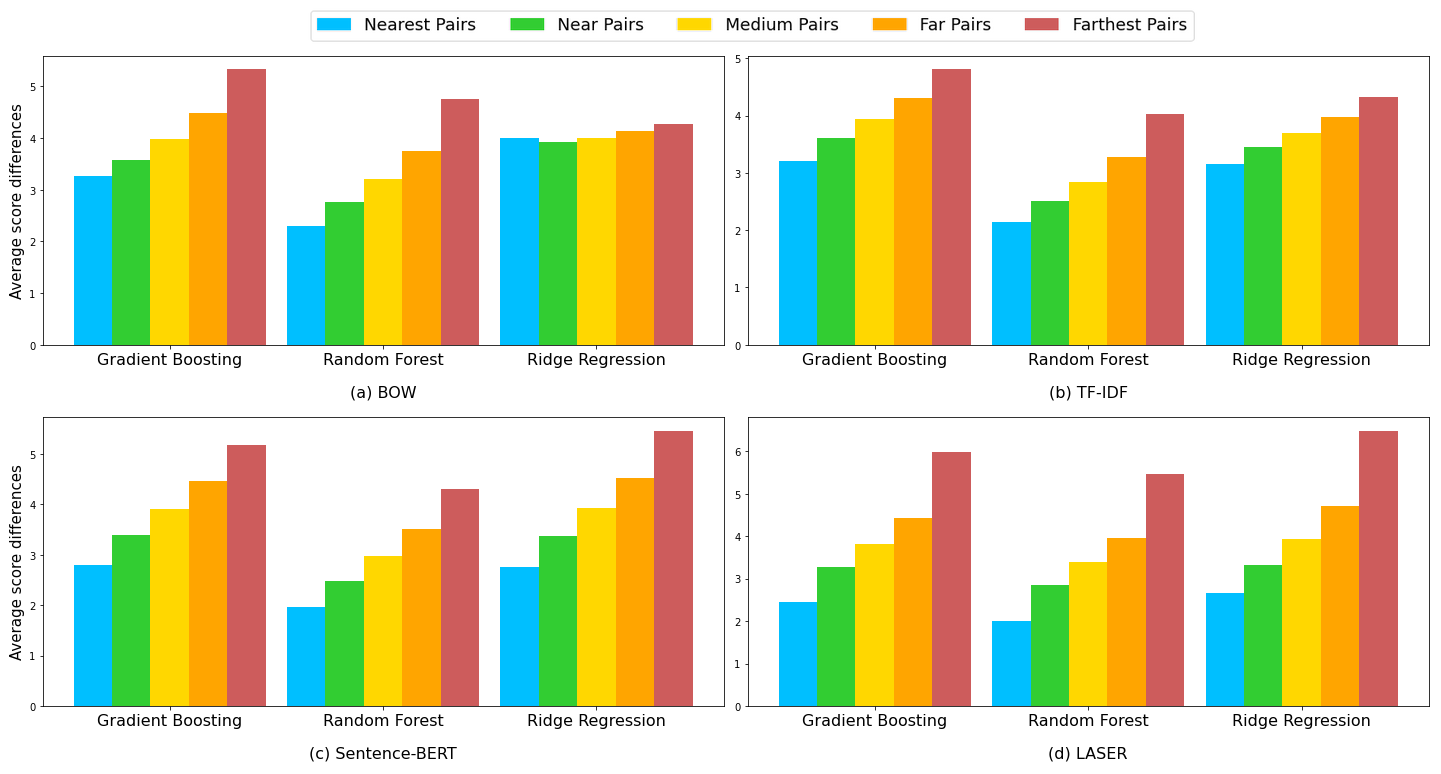
In our work, we presented the visualization of score difference vs. distance of essays in two scenarios, using data binning to (i) five groups (Figure 5) and (ii) one hundred groups (Figure 6). Firstly, we sorted the distance of all pairs of the essays in ascending order, from the most similar pair (the pair with the lowest cosine distance) to the most dissimilar pair (the pair having the highest cosine distance). For the data binning of five, we divided these sorted essays into five groups, with each group comprised of 20% of the whole data. For each group, first, we calculated the score differences of all pairs within that group. Afterward, we calculated the average value of those score differences. Lastly, we compared these average score differences of all five groups. We conducted this process for all of the regression models and text features of the essays. The results are shown in Figure 5. We can see that basically, all distance metrics with all three models could produce the correct proportion of score distance and vector distance, except for the Ridge Regression algorithm on Bag-of-Words (BOW) vector, which appears flat, which means that the score difference was not correlated with the vector distance. Therefore, this does not follow the expected condition for individual fairness and is not recommended.
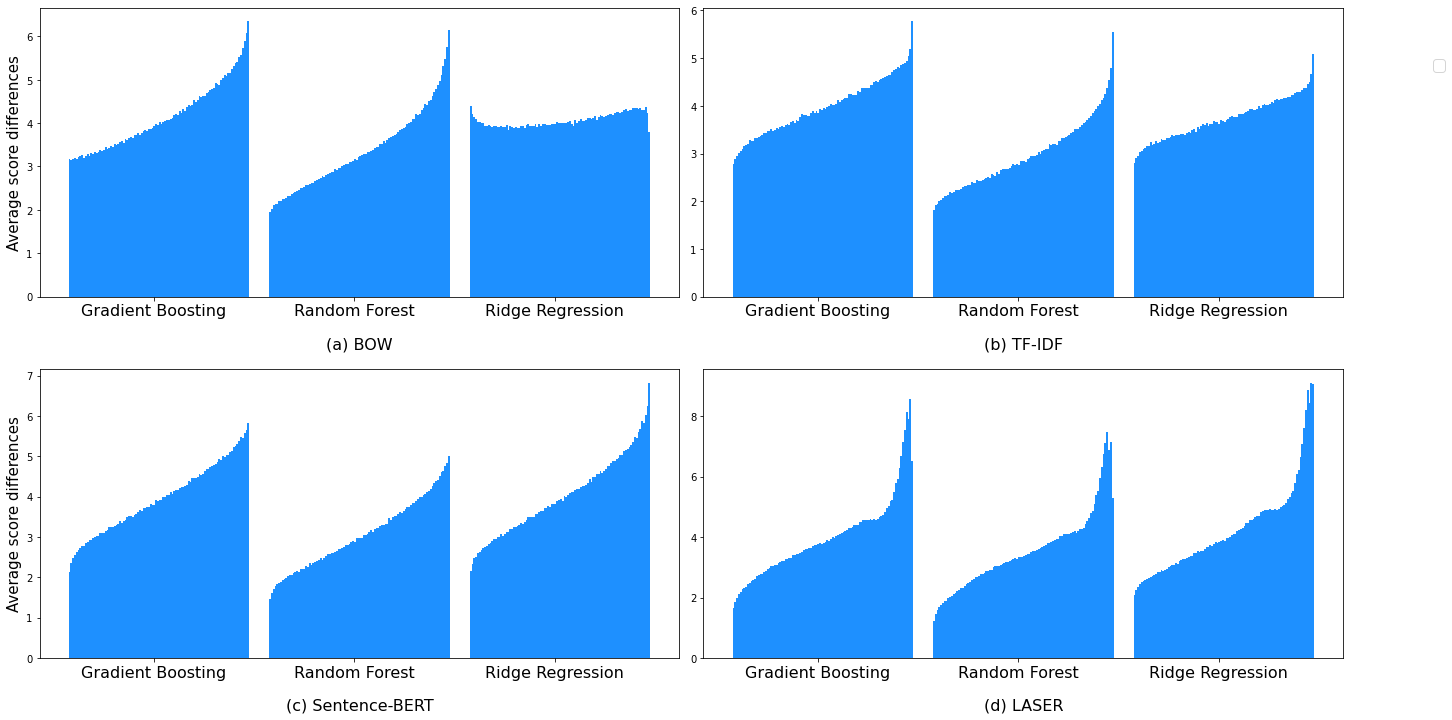
The exact same procedure was then repeated, but instead of dividing the whole sorted pairs into five groups, we divided them into one hundred groups to get a smoother graph. The results are shown in Figure 6. Now, we can observe a smoother increase in score differences. In Figure 5, we observe that the graph for Ridge Regression using the BOW vector appears flat. Sentence-BERT has the best shape of the increment of score differences since it grows in a gradual and consistent manner. For LASER, it shows a smooth increment at the beginning but flattens a bit towards the end and suddenly rises significantly. Moreover, if we look at the graph carefully, there is even a drop in score differences after reaching the peak by the Gradient Boosting and Random Forest algorithms. Although, this phenomenon is not seen in the Ridge Regression algorithm. TF-IDF vector exhibits a smooth increasing behavior similar to the Sentence-BERT vector. The only slight difference is that there are sharp increases at the right-most part (most dissimilar pairs). This visualization method helps quickly understand the individual fairness performance of a combination of a regression model and a text representation vector.
5.4 Discussion
We are looking for a combination of text features and regression model that has a better overall performance with respect to different aspects of our methodology. On the one hand, for the text features, they should perform well in these criteria: (i) the ability to discriminate between the most similar and most dissimilar pair of essays (extreme cases), (ii) the aggregate of features differences, and (iii) the ability to maintain the ranking of similarities between the original and paraphrased essays. On the other hand, the regression models should have good capabilities in these aspects: (i) the proportion of pairs that satisfy the individual fairness equation, and (ii) the correlation of score difference with the distance of essays. Ultimately, both of them must have a high agreement between the system scores and the human scores, measured in Quadratic Weighted Kappa (QWK). According to the acceptance criteria for an essay scoring model from Williamson et al. [24], the QWK must be at least 0.7.
Based on the proposed methodology, we analyze the outcomes of experimental results. LASER has the highest agreement (QWK) score compared to the other text features, as shown in Table 2. However, it performs inadequately for the proportion of pairs of essays that satisfy the individual fairness equation. Meanwhile, BOW and TF-IDF have the highest scores, as illustrated in Table 3. Nevertheless, they did not show better performances than Sentence-BERT and LASER in terms of discriminating the extreme cases and the aggregate features differences.
Finally, we observe that an automated essay scoring model trained using the Gradient Boosting algorithm on Sentence-BERT vector representation of essays has a better overall performance than the other combinations. It has exceeded the acceptance rate of the QWK score (0.722), performed well in discriminating the extreme cases and the aggregate of features differences, has a high percentage of pairs that satisfy the individual fairness equation (94.7%), and has the smoothest linear increment of score differences across the linearly divided distance groups as reflected in Figure 6. However, it is noteworthy to mention that selecting the combination depends on the priority given to a specific evaluation aspect when developing an essay scoring system.
6. CONCLUSION
In this work, we studied individual fairness in the Automated Essay Scoring (AES) system and proposed an individual fairness evaluation methodology. In practice, it is a challenging task to define the similarity of essays. We used the numerical text representation of essays to compute the similarities between answers. Next, we compared the performance of different scoring models using different text representations with regard to individual fairness. Our proposed methodology suggests that we look for the combination of the text representation of essays and score prediction models that achieves well-balanced results in several evaluation aspects. Based on the experiment results, we observed that the combination of Sentence-BERT and Gradient Boosting had overall better results than the other combinations.
The proposed methodology provides flexibility to be used with any text representations of essays and any score prediction models. Moreover, it is further expandable for a more robust evaluation process. One can assess the performance of the distance metrics not only against the paraphrased essays but also against noised textual data. For example, whether an AES system can perform well on the negation of essays is still a challenging problem in the NLP domain. It will be interesting to observe whether the essay features and distance metrics can be used to differentiate pairs of essays that have similar syntactic features but different semantics. Another interesting question for future study is how individual fairness relates to and contributes to group fairness. For instance, two students with and without a disability might provide very similar essays, but the scores need to reflect the extra effort and time of the student with the disability. In this context, it would be unfair to only take essays rather than individuals into account to measure fairness in AES.
7. REFERENCES
- E. Amorim, M. Cançado, and A. Veloso. Automated essay scoring in the presence of biased ratings. In Proceedings of the 2018 Conference of the North American Chapter of the Association for Computational Linguistics: Human Language Technologies, Volume 1 (Long Papers), pages 229–237, 2018.
- M. Artetxe and H. Schwenk. Massively multilingual sentence embeddings for zero-shot cross-lingual transfer and beyond. Transactions of the Association for Computational Linguistics, 7:597–610, 2019.
- S. Bird, E. Klein, and E. Loper. Natural language processing with Python: analyzing text with the natural language toolkit. " O’Reilly Media, Inc.", 2009.
- B. Bridgeman, C. Trapani, and Y. Attali. Considering fairness and validity in evaluating automated scoring. In The Annual Meeting of the National Council on Measurement in Education (NCME), 2009.
- J. Burstein and M. Chodorow. Automated essay scoring for nonnative english speakers. In Computer mediated language assessment and evaluation in natural language processing, 1999.
- D. Chandrasekaran and V. Mago. Evolution of semantic similarity—a survey. ACM Computing Surveys (CSUR), 54(2):1–37, 2021.
- M. Chodorow and J. Burstein. Beyond essay length: evaluating e-rater®’s performance on toefl® essays. ETS Research Report Series, 2004(1):i–38, 2004.
- J. Cohen. Weighted kappa: nominal scale agreement provision for scaled disagreement or partial credit. Psychological bulletin, 70(4):213, 1968.
- A. Doewes and M. Pechenizkiy. On the limitations of human-computer agreement in automated essay scoring. International Educational Data Mining Society, 2021.
- C. Dwork, M. Hardt, T. Pitassi, O. Reingold, and R. Zemel. Fairness through awareness. In Proceedings of the 3rd innovations in theoretical computer science conference, pages 214–226, 2012.
- R. A. Fisher. On the interpretation of 2 from contingency tables, and the calculation of p. Journal of the Royal Statistical Society, 85(1):87–94, 1922.
- F. GUO. Fairness of automates essay scoring of gmat awa. GMAC Research Reports, 9, 2009.
- K. Järvelin and J. Kekäläinen. Cumulated gain-based evaluation of ir techniques. ACM Transactions on Information Systems (TOIS), 20(4):422–446, 2002.
- J. D. M.-W. C. Kenton and L. K. Toutanova. Bert: Pre-training of deep bidirectional transformers for language understanding. In Proceedings of NAACL-HLT, pages 4171–4186, 2019.
- L. S. Larkey. Automatic essay grading using text categorization techniques. In Proceedings of the 21st annual international ACM SIGIR conference on Research and development in information retrieval, pages 90–95, 1998.
- D. Litman, H. Zhang, R. Correnti, L. C. Matsumura, and E. Wang. A fairness evaluation of automated methods for scoring text evidence usage in writing. In International Conference on Artificial Intelligence in Education, pages 255–267. Springer, 2021.
- M. Mahana, M. Johns, and A. Apte. Automated essay grading using machine learning. Mach. Learn. Session, Stanford University, 2012.
- F. Pedregosa, G. Varoquaux, A. Gramfort, V. Michel, B. Thirion, O. Grisel, M. Blondel, P. Prettenhofer, R. Weiss, V. Dubourg, J. Vanderplas, A. Passos, D. Cournapeau, M. Brucher, M. Perrot, and E. Duchesnay. Scikit-learn: Machine learning in Python. Journal of Machine Learning Research, 12:2825–2830, 2011.
- P. Phandi, K. M. A. Chai, and H. T. Ng. Flexible domain adaptation for automated essay scoring using correlated linear regression. In Proceedings of the 2015 Conference on Empirical Methods in Natural Language Processing, pages 431–439, 2015.
- M. Ramamurthy and I. Krishnamurthi. Design and development of a framework for an automatic answer evaluation system based on similarity measures. Journal of Intelligent Systems, 26(2):243–262, 2017.
- N. Reimers and I. Gurevych. Sentence-bert: Sentence embeddings using siamese bert-networks. In Proceedings of the 2019 Conference on Empirical Methods in Natural Language Processing. Association for Computational Linguistics, 11 2019.
- T. Speicher, H. Heidari, N. Grgic-Hlaca, K. P. Gummadi, A. Singla, A. Weller, and M. B. Zafar. A unified approach to quantifying algorithmic unfairness: Measuring individual &group unfairness via inequality indices. In Proceedings of the 24th ACM SIGKDD International Conference on Knowledge Discovery & Data Mining, pages 2239–2248, 2018.
- V. U. Thompson, C. Panchev, and M. Oakes. Performance evaluation of similarity measures on similar and dissimilar text retrieval. In 2015 7th International Joint Conference on Knowledge Discovery, Knowledge Engineering and Knowledge Management (IC3K), volume 1, pages 577–584. IEEE, 2015.
- D. M. Williamson, X. Xi, and F. J. Breyer. A framework for evaluation and use of automated scoring. Educational Measurement: Issues and Practice, 31(1):2–13, 2012.
- L. Ying. A research on the application of automatic essay scoring system to university’s english writing education in the era of big data: Taking pigaiwang as an example. Studies in Literature and Language, 10(6):84–87, 2015.
- W. Zhu. A study on the application of automated essay scoring in college english writing based on pigai. In 2019 5th International conference on social science and higher education (ICSSHE 2019), pages 451–454, 2019.
1https://www.kaggle.com/c/asap-aes
2https://github.com/facebookresearch/LASER
3https://github.com/openedx/ease
© 2022 Copyright is held by the author(s). This work is distributed under the Creative Commons Attribution-NonCommercial-NoDerivatives 4.0 International (CC BY-NC-ND 4.0) license.