ABSTRACT
A child’s ability to understand text (reading comprehension) can greatly impact both their ability to learn in the classroom and their future contributions to society. Reading comprehension draws on oral language; behavioural measures of knowledge at the word and sentence levels have been shown to be related to children’s reading comprehension. In this study, we examined the impact of word and sentence level text-features on children’s reading comprehension. We built a predictive model that uses natural language processing techniques to predict the question-level performance of students on reading comprehension tests. We showed that, compared to a model that used measures of student knowledge and subskills alone, a model that used features of sentence complexity, lexical surprisal, rare word use, and general context improved prediction accuracy by more than four percentage points. Our subsequent analyses revealed that these features compensate for the shortcomings of each other and work together to produce maximal performance. This provides insight into how different characteristics of the text and questions can be used to predict student performance, leading to new ideas about how text and reading comprehension interact. Our work also suggests that using a combination of text features could support the adaptation of reading materials to meet student needs.
Keywords
INTRODUCTION
Elementary students’ ability to understand text, or their reading comprehension (e.g., [30]), supports their successful participation in both education and society [7]. It is well-established that reading comprehension is determined, at least in part, by children’s skill in oral language [19], with strong impacts of oral language skills—at both the word and sentence levels (i.e., vocabulary and syntax) —on reading comprehension skills (e.g., [11]). We built on these ideas and tested whether automatically extracted indicators of vocabulary and syntax complexity would be indicative of reading comprehension scores. To address this question, we extract features from a widely used standardised measure of reading comprehension [34]. Thus, we introduce various text-based measures that can be automatically extracted. After extracting these features, we trained and evaluated models. We then tested their relative performance and analyzed the added value of including all of these features in the context of a predictive neural network model. Our modelling approach could also be used to analyze new reading comprehension tests or tasks, enabling others to better understand how student knowledge and subskills interact with the characteristics of the text to influence reading comprehension.
The educational value of this work lies in informing the optimal selection of texts and questions to support the development of children’s reading comprehension. Predictions on where mistakes would likely be made by individual students could be used to support downstream tasks, such as adapting systems so that both the comprehension questions asked and the assigned texts challenge students appropriately [57]. Further, interpreting the predictions made by such models and the model attributes may improve our understanding of what contributes to reading comprehension challenges, which could support the design of optimally effective interventions.
Related Work
The single most widely cited theory of reading comprehension is the Simple View of Reading [19]. According to this theory, children’s reading comprehension is determined by the product of their word reading and their oral language skills. Behavioural research since its development has made good progress in identifying the individual oral language skills that support reading comprehension. Two of the best-established lie in vocabulary, or knowledge of individual word meanings, and syntactic awareness, or the ability to reflect on or manipulate spoken sentences [5]. Each of vocabulary and syntactic awareness are strong predictors of children’s levels of reading comprehension [54]. For instance, Deacon and Kieffer [11] showed that children’s ability to manipulate sentences in Grade 3 predicted gains made in reading comprehension between Grades 3 and 4, a contribution similar in magnitude to that of word-level reading. There is an even larger body of research demonstrating the impacts of children’s vocabulary knowledge on their ability to understand what they read [43]. Together, this body of work shows that individual differences in oral language skills—at both the word and sentence levels—are related to children’s ability to understand the texts that they read.
But what about the features of the texts themselves?
It is well-established that the features of a text impact a person’s comprehension of that text. These features can be identified manually, or we can use techniques from natural language processing (NLP) to identify the qualities of a text and extract their associated features. The field of NLP has developed many approaches that can be used to identify syntax, semantics, and word use. There are also methods that can identify the broader relationships in people’s language use once those methods have been trained with corpora.
Of the techniques that do not require training with a corpus, are those that predominantly count elements of a text to derive measures that can then be used as features in a model. One widely-used tool that employs this approach to capture the syntactic complexity of sentences is Coh-Metrix. Coh-Metrix tracks the linguistic properties of a text using features such as the average length of words in a sentence or number of sentences in a paragraph [23]. The most recent version of Coh-Metrix also incorporates the scoring of connections between sentences, such as noun overlap between adjacent sentences and causal cohesion (sentences that are linked by causal connectives) [22].
Given the importance of syntactic complexity to reading comprehension, it is not surprising that Coh-Metrix has been used to extract the linguistic properties of texts to predict student reading comprehension scores in the context of the iStart tutoring system [1]. iStart provided training in active reading strategies (i.e., self-explanation) to support improved reading comprehension. In this case, features were extracted from student self-explanations and used to predict reading comprehension scores on the Gates MacGinitie test. These analyses provided insight into how the language produced by students can be used to predict their overall reading comprehension performance. Including the simple linguistic features that were extracted using Coh-Metrix accounted for additional variance in student performance, which demonstrated that the inclusion of such features has the potential to support learner modelling tasks.
Building on the idea of Coh-Metrix, AMOC aimed to automatically capture the semantic complexity and context of a text [8]. It uses similar approaches to those embedded within Coh-Metrix and adds semantic links using dictionary-like tools and Word2Vec. These links are then used to output a graph representation of the semantic model (context) associated with a segment of text.
Language models are a potential alternative approach to automatically capturing the syntactic and semantic or contextual features of a text. Existing language modelling approaches vary in complexity from relatively simple probabilistic representations of language (e.g., n-grams) to more complex neural network-based approaches (e.g., RNNs). All of these language modelling approaches require a corpus of data from which they can learn language-usage patterns.
Assuming you have access to a corpus, n-grams can be used to capture both the syntactic and semantic constraints in a text by determining the probability with which words are expected to follow one another. Mitchell et al [39] investigated using trigrams (i.e., n-grams of length 3) to analyze reading times and understand reading comprehension. They used these n-grams to estimate the lexical surprisal associated with a text and found a correlation between the surprisal measure and reading time. Similarly, a study by Hofmann et al [29] used a trigram language model to predict reading speed from eye-tracking data while acknowledging that trigrams do not account for long-range semantic effects (unlike AMOC and some more advanced language modelling approaches). The finding that reading time may be related to comprehension is not directly measurable with n-grams; rather, they enable the extraction of measures, such as lexical surprisal, that can be used to predict reading time.
To better model long-range semantics and sentence meaning, recurrent neural networks (RNN) have been used to improve predictions of reading comprehension scores and reading times. Frank and Hoeks [18] used a specific type of RNN, called long short-term memory (LSTM), to correlate reading times with comprehension. Through this investigation, they found RNNs can capture both the structure and semantics of a long text thus improving reading time predictions. Transformer-based neural network models [53], such as BERT [15], have shown superior performance over RNNs when conducting various NLP tasks, such as neural machine translation [31] and sentiment analysis [38]. This suggests the use of transformer-based models may support improved performance when predicting reading comprehension scores.
Outside of the use of language models, other approaches to representing student performance (learner or student models) have been attempted in systems that rely on language as a primary source of interaction with the student. One project aimed to predict student scores on a post-test using the logs of student interactions from intelligent tutoring systems (ITS) that teach physics and probability using word-based problems [35]. Mao et al. [35] collected data from two ITSs and used the training content to predict student post-test results. They trained a Bayesian knowledge tracing (BKT) model to infer whether students had learned the intended units of knowledge (knowledge components). Their results showed BKT’s prediction is more accurate than that of the LSTM on its own. A model that jointly used BKT and LSTM to predict post-test scores outperformed both individual models, suggesting the potential for combining different approaches to capturing student capabilities in relation to the complexities of the learning and assessment materials. This initial work has provided promising results by incorporating representations of the text as part of the prediction of student performance. However, the skill representations used by BKT models typically require the expert labelling of skills along with the careful development and sequencing of questions, and this sequencing is often specific to an ITS. Consequently, it cannot be easily generalized or applied to other prediction tasks.
Moreover, these types of approaches have yet to be applied to modelling student reading comprehension within e-learning systems. Within the instructional domain of literacy, previous attempts at modelling student skills or knowledge have focused on understanding student reading strategies [24], improving their vocabulary acquisition [14, 17], or improving reading proficiency (decoding and fluency) [2, 40], as steps towards supporting literacy. In these cases, the logs of student activities, their interactions with the system, and the texts they produce are used to model student knowledge and skills. These types of models are then used to provide feedback to students [13], inform teachers of student activities and skills, or adapt learning content [12, 13]. Consistent with the above modelling goals, the training provided by the e-learning systems that aim to support student literacy has tended to focus on exposure-based approaches [3, 12], stealth assessment during game play [17], and the training or modelling of reading strategies [17, 21]. In the research on the use of software to support reading proficiency, tests of reading comprehension have been used to evaluate the effectiveness of the system [1, 16, 40] rather than being an integral part of the content that is adapted.
We do not yet have a model that can predict student performance on comprehension questions by capturing students’ underlying oral language skills while accounting for text features. A model that could do this would support the selection of both texts and questions within an adaptive learning environment like an ITS. The present study is a first attempt at developing such a model. It asks, ‘What is the added value of including text features as input when predicting the correctness of question answering in reading tasks?’
Methods
To answer the above question, we applied supervised learning to archival data from a study of children’s reading development. We compared models that include different features we extracted from a reading comprehension test to a baseline that only included measures of student oral language skills and language knowledge.
Participants
This study was approved by the Social Sciences and Humanities Research Ethics Board of Dalhousie University. All children participated with parental consent and child assent. We recruited Grade 3 students from a combination of urban and rural public schools in Nova Scotia.
There were 139 students with a mean age of 8.80 years at the time of testing (SD = 0.29; range = 8.15–9.37 years). Of these students, 74 were boys and 65 were girls. Based on parent-report, most children were native speakers of English; 4 spoke a language other than English at home.
Table 1 shows the children’s performance on standardized measures (see section 2.3.2 for details on these measures). Student scores suggest that participants were typically developing.
Measure Name | Rel. | Mean | SD | Min | Max |
|---|---|---|---|---|---|
PPVT-M | .84 | 31.95 | 4.93 | 19.00 | 46.00 |
CTOPP | .93 | 23.01 | 6.10 | 8.00 | 33.00 |
Syntax Awareness | .74 | 9.57 | 3.27 | 2.00 | 16.00 |
TOWRE | .93 | 56.97 | 14.40 | 4.00 | 87.00 |
WISC | .91 | 13.17 | 2.31 | 8.00 | 20.00 |
WRMT-3 | .97 | 60.97 | 12.72 | 3.00 | 83.00 |
Note. Raw scores are reported for all measures. Reliability (Rel.) was retrieved from the instrument manual. SD - standard deviation.
Procedures
The measures reported on here were completed as a part of a larger battery, presented in two individual sessions and one group session (up to 12 children). We only report measures relevant to the present study.
In session 1, participants completed the Sight Word Efficiency subtest of the Test of Word Reading Efficiency (TOWRE), amongst other measures.
Session 2 was completed an average of two days after the first individual session (M = 1.93, SD = 1.39; range: 1 to 9 days). Participants completed the Word Identification subtest of the Woodcock Reading Mastery Tests (WRMT), a modified version of Peabody Picture Vocabulary Test (PPVT-M), Digit Span from the Wechsler Intelligence Scale for Children (WISC), and Elision from the Comprehensive Test of Phonological Processing (CTOPP).
The group session was completed an average of just over 2 days after the first individual session (M = 2.27, SD = 2.12; range: 1 to 9 days). In the group session, children completed the Comprehension subtest of the Gates–MacGinitie Reading Tests.
Measures
Reading Comprehension Measure
To measure reading comprehension, we administered the Level 3 Comprehension subtest of the fourth edition of the Gates–MacGinitie Reading Tests[1] [34] according to manual instructions. The manual reports a reliability of .93 for this instrument. Students were given 35 minutes to read 11 short texts and answer the three to six multiple choice questions following each text.
We aim to predict whether students correctly answered individual questions for each of the texts from this test.
Individual Knowledge and Sub-skill Measures
To incorporate differences in student oral language skills and knowledge, we administered tests to assess their vocabulary, phonological awareness, working memory, word reading fluency, and word reading accuracy. The descriptive statistics for these measures are shown in Table 1, and the instruments are detailed below.
Vocabulary knowledge. To measure receptive vocabulary knowledge, a shortened version (51 items) of the PPVT-3 [36] was used. For each item, students chose which of a set of four black-and-white pictures referred to an orally presented word. This shortened version (PPVT-M) has been validated with Grade 1 to 3 children [11].
Syntactic awareness. This was measured with an 18-item task in which children corrected sentences based on Deacon and Kieffer’s framework [11]. For instance, children are presented orally with the scrambled sentence, “From the library were stolen the books.” and they were asked to fix the sentence so that it sounds right (in this case, “the books were stolen from the library”). Children were given 3 practice items prior to completing the test.
Phonological awareness. We measured phonological awareness with the Elision subtest of the second edition of CTOPP [55]. Participants were asked to repeat words without pronouncing certain syllables or phonemes (e.g., bold without /b/). Phonological awareness was measured because of its association with word reading and reading comprehension [10].
Working memory. Given established correlations of working memory with both reading comprehension and word reading in 9-year-olds (e.g., [5]), we measured it using the Digit Span subtest of the fourth edition of the WISC [56]. In this task, participants repeat a series of digits of increasing length in the order given or the reverse order.
Word reading fluency. We measured word reading fluency using the Sight Word Efficiency subtest of the TOWRE [51]. Participants were given 45 seconds to read a list of words as fast as possible.
Word reading accuracy. We measured word reading accuracy with the Word Identification subtest of the WRMT-3 [58]. Students read words that became increasingly difficult.
Text-based Features
We extracted both word- and sentence-level text-based features. The features included sentence complexity, rare word use, lexical surprisal, and sentence context. The descriptive statistics of all extracted features can be seen in Table 2. Since rare word use represents a proportion of the text, it produces a single input feature. Similarly, question complexity produces a single input feature because questions are one sentence long. In contrast, lexical surprisal and sentence complexity for the text, which contains multiple sentences, are represented using three features: mean, standard deviation, and maximum.
Sentence Complexity
Complex sentences increase working memory load, which makes reading comprehension challenging [20]. We used the depth of the parse trees from the text as a proxy for sentence complexity. Each parse tree identifies the grammatical constituents of a sentence and communicates an aspect of a sentence’s complexity through its structure.
Feature Name | Mean | SD | Min | Max | |
|---|---|---|---|---|---|
Sentence Complexity | |||||
Mean | 8.41 | 0.88 | 7.18 | 10.33 | |
SD | 2.32 | 0.74 | 1.34 | 3.96 | |
Maximum | 12.33 | 1.75 | 10.00 | 16.00 | |
Lexical Surprisal | |||||
Mean | .44 | .30 | 0 | 1 | |
SD | .49 | .26 | 0 | 1 | |
Maximum | .56 | .30 | 0 | 1 | |
Rare Word Use | .46 | .06 | .35 | .56 | |
Question Complexity | 8.37 | 1.94 | 6 | 13 | |
Note. SD - standard deviation.
To obtain this sentence-level measure, we first tagged the sentences from each text in the reading comprehension test with their associated parts of speech (POS). From the tagged words, we built parse trees using a probabilistic context-free grammar (PCFG). Both tagging and parsing were performed by the CoreNLP tagging tool [52].
Figure 1 shows a parse tree for the “Snow turns blue when blue ice-worms live in it.” This sentence is taken from one of the texts that was used to measure reading comprehension.
The PCFG assigns a probability to each potential parse of a sentence. The highest probability parse is selected; its associated tree is used to derive our measure of sentence complexity. We take the depth of the tree for each sentence in the text and derive three measures per text: the maximum tree depth, the average depth, and the standard deviation of tree depths. As an example, the parse tree in Figure 1 has a depth of 10.
Rare Word Use
The number of rare words in a text influences reading comprehension; one rare word can lead to a complete miscomprehension of a sentence [23]. Given this fact, it is important to capture the amount of rare word use in a text when assessing reading comprehension. We model vocabulary rarity by quantifying the percentage of rare words in each text of the test. This language feature is expected to represent the difficulty of the text on a vocabulary level.
To calculate the percentage of rare words, we first used the Children’s Book Test corpus [27] to compute all word frequencies. We then chose a cut-off threshold (700) for determining word rarity. The top 700 frequent words occupy 1.5% of all distinct words and account for 60% of the corpus content. The most frequent 700 words were extracted to form a common word list. We consider words rare if they are not contained in the common word list.
To compute the percentage of rare words in a text, we count the number of rare word tokens (i.e., those that do not appear in the common word list) and divide that by the total number of word tokens in the text. This percentage is our measure of rare word use.
Lexical Surprisal
The surprisal of a word in a sentence is related to the amount of cognitive work required for human comprehension of that word within the sentence [33], and it is predictive of reading times [46]. To model this word-level feature, we needed to determine the likelihood of one word appearing right after another word.
Since our prediction task is targeted towards Grade 3 students with elementary-level vocabulary, we built bigrams (n-grams of length 2) from the Children’s Book Test dataset [27]. We then derived the lexical surprisal value [25] for each sentence in the Gates-MacGinitie texts by computing the mean word-level surprisal. Min-max normalization [42] was used to ensure the values are on a similar scale to the other features. After extracting the surprisal of each sentence in the text, we compute the mean, standard deviation, and maximum of all sentence surprisal values for the whole text. These normalized values are used for the lexical surprisal input feature.
Sentence Context
The sentence-context feature employs a prevalent method for representing text - a universal sentence encoder – which incorporates context, meaning, sentence complexity, and word order information [6]. The embedding represents the text in the form of a vector. To obtain these embeddings, we used the pre-trained MPNet encoder [49], which is a transformer-based language model. MPNet was used to encode both the text and questions into vectors with 768 dimensions. The generated universal sentence embedding was used to represent the general context of the texts.
Prediction Task
The goal of each model is to predict whether a particular student would answer a specific reading comprehension question correctly or incorrectly based on measures of their individual knowledge and sub-skills and the features of the texts (see Figure 3).
The input to our task includes features derived from the textual content of the Comprehension subtest of the Gates–MacGinitie Reading Tests and students’ individual knowledge and sub-skill measures that provide information about their oral language skills. Since each of these instruments provides scores on different scales, we applied min-max scaling normalization [41]. This allows all measures to be placed on the same scale, thereby facilitating comparisons. This type of normalization also facilitates model accuracy in classification tasks [4].
Of the questions students answered, 54 % are labelled correct and 46 % incorrect. Due to the limited size of our data (6,576 entries), all entries were used during model training and testing.
Models
Base Model
The Base Model is a fully connected neural network classifier that takes all sub-skill measures as input to predict whether a student will answer each question correctly. Given that the input layer is relatively small with 6 features, our network has two hidden layers each with 12 nodes.
Text-based Feature Models
Our proposed models augment the Base Model with the language features of the text. They incorporate four features: sentence complexity, vocabulary rarity, word surprisal, and context.
Base + Sentence Complexity Model
This model is a fully connected neural network that includes all sub-skill measures and sentence complexity text features as input. The network has two hidden layers, both of which have 18 nodes and use the ReLU activation function. Since we are predicting the probability of a binary event (correct/incorrect), a sigmoid layer follows the hidden layer. Loss is calculated using binary cross entropy. Adam optimization [32] is also used.
Base + Rare Word Use Model
This model is a fully connected neural network that includes all sub-skill measures and rare word use as input features. The network has two hidden layers, both of which have 14 nodes and use the ReLU activation function. Following the hidden layer there is a sigmoid layer. Loss was calculated using binary cross entropy and optimization was done using Adam.
Base + Lexical Surprisal Model
This model is a fully connected neural network that includes all sub-skill measures and lexical surprisal features as input. The network has two hidden layers, both of which have 18 nodes and use the ReLU activation function. Following the hidden layer, there is a sigmoid layer and the loss was calculated using binary cross entropy. Adam was used for optimization.
Base + Context
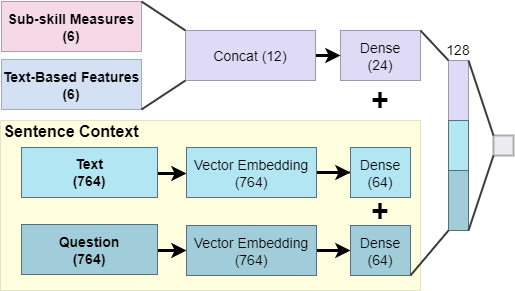
This model, shown in Figure 4, is a neural network that includes two parts, sub-skill measures (Base Model) and context as represented through sentence embeddings.
The six sub-skill measures are first passed through a 6x12 dense layer.
The sentence context part starts with two vectors: one represents the embeddings from the text and the other that of the question. Each vector is then passed through a 764x64 dense layer and transformed into 64 nodes.
We concatenate the sentence embedding and sub-skill measures into one fully connected layer followed by a hidden layer with 128 nodes. A sigmoid layer follows the hidden layer. Once again, loss was calculated using the binary cross-entropy function, and Adam optimization was performed.
Full Model
The Full Model (Figure 5) consists of all sub-skill measures from the Base Model, sentence complexity, vocabulary rarity, word surprisal, and sentence context. This should allow us to best capture the language features of the tests that might affect children’s reading comprehension performance.
We manually tuned the number of nodes in each layer. Specifically, for the dense layer after concatenating sub-skill and text-based features, we tried {12, 24, 48, 96}; 24 nodes had the best performance. For the dense layers after vector embedding, we tested values among {32, 64, 128, 256} and picked 64. Both dense layers from the vector embeddings are kept at the same size, and no individual testing was done. For the last layer, where all three hidden layers were combined, we tested among {32, 64, 128, 256} for number of nodes and 128 nodes yielded the best result.
Hyperparameter Tunning
For all of our models, we tested three learning rates: .01, .001, and .0001. The learning rate of .001 returned the best result for all models. Table 3 shows tunning details for the number of nodes in the two dense layers that are part of our models. We kept the node number the same for both dense layers during tuning.
Model | Values Tested | Value Chosen |
|---|---|---|
Base | 6, 12, 24 | 12 |
Base + Sent. Complex. | 9, 18, 36 | 18 |
Base + Context | 64, 128, 256 | 128 |
Base + Rare Word Use | 7, 14, 28 | 14 |
Base + Lexical Surprisal | 9, 18, 36 | 18 |
Note. Sent. – Sentence, Complex. – Complexity
Model Evaluation & Analysis Procedures
We used k-fold cross-validation with k = 10 to evaluate all models. Since predicting whether a student answers a question either correctly or incorrectly is equally important, all models were optimized for accuracy during hyperparameter tuning. The whole training process is done within approximately two hours on a commodity machine after hyperparameter tuning.
We used McNemar’s test to determine whether there is a significant difference between the Base Model and all other models. McNemar’s test compares machine learning based classifiers in pairs by looking at the correct and incorrect classification each model makes. It can distinguish model differences even if the models yield similar accuracy results [37]. Bonferroni step-down correction was used to control for multiple comparisons; the adjusted p-values are reported.
Since it is not enough to determine which model performs best, we used integrated gradients [50] to examine feature importance. Integrated gradients quantitatively shows the effect each feature has on the final prediction. This measure evaluates the contribution of features (feature importance) to the prediction results of machine learning models. It does so by gradually increasing the values of the input features from those of a baseline. We used the value zero as our baseline since it represents zero information in our study. This method computes the integral of gradients with respect to inputs along the path from outputs to inputs in a neural network. Integrated gradients can provide insight into which features contributed to students correctly answering a question. A positive integrated gradients value shows an increase in the feature value that contributes to an increase in the output prediction value. A negative value indicates the opposite. The magnitude of the value shows how much the input feature influences the output. A value of zero means the measure or feature did not contribute to the prediction. There is no specific range for integrated gradients because the slope describing the relationship between the input and output (gradient) is not bounded.
Results
What is the added value of including text features as input when predicting the correctness of question answering in reading tasks?
Model performance was measured through precision, recall, and accuracy (see Table 4). Chance accuracy for this prediction task was 54%. The average training and validation accuracy difference for all models during cross validation is under 2%.
Model | Precision | Recall | Accuracy (%) |
|---|---|---|---|
Base | .665 (.012) | .737 (.011) | 65.8 (0.76) |
Base + Sent. Complex. | .696 (.017) | .751 (.015) | 67.5 (1.17) |
Base + Context | .713 (.014) | .738 (.017) | 68.7 (0.91) |
Base + Rare Word Use | .704 (.009) | .751 (.019) | 68.1 (0.69) |
Base + Lexical Surprisal | .691 (.014) | .756 (.019) | 67.6 (0.74) |
Full | .715 (.016) | .747 (.013) | 69.8 (0.95) |
Note. Sent. – Sentence, Complex. – Complexity
The full Model yields the highest accuracy and precision. It also had relatively high recall, suggesting the Full Model performs well. The Base Model had high recall but the lowest precision and accuracy. Adding any one of sentence complexity, rare word use, or surprisal to the Base Model was associated with an increase in precision while maintaining similar recall, demonstrating the potential for text-based features to support model prediction. Adding sentence embeddings to the Base Model resulted in the highest precision among all models except for the Full Model. However, it also had the lowest recall value. Thus, the model that included context, as represented through embeddings, made the lowest number of errors in its predictions of answering a question correctly. However, it also had the most prediction errors for questions that students had answered incorrectly.
The Full Model and Base + Context Model show significantly higher predictive accuracy than the Base Model (see Table 5). The performance of the remaining models did not show significant differences from that of the Base Model.
Since the full model and Base + Context Model both outperformed the Base Model, we compared these top-performing models to see whether one outperformed the other. While the difference is relatively small, the Full Model achieves higher performance than the Base + Context Model suggesting that representing many aspects of the text is important.
Model 1 | Model 2 | McNemar Test Statistic | p |
|---|---|---|---|
Full Model | Base Model | 7.771 | .025 |
Base + Context | Base Model | 8.040 | .024 |
Base + Sentence Complexity | Base Model | 0.547 | 1 |
Base + Vocabulary Rarity | Base Model | 2.972 | .340 |
Base + Lexical Surprisal | Base Model | 0.105 | .746 |
Full Model | Base + Context | 4.971 | .026 |
Full Model Features
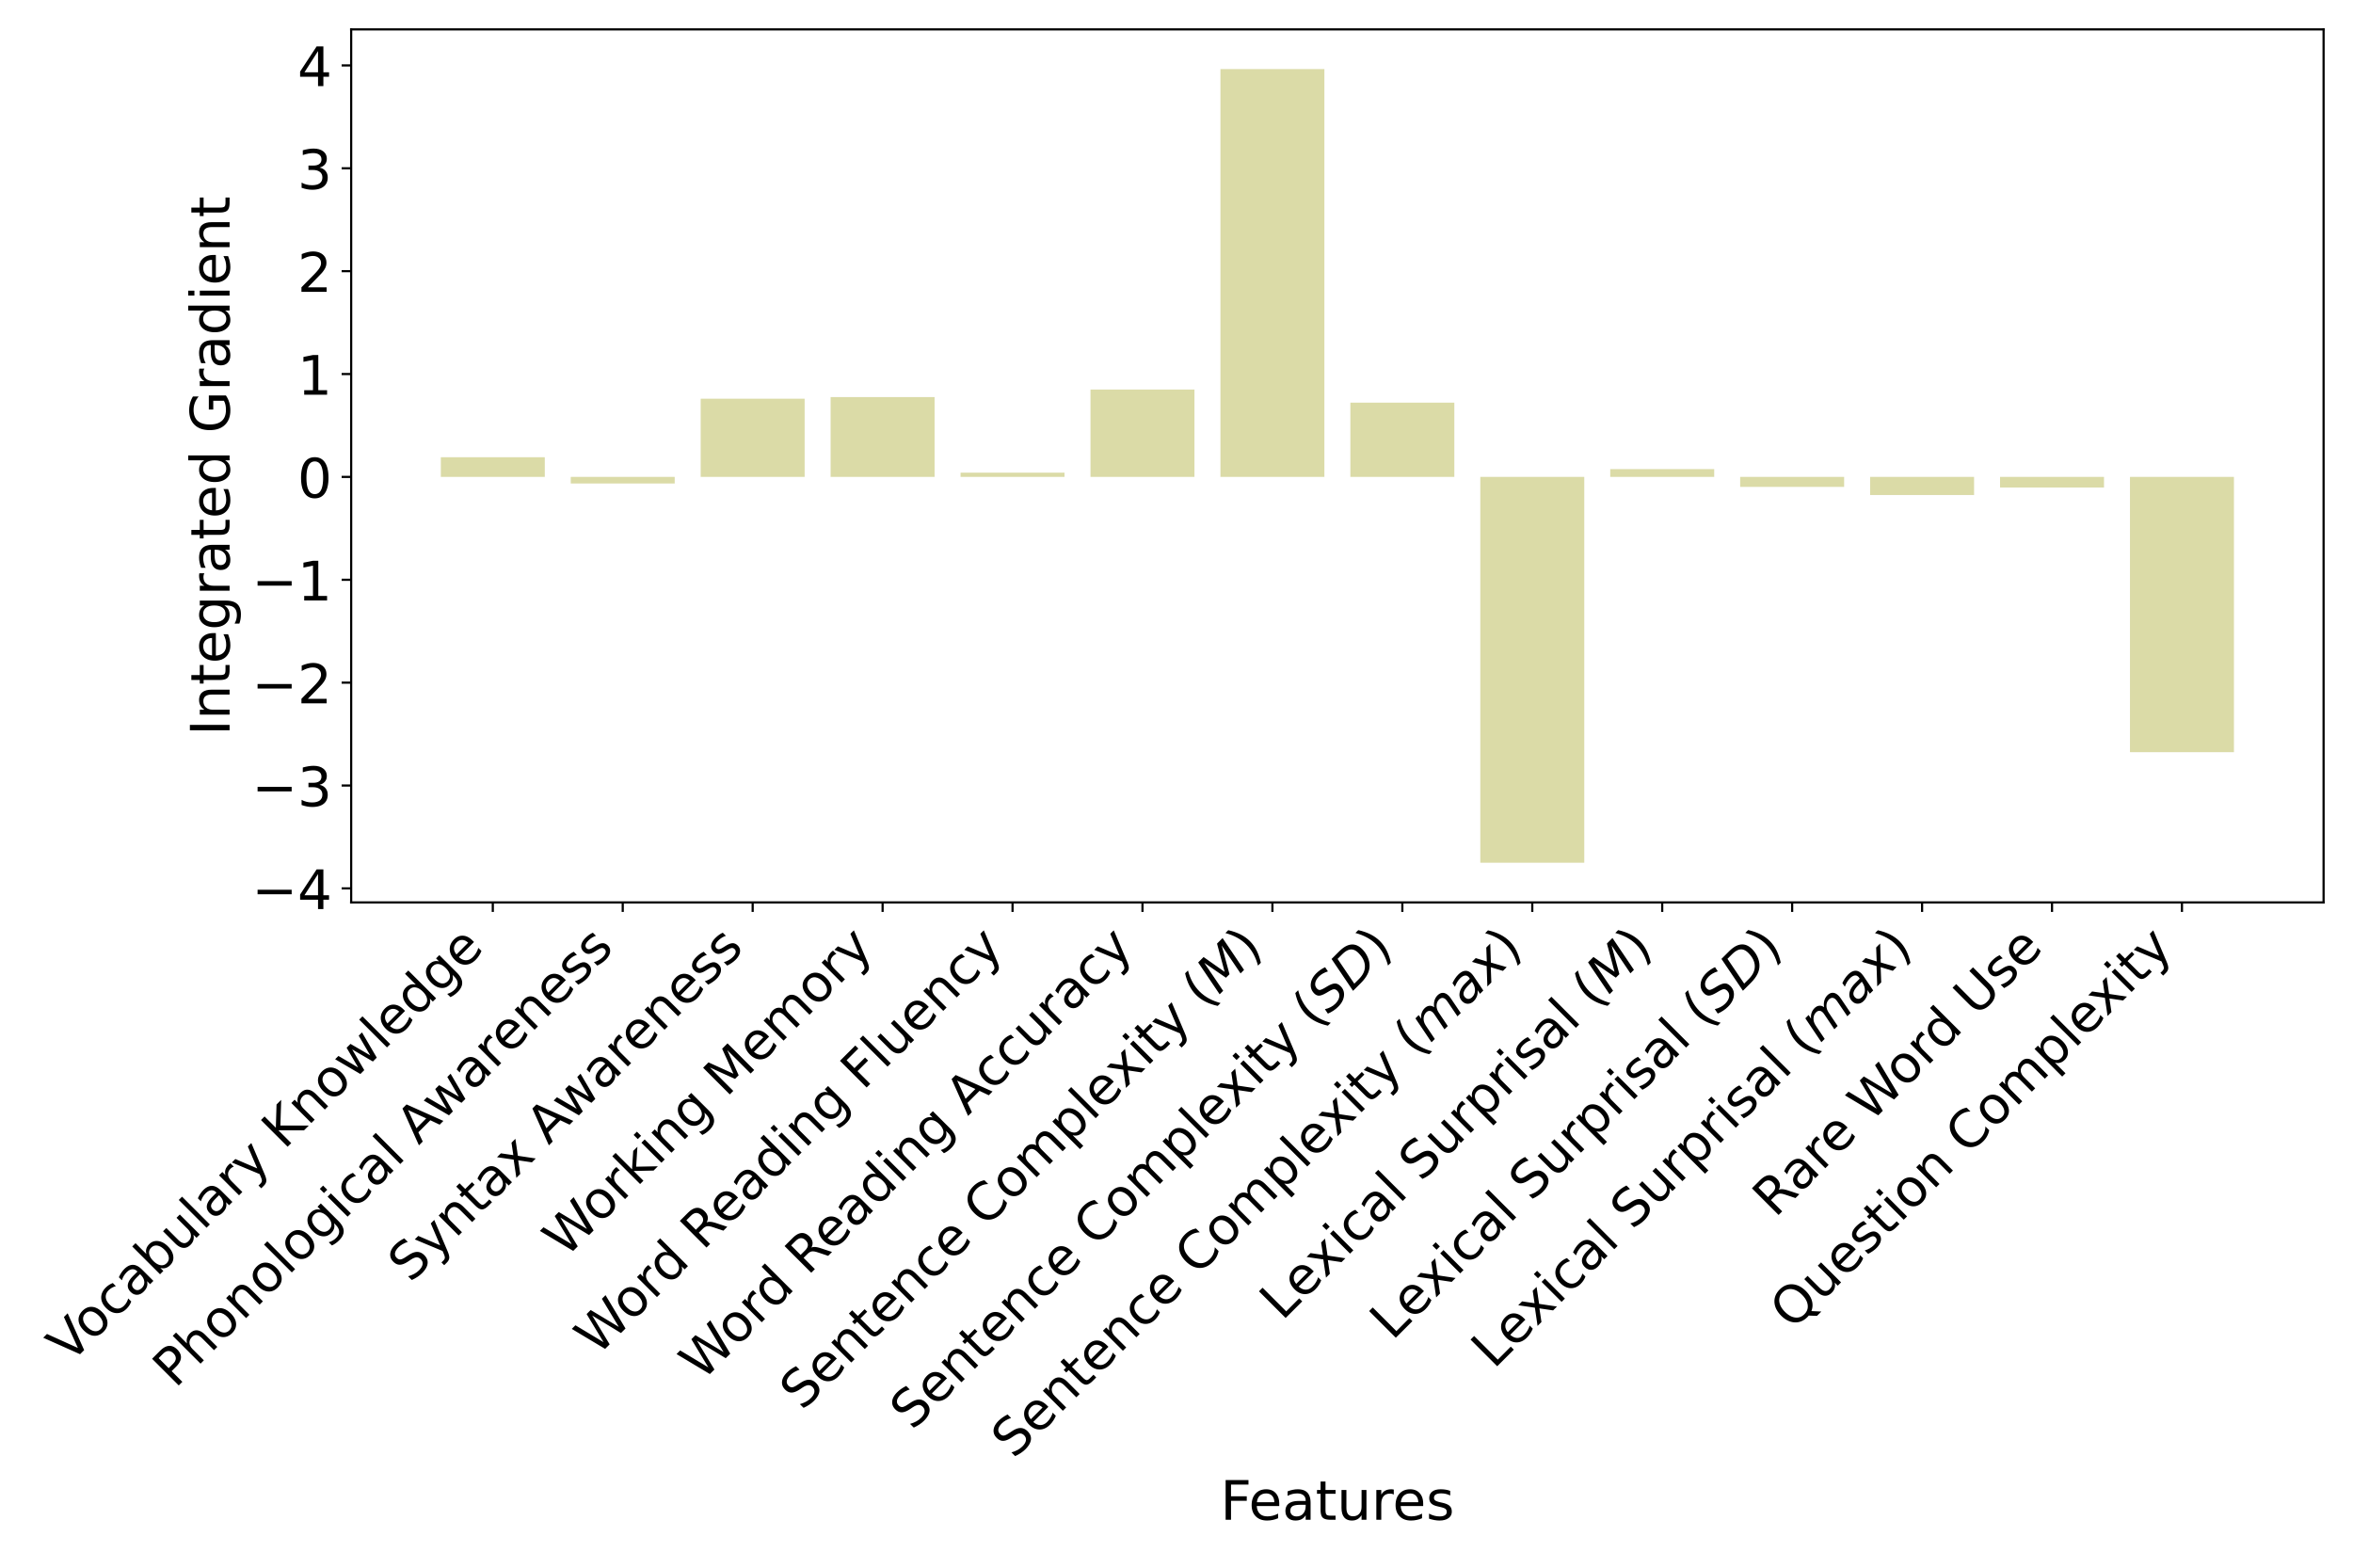
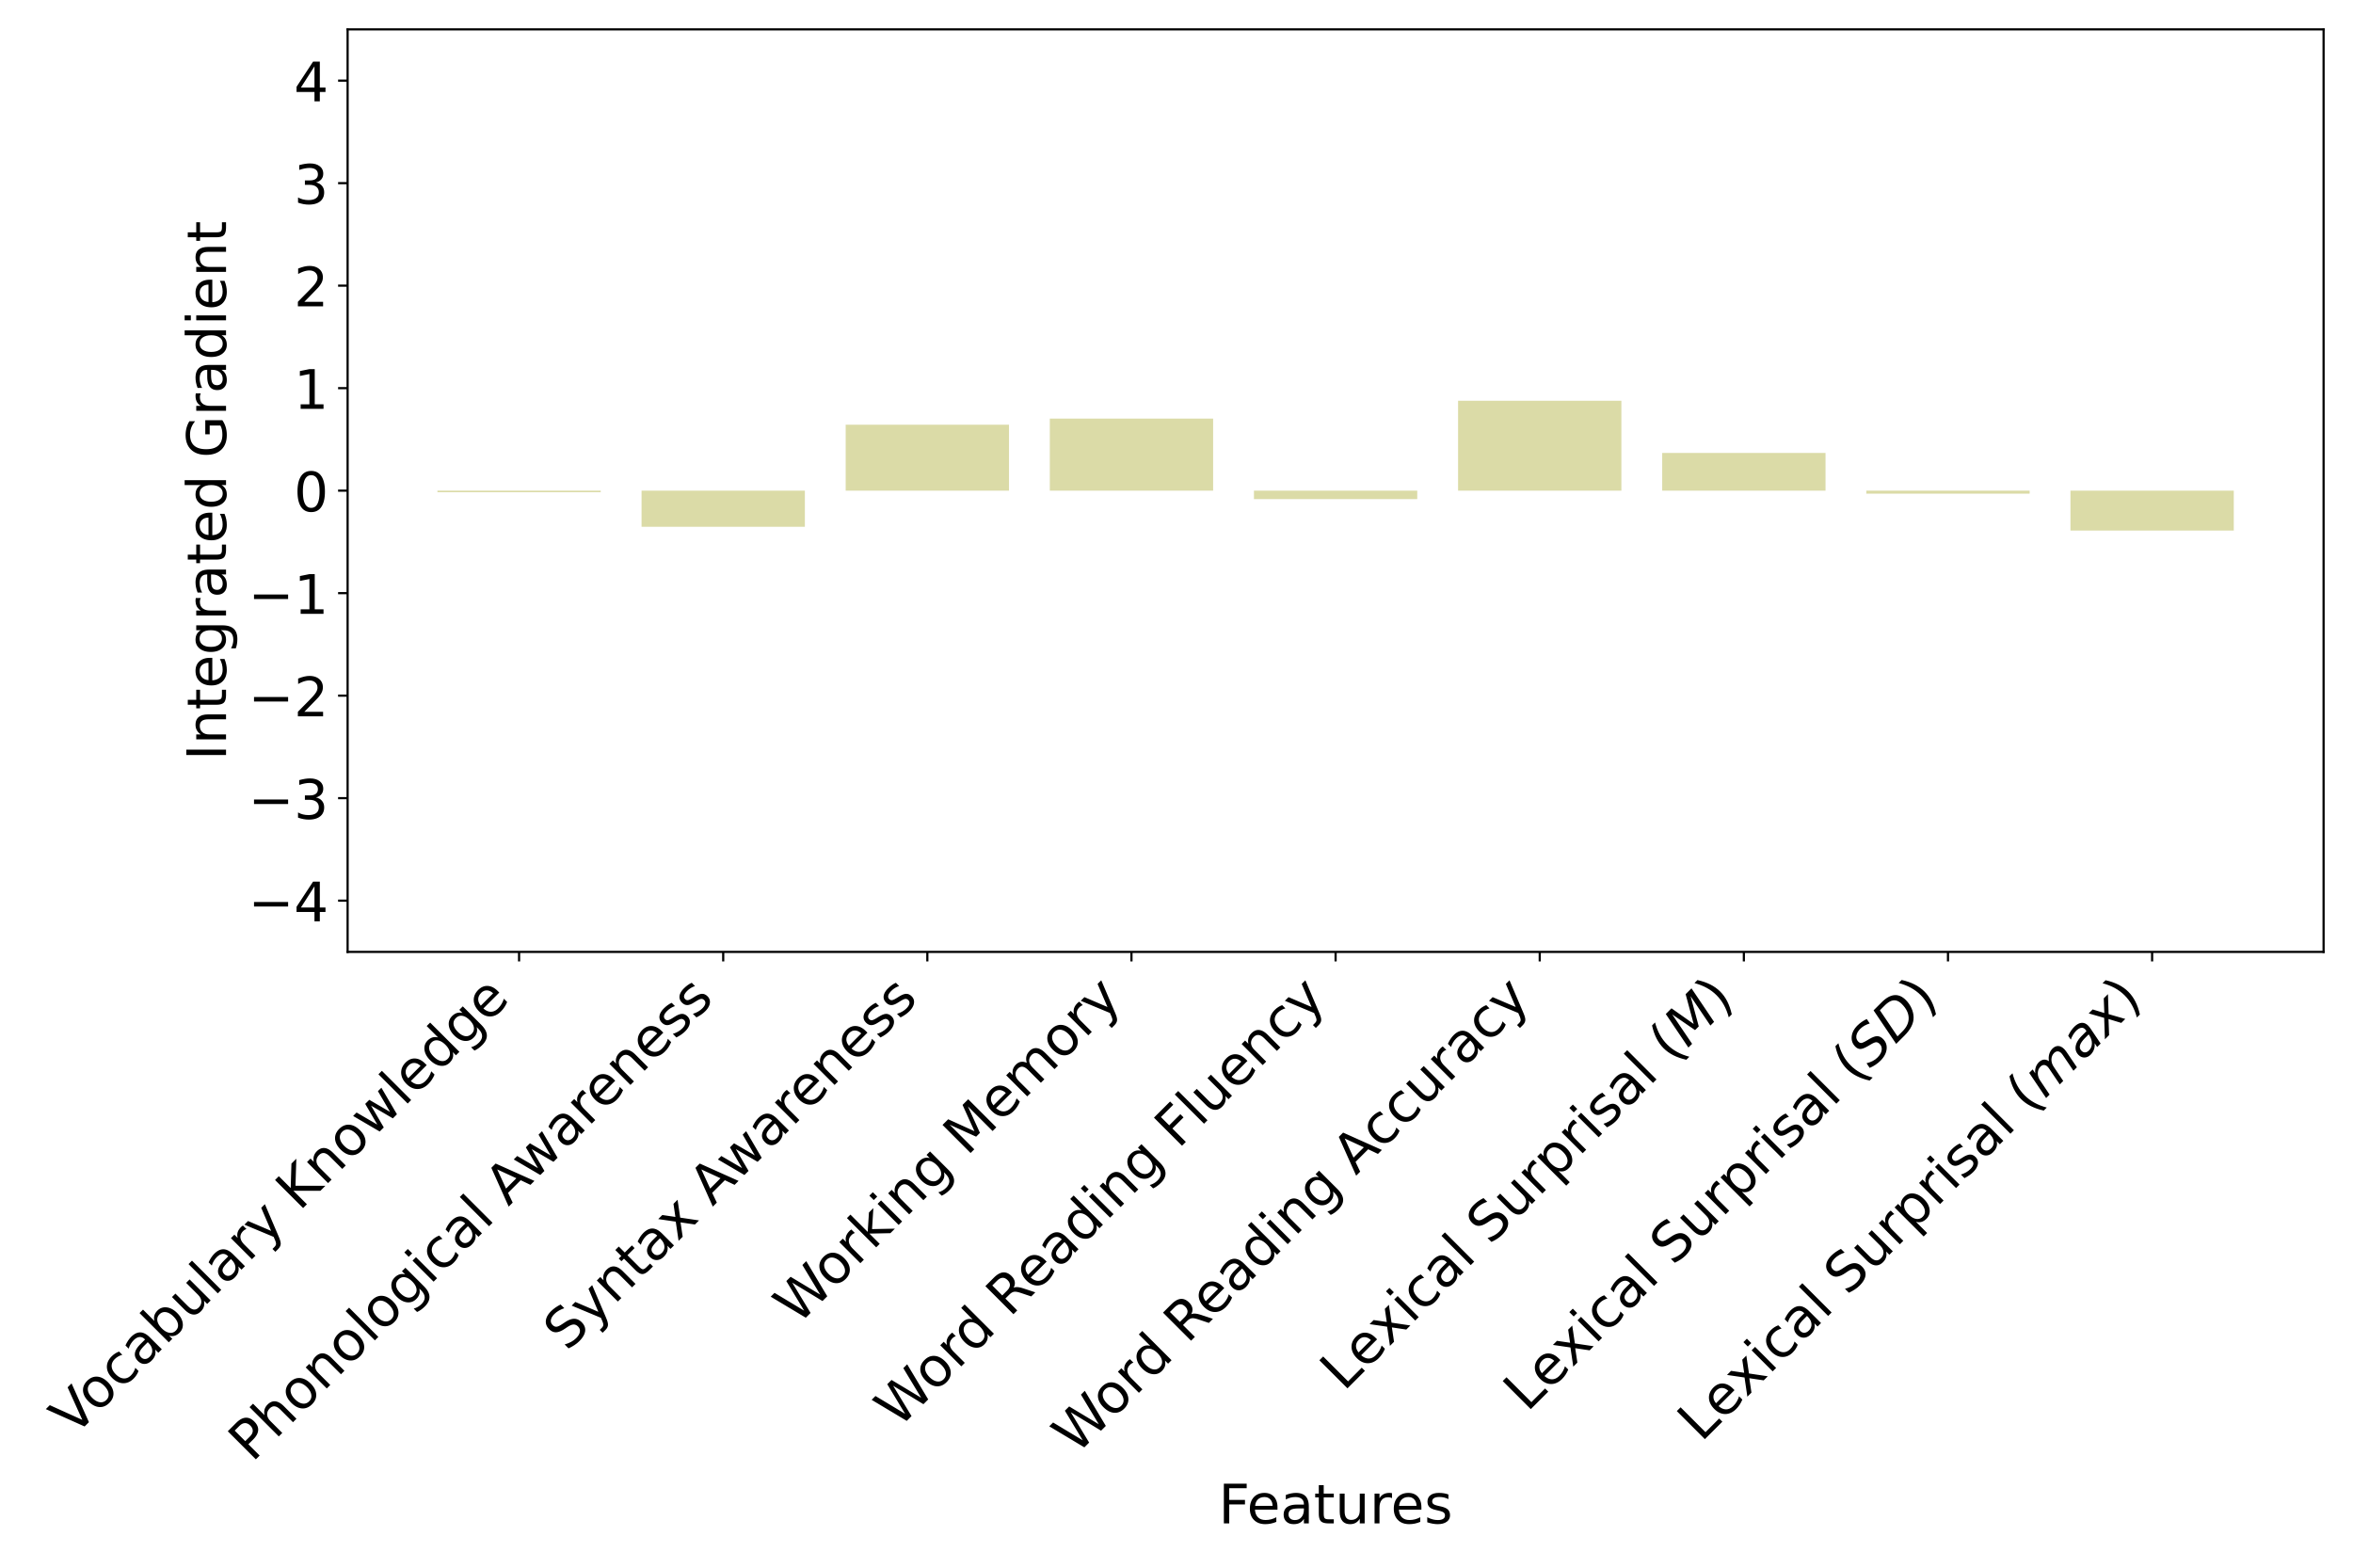
We used integrated gradients to examine how much each text-based feature affected whether the model would predict that a student answered a question correctly. In Figure 6, the y-axis shows the value of integrated gradients for each feature, with large values indicating the feature has a strong influence on the model’s prediction. A positive value indicates the feature contributes to predicting a question is answered correctly. Negative values mean the feature supports the prediction of incorrect student answers.
The integrated gradient results for the Full Model show that an increase in maximum sentence complexity and mean question complexity helps the Full Model predict when students will be more likely to incorrectly answer a question (Figure 6). In contrast, predicting when students will correctly answer a question is supported by an increase in maximum (max) sentence complexity. Contributions from all other features are low.
Sentence Complexity Features
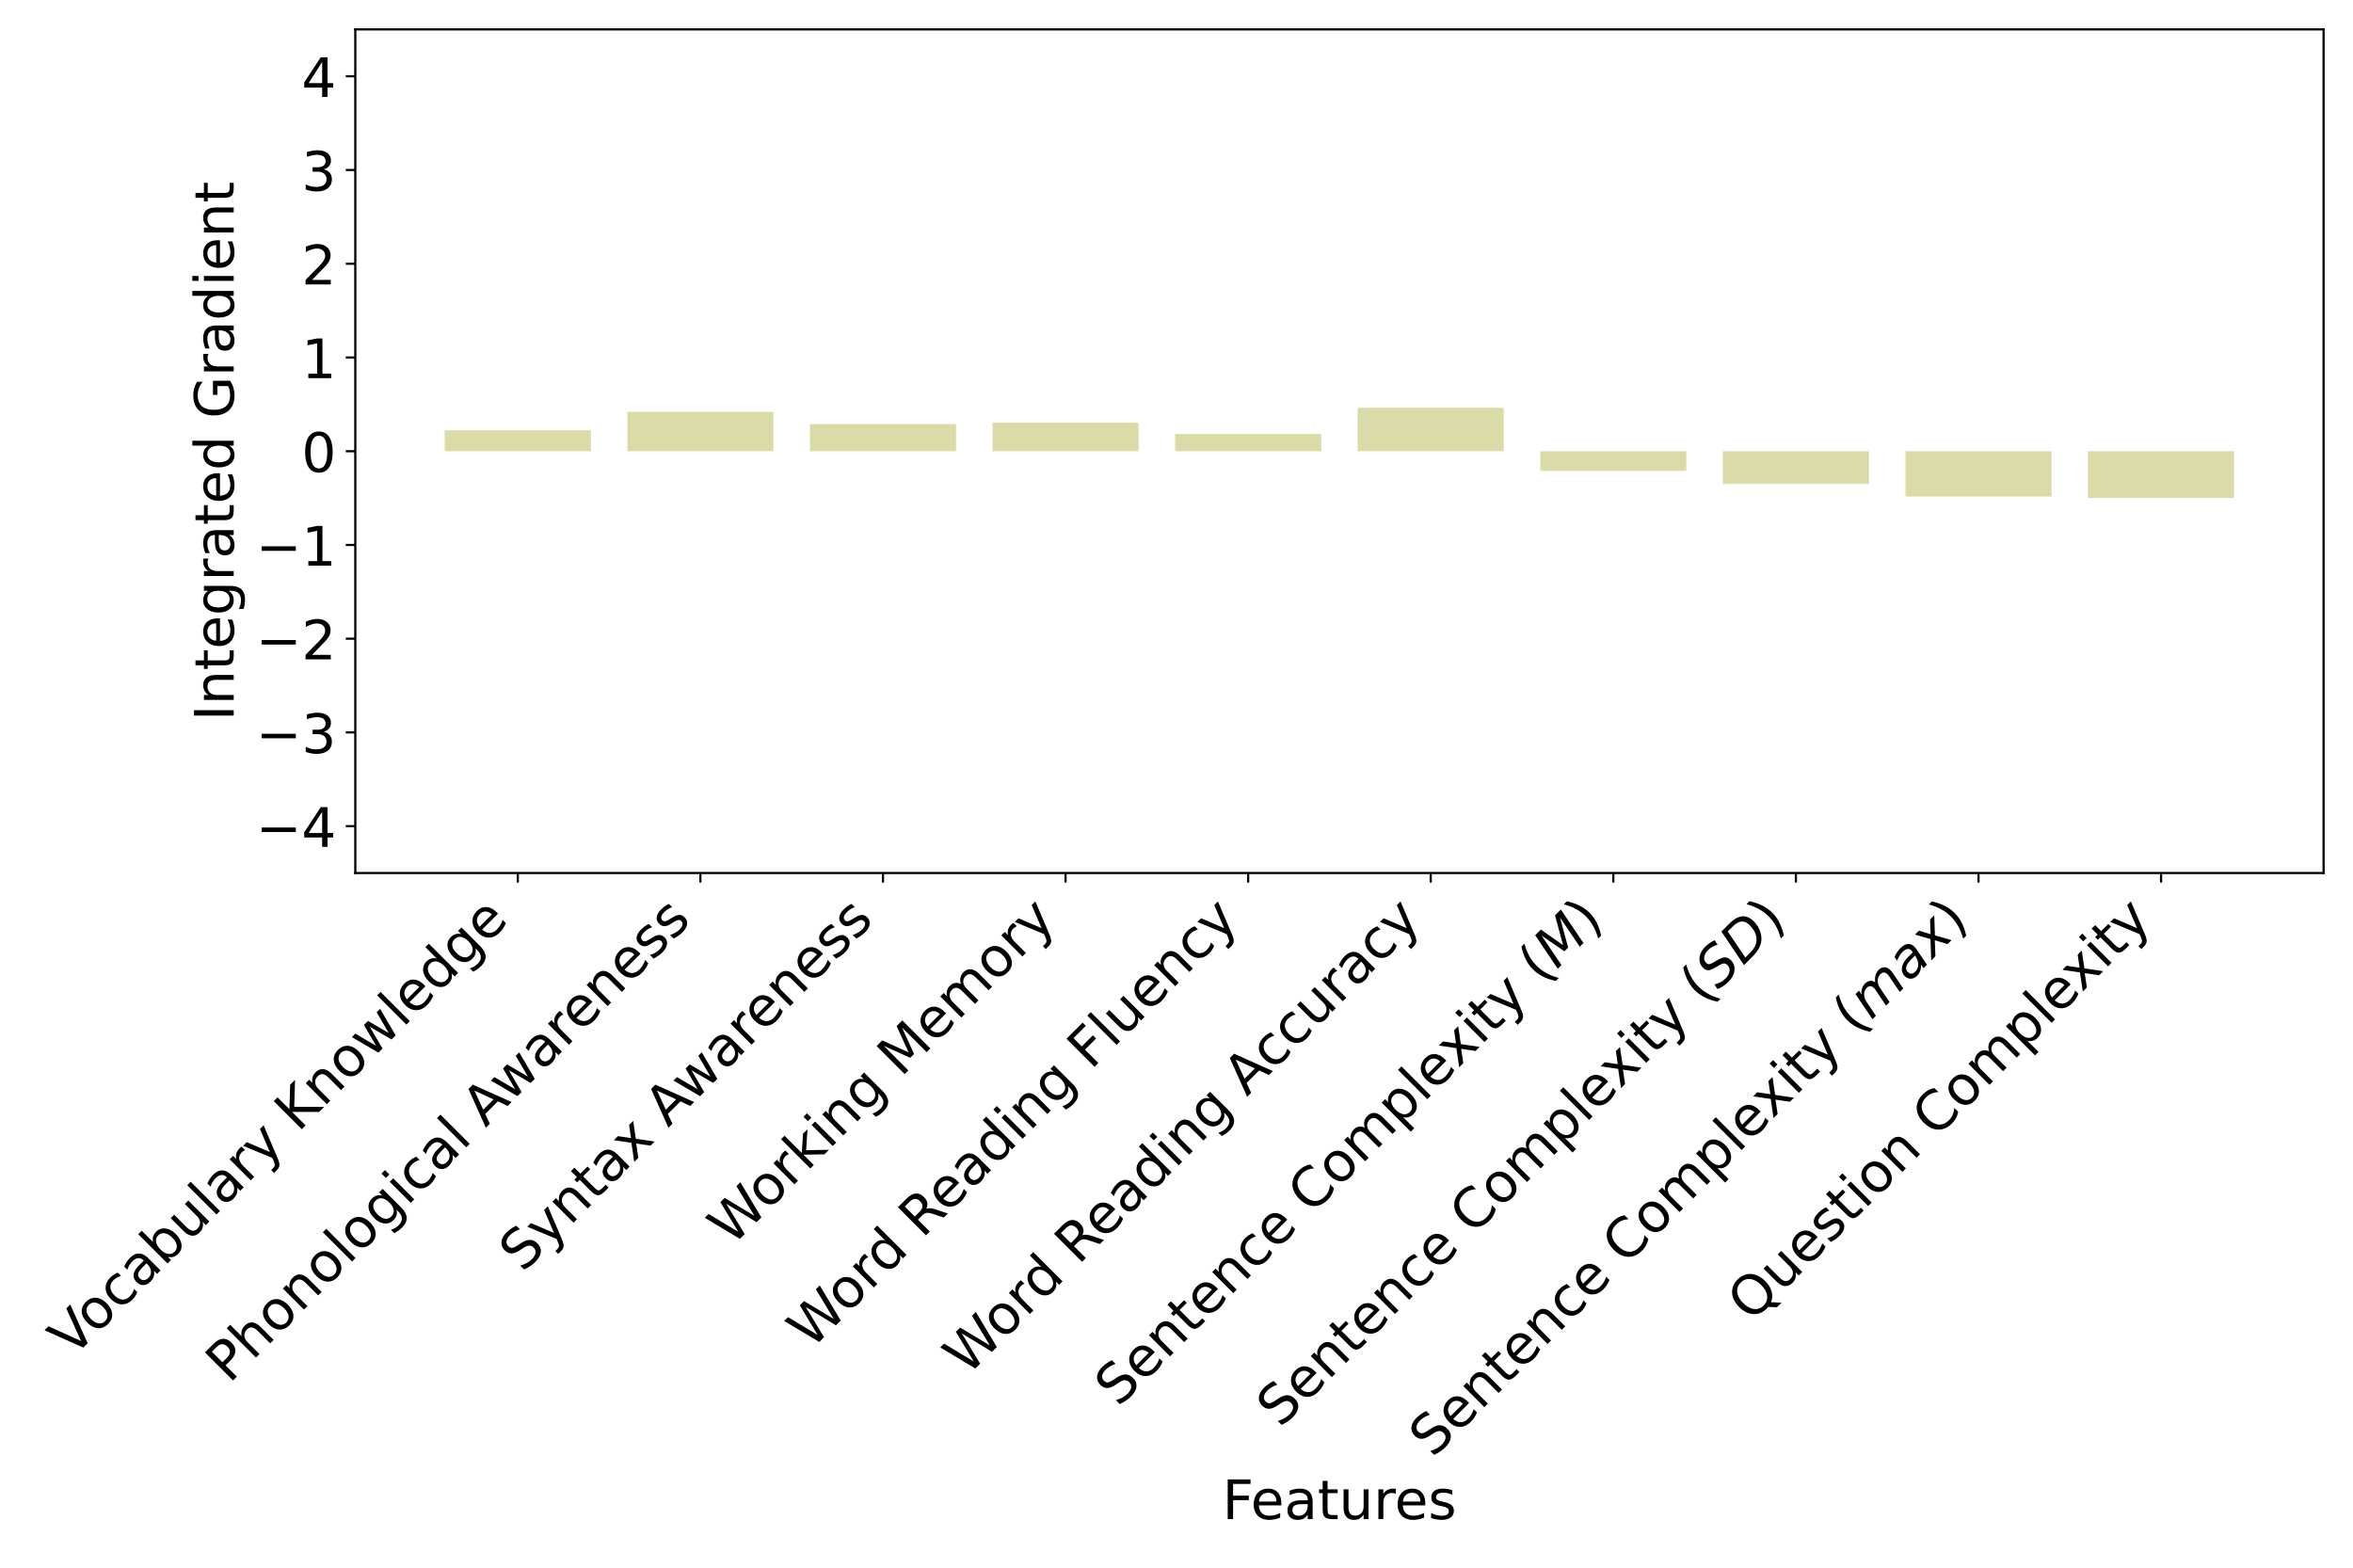
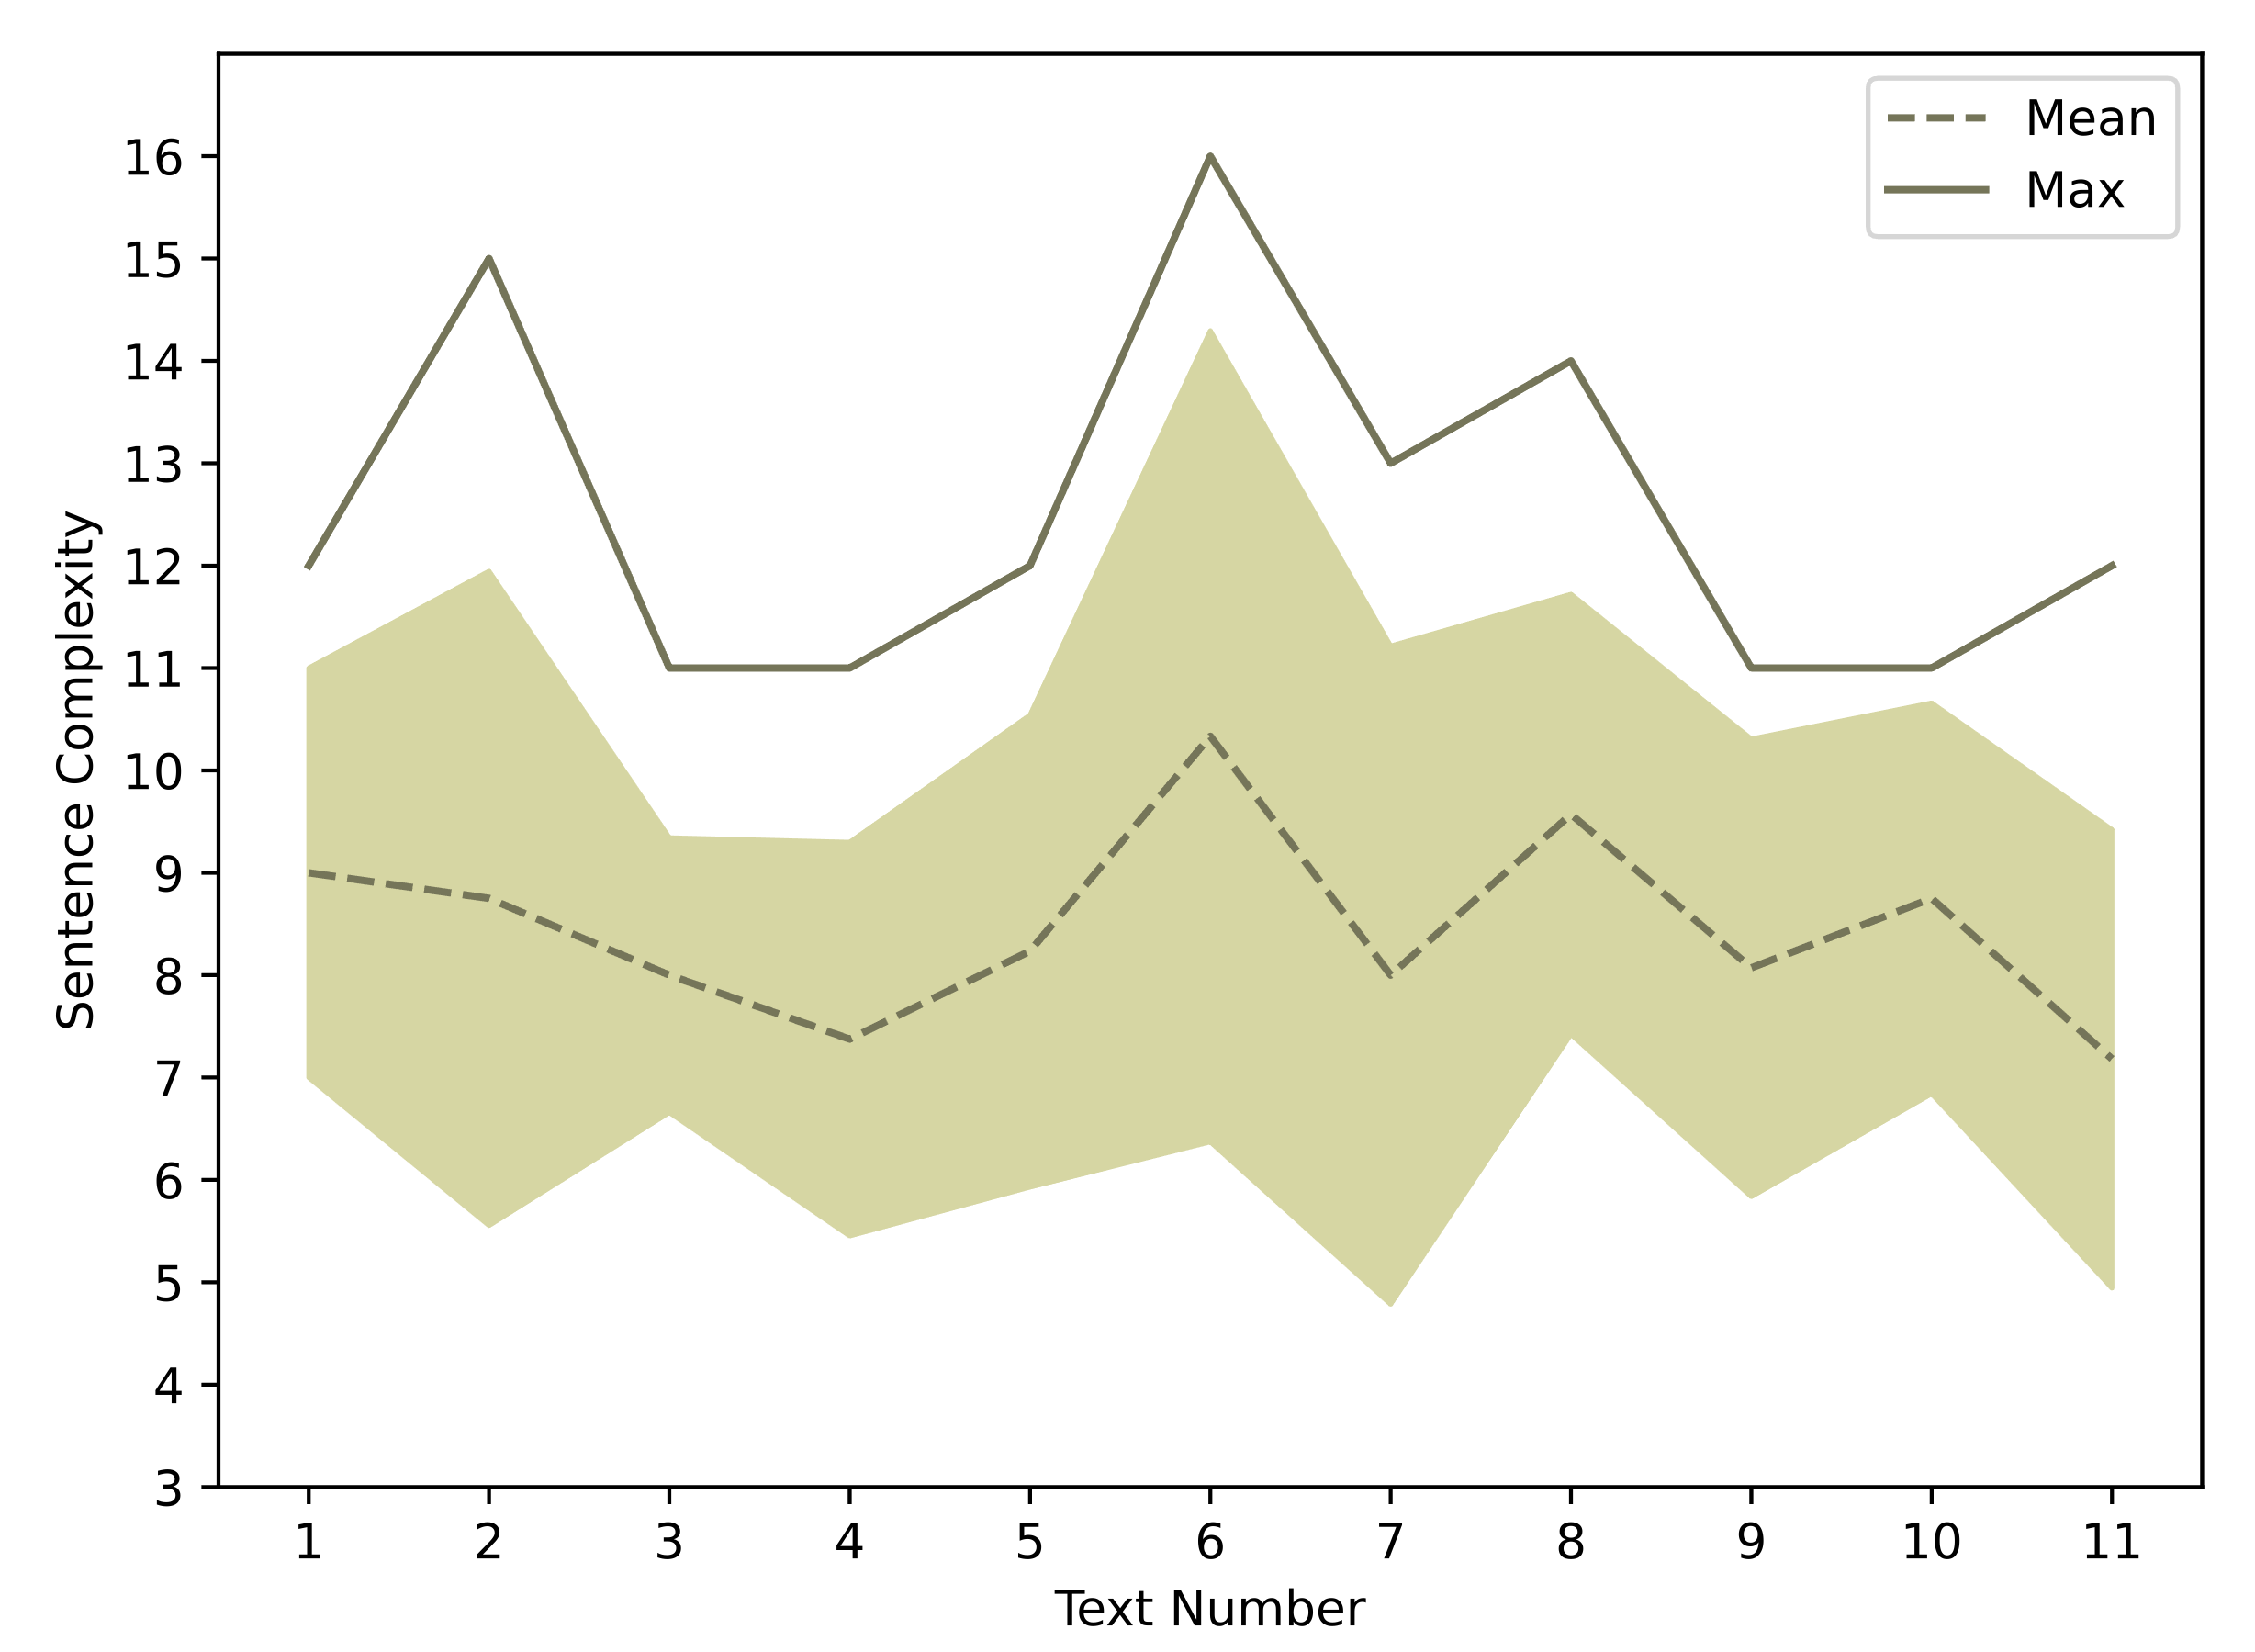
Here we investigate how much the mean, standard deviation, and maximum values of sentence depth contributed to the prediction in the Base + Sentence Complexity Model.
As can be seen in Figure 7, the integrated gradient results do not show substantial contributions from any of the features when they are used on their own. To see if this finding is due to invariability among different instances, we plotted the feature value distribution across all texts (Figure 8). As shown by the values for texts two, six, and eight, which are relatively high, a lack of variability fails to account for the limited contribution of this feature.
Lexical Surprisal Features
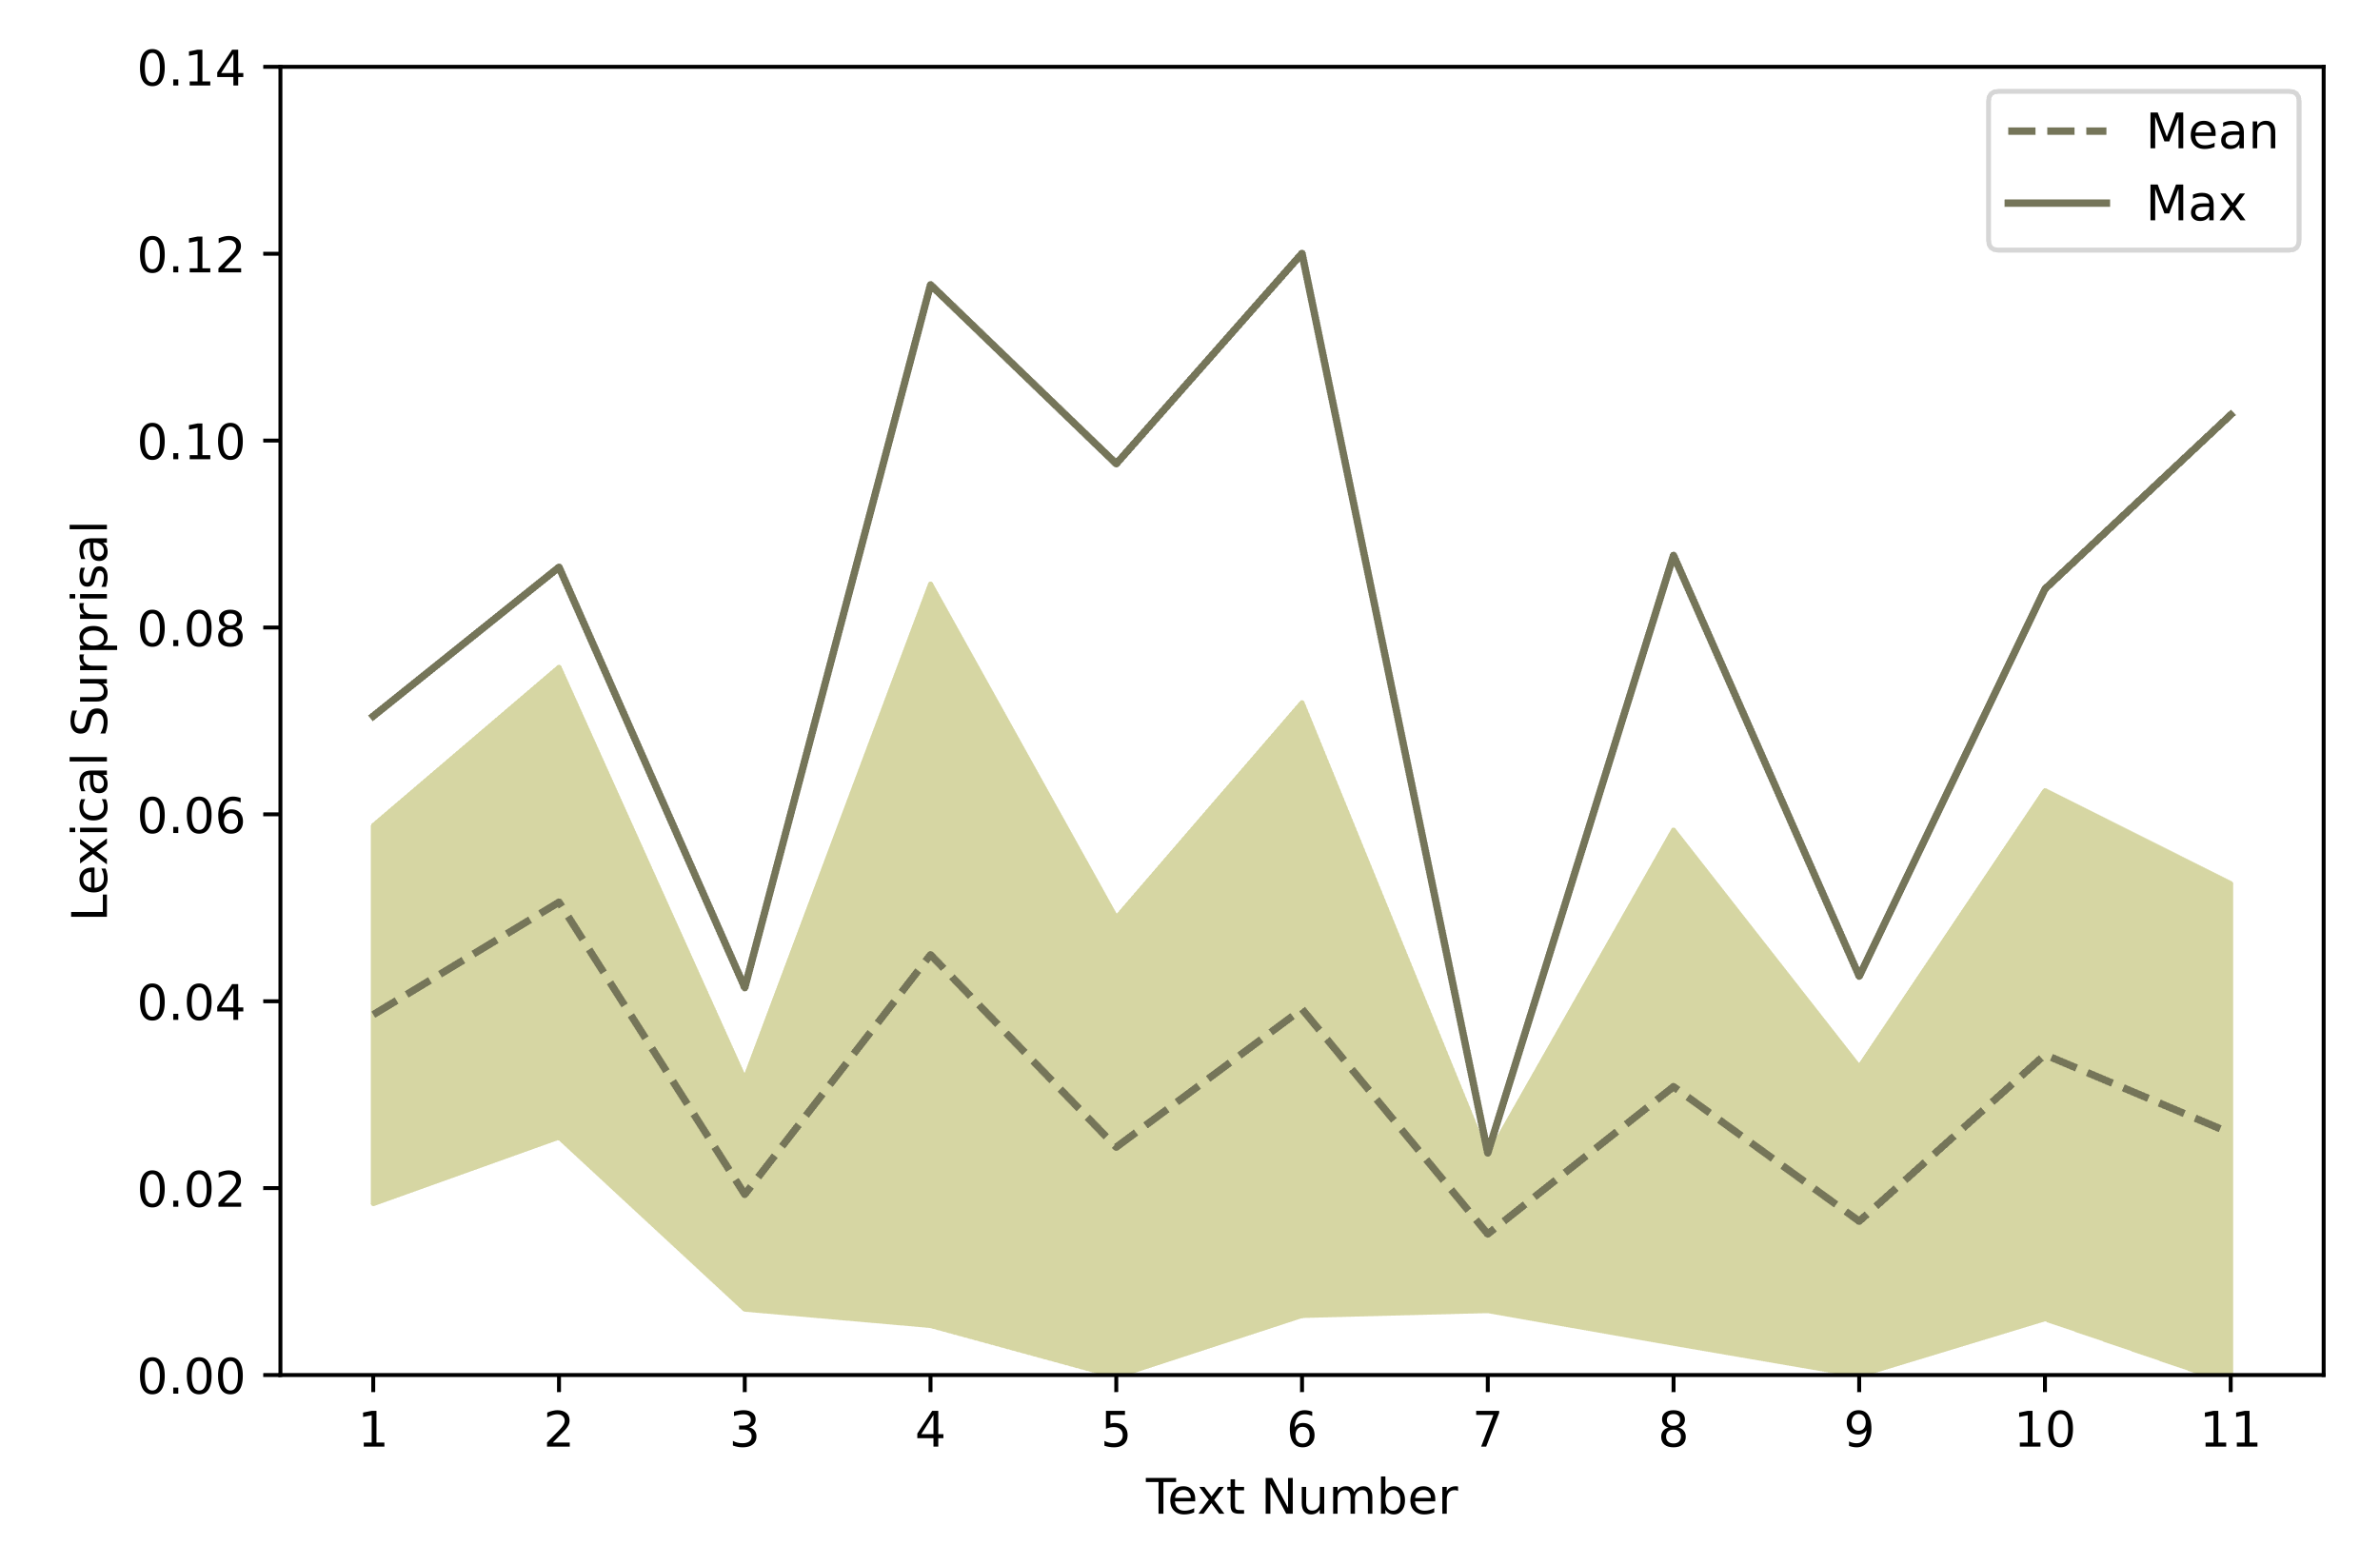
Here we investigate how much the mean, standard deviation, and maximum values of lexical surprisal contributed to the prediction when the Base + Lexical Surprisal Model was used. The integrated gradients results show both the mean and maximum of lexical surprisal contributed little to the prediction (Figure 9). Mean has a small positive impact while maximum has a small negative impact. Given the relatively small gradient, we checked variability across texts: Figure 10 shows that the mean lexical surprisal is relatively stable (its values range from .02 to .04) whereas the maximum lexical surprisal values vary considerably (~.02 - .12).
Error analysis
We compare the models that use text features as input to the Base Model because the Base Model does not incorporate any text features. Thus, it is not biased towards or against any of the readings or questions. By comparing model performance against that of the Base Model, we can see where a particular feature supports the task and where it performs poorly.
Base + Rare Word Use Model performed especially poorly in Text 7 compared to the Base Model. Text 7 is an expository paragraph containing scientific facts about snow colors. The rare word use feature of Text 7 has a high value of .550 where the average rare word use value across all texts (including Text 7) is .493. The most errors occur for question 30 in Text 7, which is an inference question where the answer is not explicitly stated in the text.
Among the questions where the Base + Rare Word Use Model out-performed the Base Model, Text 8 has the highest percentage of correct predictions. Questions 34 and 35 from Text 8 have a particularly high correct rate and rare word use rate. Both questions are non-inference questions. These differences in performance indicate that this model performs well in situations when the vocabulary is difficult and questions are direct.
Base + Sentence Complexity Model output differs in many places from that of the Base Model for Text 7. When comparing these two models on the Text 7 questions, we see that it is common for one of the models to correctly predict student performance when the other is incorrect. All three questions that belong to this text have high error rates in classification. The mean depth feature of this text is 10.3 whereas the average depth across all texts is 8.4.
Base + Context Model predictions disagreed often with those of the Base Model for Text 11, questions 44, 45, and 48. Question 44 and 45 are inference questions and question 48 uses a near synonym for a keyword from the text to assess comprehension. The Base + Context Model performed particularly well in Text 8, question 31 and 34; the answers to these questions can be explicitly found in the text. This differential performance suggests that adding sentence context information supports model performance when predicting student responses to non-inference questions.
Full Model prediction errors come from questions 44 and 45 from Text 11 in most cases. These errors are similar to those made by the Base + Context Model, but the Full Model performs slightly better: the percentage of prediction errors decreased from 22.5% to 18.5% (question 44) and 19.3% to 16.9% (question 45). The Full Model performed particularly well on Text 4, question 14 and 16. Text 4 is a relatively short narrative text containing sentences with simple structures, and the answer to both of the Text 4 questions is easy to find in the text.
Discussion
To answer the research question, “What is the added value of including text features as input when predicting the correctness of question answering in reading tasks?”, we trained and evaluated models using information about students’ oral language skills and features from the texts they were reading as input. The developed models were used to explore how these features supported the prediction of student performance on reading-comprehension questions. The text-based features each provide a hidden representation of aspects of the text that were expected to affect reading comprehension. Individually, their inclusion does not appear to lead to strong model performance; however, their joint use supports prediction across a variety of text and question types.
It appears that the strengths identified when adding some features compensate for the weaknesses associated with adding others. For example, sentence complexity performs poorly when the vocabulary is challenging, which can be captured through the addition of the rare word use feature. Similarly, the context feature underperforms on inference questions, which seem to be better supported by the combined use of all features. Analyses of feature contributions to model performance (Section 5.1.2), and the error analysis (Section 5.2) indicate that the features interact. The complicated nature of how features supported the prediction task suggests that text characteristics need to be treated in a nuanced manner if we are to understand children’s reading comprehension or develop learner models that can be used to adapt reading materials to children.
Text-based Feature Contributions to Prediction
Each of the text features that we added appeared to improve model accuracy when they were used jointly (Full Model). The only text feature that supported improved model performance on its own was the sentence context feature that used sentence embeddings, and this model was outperformed by the Full Model that included sentence context as one of its text-based features. Given the relatively high contribution of sentence complexity features to the Full Model and the low contribution of most other text-based features (as identified using integrated gradients - Section 5.1.2), the sentence context and other features likely augmented the information provided by the sentence complexity feature.
The improved performance associated with adding sentence context information may be the result of it implicitly capturing several aspects of the text. Universal sentence encoders, which were used to extract the sentence context feature, incorporate word order, sentence meaning, and grammar into a single vector so they implicitly capture some aspects of sentence complexity and vocabulary. They also implicitly capture aspects of the content domain through their representation of the surrounding text. The support provided by adding the sentence context feature parallels Hirsch’s [28] findings on reading comprehension of elementary students. Hirsch found that a gap in reading comprehension appears (or is widened) when more advanced domains (e.g., math, science) are introduced. This effect of domain context was also found to be more influential when compared to differences in vocabulary size and decoding skills among students in elementary school. Our models accounted for the vocabulary knowledge (i.e., PPVT-M score) of children and added text-based features that represent the vocabulary knowledge needed to understand the texts (i.e., rare word use). This text-based feature only contributed to improved model performance when used in combination with sentence context. This lack of contribution by rare word use on its own suggests that Hirsh’s domain influence findings can be partly captured through the sentence context feature.
The sentence complexity of both the text and the question contributed substantially to predictions when sentence complexity was used alongside other features even though this feature did not improve model performance when added to the Base Model by itself. This pattern suggests the sentence complexity of both the text and the question interacts with other features to produce meaningful predictions. That is, sentence structure by itself does not determine the difficulty students may experience when trying to understand a piece of text. This is consistent with our error analysis (Section 5.2) which identified high error rates for questions with low levels of rare word use and high levels of mean sentence complexity.
The rare word use feature improved prediction task performance (section 5.1.1), which is consistent with the lexical quality hypothesis [44]. Lexical quality is typically interpreted in relation to the role of high-quality word representations in reading comprehension; the flip side is that the presence of rare words will negatively impact reading comprehension because of their connection to the precision and flexibility of a mental representation of a word. Our rare word use feature provides a way to model the demands that a text will place on lexical quality, which will in turn be related to reading comprehension. That said, it seems that the most frequent prediction error emerged for inference questions accompanying a scientific information text with high levels of rare word use.
One’s knowledge of vocabulary and exposure to language influence what one expects to see. Like with rare words, people can be surprised by the use of a relatively familiar word in an unexpected collocation or context [23]. The lexical surprisal feature was meant to capture this element of how we process language. In contrast to our expectations, the n-gram language model that we used to measure lexical surprisal did not appear to help predict performance on reading comprehension questions, either on its own or in combination with other text-based features. Its lack of contribution to predicting student correctness may be partly due to the limited diversity of content in the training corpus. For future work, the Corpus of Contemporary American English [9] is another publicly available dataset that could be used to model surprisal for children’s readings. Additionally, using other language modelling approaches, such as a PCFG [46] or recurrent neural network grammars [26], to obtain surprisal measures might yield more accurate predictions since these language modelling approaches can output a more nuanced estimate of surprisal. It is also possible that rare word use and sentence context capture this aspect of language processing for the target text. This suggests a need for follow up work that can help to tease apart the contributions of these vocabulary-related features.
Like the Base + Context Model, the Full Model is also less accurate when predicting correctness for inference questions. This shortcoming is mitigated by the inclusion of other text-based features that supported the prediction task. The analysis of feature contributions to this model (see Section 5.1.2) shows that the features that supported the prediction of a correct student answer (the mean and standard deviation of sentence complexity in a text) were different from those used to inform the prediction of which questions would be answered incorrectly (the maximum sentence complexity in a text and the sentence complexity of the question). This finding parallels those of Perin and Lauterbach [45], who found that there was consistency in the features that predicted strong performance in student writing and that different features predicted low student scores. The fact that none of the oral language skills captured through the individual knowledge and sub-skill measures supported the prediction of which questions a child would answer incorrectly suggests that Perin and Lauterbach’s argument for there being many ways to perform poorly and only a few to perform well might be extendable to reading comprehension. When combined with the ability of text-based features to predict lower performance, this finding suggests text-based measures are needed to fully capture information about the reading-comprehension challenges that children face.
Implications for Understanding Reading
In addition to needing text-based features to predict when students will incorrectly answer a question, the error analyses showed that different text-based features were useful for predicting answer correctness for each type of reading comprehension task (inference, retrieval from text). This finding implies that we need to consider different features of a text when trying to understand children’s inferencing abilities or their ability to identify the content that is relevant to a question.
Beyond demonstrating the potential utility of these text-based features for predicting student answers to reading comprehension questions, these models and the approaches used can provide insight into the text-related challenges that affect students’ reading comprehension based on their knowledge levels. Among these are the vocabulary used and whether its use matches that expected by a child based on their exposure to the language. It was expected that surprisal would support this prediction task since it has been predictive of reading times in some studies [46]. However, surprisal contributed little to model prediction, suggesting a need to further study the role of surprisal in children’s processing.
The different contributions of features to the prediction task (see Figure 6), suggest that the sentence context feature augments information provided by the sentence complexity feature. Students tended to have poor comprehension when there was even just one very complex sentence, and higher mean sentence complexity showed less effect on the prediction result. This indicates that children’s ability to answer a reading comprehension question is less affected when the sentences are more complex overall, compared to having a particularly complex sentence. The specific contributions of the mean, standard deviation, and maximum values of this characteristic of the text imply that all three measures should be used to better understand student reading abilities in relation to a text. Including the maximum sentence complexity helps to understand when students answer a question incorrectly and the mean and standard deviation help to understand when a question is answered correctly. Combined, these provide a more robust view of how learners comprehend text.
Implications for Learner Modelling and Adaptation
As reported in our results, adding the sentence context feature to the Base Model supported better predictions of correct responses to a comprehension question. The sentence context feature also produced a better performing model when combined with the other text-based features. The underperformance of the Base + Context Model relative to the Full Model may be due to embeddings not having explicit representations of sentence complexity and lexical surprisal. The Base + Context Model’s lack of explicit representation of these specific linguistic traits may be why our Full Model had the best performance.
The performance of the Full Model suggests that we can augment the learner modelling and adaptation process in educational technologies by using features that are automatically extractable from texts. This implication is further supported by the performance of the Base + Context model. The sentence context feature relies on a heavily data-driven approach to support prediction for non-inference questions that share a similar context with the text. Since the addition did not support the ability to distinguish student performance on inference questions, additional mechanisms will need to be found to support prediction for inference-based questions, which are usually harder for students to answer than non-inference questions [48]. In our case, the inclusion of multiple text-based features, specifically rare word use, helped mitigate the limitations of the context feature when inference-based questions were being predicted. So, this strategy can be used until a more powerful feature is found.
As suggested by the insights gleaned from the sentence complexity measures, these features should be included to better identify which questions might be within a student’s abilities and which might not. This suggestion builds on Scott’s findings from a study investigating sentence comprehension [47]. In both Scott’s and our setting, measures of sentence complexity were more effective in prediction within the context of a specific domain. This may also suggest the benefit of including our sentence context features as they could reinforce domain information while also providing some information about sentence complexity and vocabulary use.
It is worth noting that, as part of the nature of all universal encoder models, the generated embedding is less interpretable by people even though it provides an effective representation of the text for predicting comprehension performance. This means more effort is required to evaluate how much specific features of the text affect the prediction task. Given the enhanced performance that is associated with the use of these embeddings, this effort is warranted when developing models for supporting the adaptive selection of texts and questions in an educational technology.
Conclusion
Student performance on reading comprehension tasks is often predicted using assessments of oral language skills, such as vocabulary knowledge or syntactic awareness. We extend this work by capturing features of text, which are rarely used in the prediction process despite an understanding that the characteristics of a text influence the ability to understand that text. In the present paper, we report on data from grade 3 students to develop and test our prediction model. We test automated methods for extracting and incorporating text-based features from the content of a reading test to help predict whether a student will answer a reading comprehension question correctly.
The extracted text-based features were selected based on theories or evidence supporting their relationship with reading comprehension. Thus, they were designed to provide information about some of the aspects of a text that are expected to interact with children’s oral language skills. Specifically, the selected features represent sentence complexity, vocabulary frequency, lexical surprisal, and context. They were all extracted using natural language processing techniques that include n-grams, a probabilistic context-free grammar, and a universal sentence encoder.
We used these features as inputs to neural networks that can self-update when given more student data or new texts are added. This mitigates the disadvantage where models with no texted-based features have to be retrained fully every time a test is updated. Our model is also expected to better handle diversity across reading comprehension tests and student reading skill levels because it relies on general features of a text rather than solely relying on historical records of student performance. Since our model has clear separation between different categories of features at the input layer, new features and new data can be easily added which offers a starting point to identify what additional training might help improve student reading skills. To support the continued study of the role that text features play in reading comprehension, we have shared our approach to interpreting and analyzing the model (in section 5.4 and through GitHub[2]). This sharing will allow others to apply this approach to another test or population of learners.
To summarize, we extracted and tested text-based features at the word and sentence level to examine their impact on the reading comprehension of children. Those features were used as input to a model that predicts student performance on reading comprehension tests at the question level. Analyses of the tested models show that one of the employed text-based features (e.g., sentence context) improved model performance on its own while others did not (e.g., sentence complexity and lexical surprisal). The joint use of the text-based features resulted in a more than 4 % gain. Subsequent error analysis suggests each of these text-based features represents an important characteristic of the text, with their combined use resulting in the best performing model. Exploration of how these text-based features contributed to model performance provided insight into the complex relationships between text features and children’s reading comprehension performance. Thus, the models and their analysis can support the design of better learning systems, the selection of appropriate reading materials, and increased understanding of the multi-faceted nature of student reading comprehension.
ACKNOWLEDGMENTS
This work is supported in part by funding from the Social Sciences and Humanities Research Council of Canada and the Natural Sciences and Engineering Research Council of Canada (NSERC), [RGPIN/293300-2013], Canadian Institute for Advanced Research (CIFAR), and Alberta Machine Intelligence Institute (Amii).
References
- Allen, L.K., Snow, E.L. and McNamara, D.S. 2015. Are you reading my mind?: modeling students’ reading comprehension skills with natural language processing techniques. Proceedings of the Fifth International Conference on Learning Analytics And Knowledge (Poughkeepsie New York, Mar. 2015), 246–254.
- Beck, J. and Sison, J. 2006. Using Knowledge Tracing in a Noisy Environment to Measure Student Reading Proficiencies. I. J. Artificial Intelligence in Education. 16, (Jan. 2006), 129–143.
- Beck, J.E., Jia, P. and Mostow, J. 2003. Assessing Student Proficiency in a Reading Tutor That Listens. User Modeling 2003. P. Brusilovsky, A. Corbett, and F. de Rosis, eds. Springer Berlin Heidelberg. 323–327.
- Borkin, D., Némethová, A., Michaľčonok, G. and Maiorov, K. 2019. Impact of Data Normalization on Classification Model Accuracy. Research Papers Faculty of Materials Science and Technology Slovak University of Technology. 27, 45 (Sep. 2019), 79–84. DOI:https://doi.org/10.2478/rput-2019-0029.
- Cain, K. 2007. Syntactic awareness and reading ability: Is there any evidence for a special relationship? Applied Psycholinguistics. 28, 4 (Oct. 2007), 679–694. DOI:https://doi.org/10.1017/S0142716407070361.
- Cer, D., Yang, Y., Kong, S., Hua, N., Limtiaco, N., John, R.S., Constant, N., Guajardo-Cespedes, M., Yuan, S., Tar, C., Sung, Y.-H., Strope, B. and Kurzweil, R. 2018. Universal Sentence Encoder. arXiv:1803.11175 [cs]. (Apr. 2018). http://arxiv.org/abs/1803.11175
- Colenutt, A., Toye, M.A. and College, F. 2012. Critical Crossroads: Youth, Criminal Justice and Literacy : Literature Review : Transformative Literacy for Youth in Conflict with the Law. Frontier College.
- Corlatescu, D.-G., Dascalu, M. and McNamara, D.S. 2021. Automated Model of Comprehension V2.0. Artificial Intelligence in Education. I. Roll, D. McNamara, S. Sosnovsky, R. Luckin, and V. Dimitrova, eds. Springer International Publishing. 119–123.
- Davies, M. 2008. The Corpus of Contemporary American English.
- Deacon, S.H., Benere, J. and Castles, A. 2012. Chicken or egg? Untangling the relationship between orthographic processing skill and reading accuracy. Cognition. 122, 1 (Jan. 2012), 110–117. DOI:https://doi.org/10.1016/j.cognition.2011.09.003.
- Deacon, S.H. and Kieffer, M. 2018. Understanding how syntactic awareness contributes to reading comprehension: Evidence from mediation and longitudinal models. Journal of Educational Psychology. 110, 1 (Jan. 2018), 72–86. DOI:https://doi.org/10.1037/edu0000198.
- Demmans Epp, C. 2019. Developing an Adaptive Mobile Tool to Scaffold the Communication and Vocabulary Acquisition of Language Learners. Handbook of Mobile Teaching and Learning. Y. Zhang and D. Cristol, eds. Springer Berlin Heidelberg. 1–26.
- Demmans Epp, C. and McCalla, G. 2011. ProTutor: Historic Open Learner Models for Pronunciation Tutoring. Artificial Intelligence in Education. G. Biswas, S. Bull, J. Kay, and A. Mitrovic, eds. Springer Berlin Heidelberg. 441–443.
- Demmans Epp, C. and Phirangee, K. 2019. Exploring mobile tool integration: Design activities carefully or students may not learn. Contemporary Educational Psychology. 59, (Oct. 2019), 101791. DOI:https://doi.org/10.1016/j.cedpsych.2019.101791.
- Devlin, J., Chang, M.-W., Lee, K. and Toutanova, K. 2019. BERT: Pre-training of Deep Bidirectional Transformers for Language Understanding. Proceedings of the 2019 Conference of the North American Chapter of the Association for Computational Linguistics: Human Language Technologies, NAACL-HLT 2019, Minneapolis, MN, USA, June 2-7, 2019, Volume 1 (Long and Short Papers) (2019), 4171–4186.
- Duong, M., Mostow, J. and Sitaram, S. 2011. Two methods for assessing oral reading prosody. ACM Transactions on Speech and Language Processing. 7, 4 (Aug. 2011), 1–22. DOI:https://doi.org/10.1145/1998384.1998388.
- Fang, Y., Li, T., Roscoe, R.D. and McNamara, D.S. 2021. Predicting Literacy Skills via Stealth Assessment in a Simple Vocabulary Game. Adaptive Instructional Systems. Adaptation Strategies and Methods. R.A. Sottilare and J. Schwarz, eds. Springer International Publishing. 32–44.
- Frank, S. and Hoeks, J.C.J. 2019. The interaction between structure and meaning in sentence comprehension: Recurrent neural networks and reading times. CogSci (2019).
- Gough, P.B. and Tunmer, W.E. 1986. Decoding, Reading, and Reading Disability. Remedial and Special Education. 7, 1 (Jan. 1986), 6–10. DOI:https://doi.org/10.1177/074193258600700104.
- Graesser, A.C. 2006. Question Understanding Aid (QUAID): A Web Facility that Tests Question Comprehensibility. Public Opinion Quarterly. 70, 1 (Mar. 2006), 3–22. DOI:https://doi.org/10.1093/poq/nfj012.
- Graesser, A.C., Greenberg, D., Frijters, J.C. and Talwar, A. 2021. Using AutoTutor to Track Performance and Engagement in a Reading Comprehension Intervention for Adult Literacy Students. Revista signos. 54, 107 (Dec. 2021), 1089–1114. DOI:https://doi.org/10.4067/S0718-09342021000301089.
- Graesser, A.C., McNamara, D.S. and Kulikowich, J.M. 2011. Coh-Metrix: Providing Multilevel Analyses of Text Characteristics. Educational Researcher. 40, 5 (Jun. 2011), 223–234. DOI:https://doi.org/10.3102/0013189X11413260.
- Graesser, A.C., McNamara, D.S. and Louwerse, M.M. 2003. What do readers need to learn in order to process coherence relations in narrative and expository text. Rethinking reading comprehension. Guilford Press. 82–98.
- Guo, W., Cho, B.-Y. and Wang, J. 2020. StrategicReading: Understanding Complex Mobile Reading Strategies via Implicit Behavior Sensing. Proceedings of the 2020 International Conference on Multimodal Interaction (Virtual Event Netherlands, Oct. 2020), 491–500.
- Hale, J. 2001. A probabilistic earley parser as a psycholinguistic model. Second meeting of the North American Chapter of the Association for Computational Linguistics on Language technologies 2001 - NAACL ’01 (Pittsburgh, Pennsylvania, 2001), 1–8.
- Hale, J., Dyer, C., Kuncoro, A. and Brennan, J. 2018. Finding syntax in human encephalography with beam search. Proceedings of the 56th Annual Meeting of the Association for Computational Linguistics (Volume 1: Long Papers) (Melbourne, Australia, 2018), 2727–2736.
- Hill, F., Bordes, A., Chopra, S. and Weston, J. 2016. The Goldilocks Principle: Reading Children’s Books with Explicit Memory Representations. ICLR (2016).
- Hirsch, E.D. 2003. Reading comprehension requires knowledge of words and the world. American educator. 27, 1 (2003), 10–13.
- Hofmann, M.J., Remus, S., Biemann, C., Radach, R. and Kuchinke, L. 2022. Language Models Explain Word Reading Times Better Than Empirical Predictability. Frontiers in Artificial Intelligence. 4, (Feb. 2022). DOI:https://doi.org/10.3389/frai.2021.730570.
- Kamil, M.L. 2003. Adolescents and literacy: Reading for the 21st century. Alliance for Excellent Education.
- Karita, S., Chen, N., Hayashi, T., Hori, T., Inaguma, H., Jiang, Z., Someki, M., Soplin, N.E.Y., Yamamoto, R., Wang, X., Watanabe, S., Yoshimura, T. and Zhang, W. 2019. A Comparative Study on Transformer vs RNN in Speech Applications. 2019 IEEE Automatic Speech Recognition and Understanding Workshop (ASRU) (SG, Singapore, Dec. 2019), 449–456.
- Kingma, D.P. and Ba, J. 2015. Adam: A Method for Stochastic Optimization. 3rd International Conference on Learning Representations, ICLR 2015, San Diego, CA, USA, May 7-9, 2015, Conference Track Proceedings (2015).
- Levy, R. 2008. Expectation-based syntactic comprehension. Cognition. 106, 3 (Mar. 2008), 1126–1177. DOI:https://doi.org/10.1016/j.cognition.2007.05.006.
- MacGinitie, W.H., MacGinitie, R.K., Maria, K. and Dreyer, L.G. 2000. Gates-MacGinitie Reading Tests (4th ed.). Riverside Publishing.
- Mao, Y., Lin, C. and Chi, M. 2018. Deep Learning vs. Bayesian Knowledge Tracing: Student Models for Interventions. (Oct. 2018). DOI:https://doi.org/10.5281/ZENODO.3554691.
- McKinlay, A. 2011. Peabody Picture Vocabulary Test –Third Edition (PPVT-III). Encyclopedia of Child Behavior and Development. S. Goldstein and J.A. Naglieri, eds. Springer US. 1072–1072.
- McNemar, Q. 1947. Note on the sampling error of the difference between correlated proportions or percentages. Psychometrika. 12, 2 (Jun. 1947), 153–157. DOI:https://doi.org/10.1007/BF02295996.
- Mishev, K., Gjorgjevikj, A., Vodenska, I., Chitkushev, L.T. and Trajanov, D. 2020. Evaluation of Sentiment Analysis in Finance: From Lexicons to Transformers. IEEE Access. 8, (2020), 131662–131682. DOI:https://doi.org/10.1109/ACCESS.2020.3009626.
- Mitchell, J., Lapata, M., Demberg, V. and Keller, F. 2010. Syntactic and Semantic Factors in Processing Difficulty: An Integrated Measure. Proceedings of the 48th Annual Meeting of the Association for Computational Linguistics. Association for Computational Linguistics. 196–206.
- Nagamani, M., Narendra Prasad, M. and Girija, P.N. 2005. Improving reading and writing skills with INtelligent Tutor for TElugu Language Learning INTTELL. Proceedings of 2005 International Conference on Intelligent Sensing and Information Processing, 2005. (Chennai, India, 2005), 426–429b.
- Panda, S.K., Nag, S. and Jana, P.K. 2014. A smoothing based task scheduling algorithm for heterogeneous multi-cloud environment. 2014 International Conference on Parallel, Distributed and Grid Computing (Solan, India, Dec. 2014), 62–67.
- Patro, S.G.K. and Sahu, K.K. 2015. Normalization: A Preprocessing Stage. arXiv:1503.06462 [cs]. (Mar. 2015). http://arxiv.org/abs/1503.06462
- Pearson, P.D., Hiebert, E.H. and Kamil, M.L. 2007. Vocabulary assessment: What we know and what we need to learn. Reading Research Quarterly. 42, 2 (Apr. 2007), 282–296. DOI:https://doi.org/10.1598/RRQ.42.2.4.
- Perfetti, C. 2007. Reading Ability: Lexical Quality to Comprehension. Scientific Studies of Reading. 11, 4 (Sep. 2007), 357–383. DOI:https://doi.org/10.1080/10888430701530730.
- Perin, D. and Lauterbach, M. 2018. Assessing Text-Based Writing of Low-Skilled College Students. International Journal of Artificial Intelligence in Education. 28, 1 (Mar. 2018), 56–78. DOI:https://doi.org/10.1007/s40593-016-0122-z.
- Roark, B., Bachrach, A., Cardenas, C. and Pallier, C. 2009. Deriving lexical and syntactic expectation-based measures for psycholinguistic modeling via incremental top-down parsing. Proceedings of the 2009 Conference on Empirical Methods in Natural Language Processing Volume 1 - EMNLP ’09 (Singapore, 2009), 324.
- Scott, C.M. 2009. A Case for the Sentence in Reading Comprehension. Language, Speech, and Hearing Services in Schools. 40, 2 (Apr. 2009), 184–191. DOI:https://doi.org/10.1044/0161-1461(2008/08-0042).
- Silva, M. and Cain, K. 2015. The relations between lower and higher level comprehension skills and their role in prediction of early reading comprehension. Journal of Educational Psychology. 107, 2 (2015), 321–331. DOI:https://doi.org/10.1037/a0037769.
- Song, K., Tan, X., Qin, T., Lu, J. and Liu, T.-Y. 2020. MPNet: Masked and Permuted Pre-training for Language Understanding. Advances in Neural Information Processing Systems (2020), 16857–16867.
- Sundararajan, M., Taly, A. and Yan, Q. 2017. Axiomatic Attribution for Deep Networks. Proceedings of the 34th International Conference on Machine Learning (Aug. 2017), 3319–3328.
- Torgesen, J.K., Rashotte, C.A. and Wagner, R.K. 1999. TOWRE: Test of word reading efficiency. Pro-ed Austin, TX.
- Toutanova, K., Klein, D., Manning, C.D. and Singer, Y. 2003. Feature-rich part-of-speech tagging with a cyclic dependency network. Proceedings of the 2003 Conference of the North American Chapter of the Association for Computational Linguistics on Human Language Technology - NAACL ’03 (Edmonton, Canada, 2003), 173–180.
- Vaswani, A., Shazeer, N., Parmar, N., Uszkoreit, J., Jones, L., Gomez, A.N., Kaiser, Ł. and Polosukhin, I. 2017. Attention is All you Need. Advances in Neural Information Processing Systems (2017).
- Verhoeven, L. and van Leeuwe, J. 2008. Prediction of the development of reading comprehension: a longitudinal study. Applied Cognitive Psychology. 22, 3 (Apr. 2008), 407–423. DOI:https://doi.org/10.1002/acp.1414.
- Wagner, R.K., Torgesen, J.K., Rashotte, C.A. and Pearson, N.A. 1999. Comprehensive test of phonological processing: CTOPP. Pro-ed Austin, TX.
- Wechsler, D. 2003. Wechsler Intelligence Scale for Children (4th ed.). Pearson.
- Wijekumar, K., Graham, S., Harris, K.R., Lei, P.-W., Barkel, A., Aitken, A., Ray, A. and Houston, J. 2019. The roles of writing knowledge, motivation, strategic behaviors, and skills in predicting elementary students’ persuasive writing from source material. Reading and Writing. 32, 6 (Jun. 2019), 1431–1457. DOI:https://doi.org/10.1007/s11145-018-9836-7.
- Woodcock Reading Mastery Tests (Rev. ed.): 1987. .
The test content is available at https://edinstruments.com/instruments/gates-macginitie-reading-tests-4th-edition-gmrt-4 ↑
https://github.com/EdTeKLA/ComprehensionScorePredictor ↑
© 2022 Copyright is held by the author(s). This work is distributed under the Creative Commons Attribution-NonCommercial-NoDerivatives 4.0 International (CC BY-NC-ND 4.0) license.