ABSTRACT
What can eye movements reveal about reading, a complex skill ubiquitous in everyday life? Research suggests that gaze can measure short-term comprehension for facts, but it is unknown whether it can measure long-term, deep comprehension. We tracked gaze while 147 participants read long, connected, informative texts and completed assessments of rote (factual) and inference (connecting ideas) comprehension while reading a text, after reading a text, after reading five texts, and after a seven-day delay. Gaze-based student-independent computational models predicted both immediate and long-term rote and inference comprehension with moderate accuracies. Surprisingly, the models were most accurate for comprehension assessed after reading all texts and predicted comprehension even after a week-long delay. This shows that eye movements can provide a lens into the cognitive processes underlying reading comprehension, including inference formation, and the consolidation of information into long-term memory, which has implications for intelligent student interfaces that can automatically detect and repair comprehension in real-time.
Keywords
INTRODUCTION
Reading comprehension is the extraction of meaning from text. This activity takes place many times a day, whether reading the news, absorbing technical information at school or work, or reading a novel for pleasure. Difficulty in reading comprehension can slow the progression of such activities, and comprehension failures can lead to misunderstandings and inaccuracies. The rise of computerized reading via e-books, the Internet, and other media opens up the exciting possibility of intelligent interfaces that can track reading comprehension as it unfolds based on measurable signals (behaviors) from the reader [13, 51].
Eye-gaze is perhaps one attractive signal to explore because it provides a lens into cognitive processes [30, 48] and it can be passively and noninvasively recorded. In particular, there is a long history of using eye gaze in student-models of cognitive, affective, and social processes during learning [8, 15, 61]. In the context of reading comprehension researchers have developed automatic models for skimming [3] and mind wandering (zone outs) [19] detection. These models have also been used for real-time intervention. For example, Mills et al. [41] designed an attention-aware reading intervention that prompted participants to re-read sections of text based on a real-time gaze-based model of mind wandering [19] and found this to improve reading comprehension. In addition, real-time modifications can be made to text content, such as adapting the text to be easier when comprehension difficulty is detected [53], or enabling gaze-contingent actions such as presenting a glossary for technical terms [3].
Whereas these examples focus on adapting the reading interface based on ongoing comprehension processes, such as mind wandering or comprehension difficulty, another possibility is to base adaptations on comprehension outcomes. For example, if gaze can be used to prospectively predict whether a student will comprehend a page or an entire text, adaptive interventions can be designed to address such deficits at their onset. Such a system would entail developing a model to monitor comprehension outcomes from gaze as a first step, a possibility we explore here. Specifically, we examine whether machine-learned models of gaze can be used to predict different types of comprehension outcomes (factual vs. those entailing inferencing) assessed at different time intervals (during a text, after a text, after multiple texts, and greater than a week). In addition to potential applications, the present research advances the empirical knowledge base of eye movements in reading comprehension, and to our best knowledge, is the first such study.
Background and Related Work
Reading Comprehension
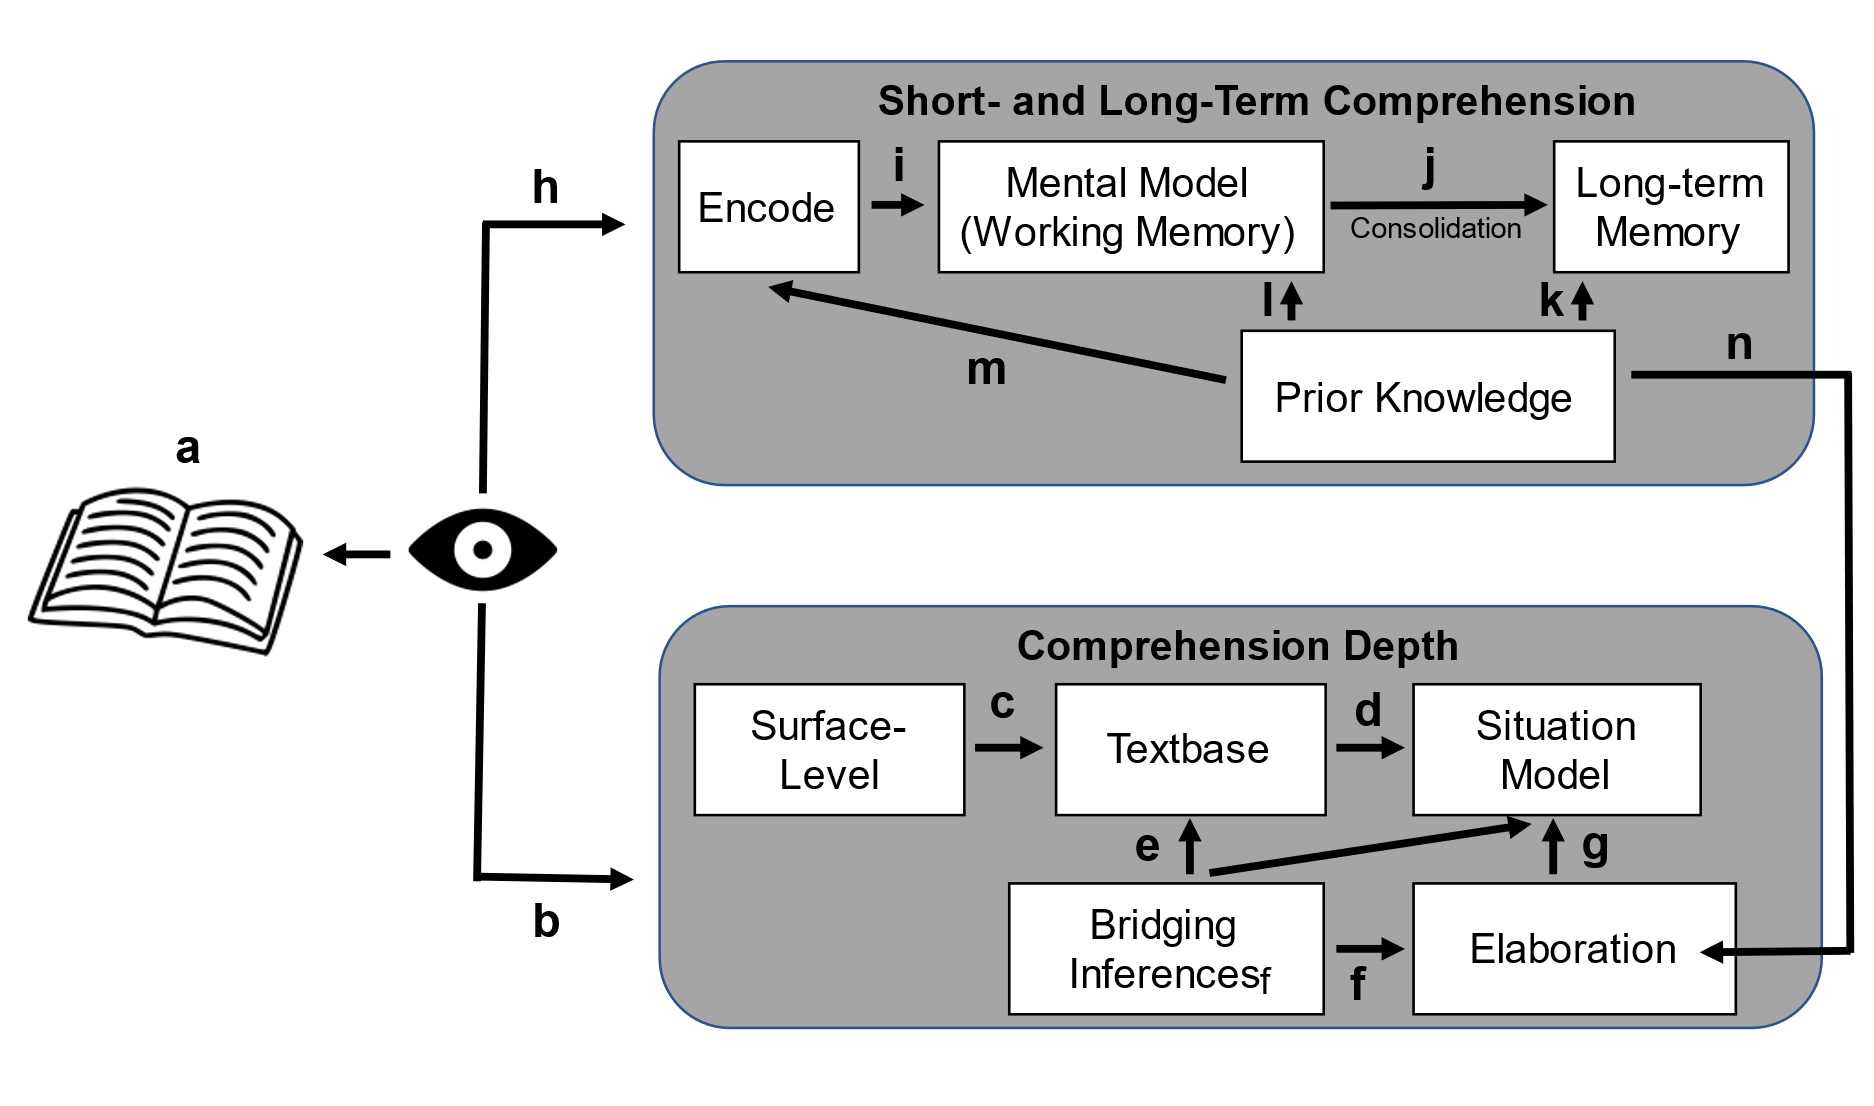
Most theories of reading posit that it involves hierarchically interacting levels of processing - from the sub-lexical and lexical levels [25] and from the access of word-level meaning [45] to the formation of a literal then a more abstract meaning-based encoding of the text at the sentence-level (Figure 1 links a-c; [59]). Higher-order (or deeper) processing incorporates elaborative inferences from prior knowledge (Figure 1 n) [32] and integration across multiple sections within the text and even between texts (bridging inferences), forming a situation (or mental) model (Figure 1 d-g) [39] [24]. These above shallow and deep processes unfold in parallel [33] and interact with one another to provide a cohesive narrative of text. Both are critical in that shallow, perceptual encoding of information is important to construct the mental representations to support inferences from the text, and inferences are important to bridge ideas in the text into a cohesive narrative (Figure 1d; [34]). It is therefore critical to develop models of comprehension that account for multiple levels of comprehension, which we address by focusing on varying depths of comprehension, such as rote (knowledge of factual content from text) and inference (deep) comprehension (for examples, see Table 2).
Comprehension also unfolds over timescales of milliseconds, seconds, minutes, hours, and beyond. For instance, reprocessing of remembered information can occur in milliseconds without re-fixating the part of the text that was not correctly encoded initially [6, 40], whereas comprehension of earlier sentences affects encoding of later content and vice versa (e.g., via bridging inferences [34]), a process that may unfold over seconds or even minutes. Further, memory traces acquired during reading one text may interfere with another [63] prior to being consolidated into long-term memory during sleep [43]. Thus, it is unclear if eye movements captured during the initial encoding of text (b & h in Figure 1) will be useful to predict comprehension at later stages after these intervening processes have unfolded (Figure 1 i-m). We address this by investigating the link between gaze and comprehension assessed at multiple time points.
Eye Movements During Reading
Theories of gaze control during reading shed light on the mechanisms linking cognitive processes and measurable gaze features [18, 50], particularly for lower-level lexical processes. For example, eye movements are determined to some extent by text properties, where fixations are shorter on more frequent [47] and shorter words [49]. But eye movements are also influenced by higher-level comprehension [5], for example the same word may be fixated for longer if it is contextually surprising versus expected [38] or regressive eye movements can reconcile disparities in comprehension [9], such as in the case of ambiguous sentences [23] (but this can also occur covertly without a regression [7]).
Gaze has also been linked to several processes that support comprehension. In particular, attentional lapses (mind wandering) which are negatively associated with comprehension [14, 54] have been linked with fewer and longer fixations (see brief review by Faber et al. [20]). Similarly, skim reading manifests as fewer fixations [37] and fewer regressive saccades [42], but in contrast to mind wandering, these fixations are shorter than for normal reading [56].
Researchers have leveraged these findings to develop gaze-basedmodels of reading comprehension as noted in Table 1. Whereas there have been attempts to model comprehension from other signals, such as facial expressions [58], we focus on gaze here. In general, most studies compute gaze statistics aggregated over time to give “global” measures at the level of an entire page, passage, or participant for use as features in shallow machine learning classifiers (e.g., Random Forest). For example, D’Mello et al. [16] used linear regression models to predict responses to multiple choice questions targeting rote (factual) information of the text interspersed during reading based on a small number of global gaze features grounded in the experimental literature. Similarly, Copeland and colleagues trained shallow neural networks to predict comprehension scores from gaze [10–12].
Deep neural networks are capable of modeling gaze behavior [35, 62], so it is plausible that an end-to-end system could be designed to predict comprehension. To this point, Ahn et al. [1] used convolutional neural networks (CNN) and long short-term memory (LSTM) models to model several reading comprehension metrics (passage- and subject-level comprehension, perceived difficulty, English language skill) from raw fixation-level data (location, duration, and pupil diameter) but their model performance was scarcely above chance and the results did not generalize to new readers.
To this point, a vast majority of studies do not provide evidence of generalizability to new people where data from the same participants are in either the training or test set (but not both). Further, as evident in Table 1, almost all studies focus on rote or factual comprehension or a combination of the two, which makes it difficult to compare the performance of gaze-based models for either type; comprehension is almost always assessed during reading or immediately after, but never after a longer delay when interference and memory consolidation processes unfold.
Study | Comprehension Type | Assessment Time | Participant-level Generalization | Small, predetermined feature set |
|---|---|---|---|---|
Copeland & Gedeon, 2013 | Rote | During reading | No | Yes |
Copeland et al., 2014 | Rote | Immediately after reading | No | Yes |
Martínez-Gómez & Aizawa, 2014 | Rote | Immediately after each text/section | Yes | Yes |
Wallot et al., 2015 | Rote | Immediately after reading | No | Yes |
Copeland et al., 2016 | Rote | Immediately after each text/section | No | Yes |
Ahn et al., 2020 | Rote and inference | Immediately after each passage | No | NA |
D’Mello et al., 2020 | Rote | During reading | Yes | Yes |
Southwell et al., 2020 | Rote (2 studies) and inference (1 study) | Roughly 30 minutes after reading | Yes | Yes |
Current Study: Contribution & Novelty
As reviewed above, there is reason to suggest that gaze can provide an important signal to automatically measure comprehension during reading. However, despite some initial attempts towards this goal (Table 1), substantial items remain including: (1) differentiating the predictive value of gaze on different depths of comprehension; and (2) different time onsets from the initial reading of the text (where gaze is acquired) and when comprehension is assessed; (3) developing models that generalize to new students, and (4) testing whether deep sequence learning models can improve comprehension prediction above standard classifiers.
We addressed these issues by testing whether gaze could be used to predict rote and inference comprehension (#1 above) assessed at four time points (during reading, after each text, after all texts, and at least seven days following reading; #2), using a large dataset of eye movements recorded as 147 participants read five long expository texts. Random forest models were used to evaluate whether a broad set of page-level gaze features (109 features total) could be used to detect reading comprehension on each page across depth and time by comparing them to two baseline models. We also tested a long-short-term memory (LSTM) deep neural network to examine whether temporal sequences of fixations could improve predictive accuracy (#4). Critically, participant-level cross-validation was used to increase the likelihood that the model would generalize to new participants (#3).
It should be noted that the present goal is more scientific in nature – to investigate the relationship with eye tracking and reading comprehension outcomes – rather than application oriented. As such, although we used a machine-learning predictive modeling approach [17], the goal was to use the models to investigate the previously explored question of the link between gaze and comprehension depth and durability (persistence across time) rather than to engineer the most predictive model. For this reason, we largely restricted the feature space to high-level eye gaze features and some contextual variables but did not include information on textual content and difficulty of the assessment items.
Method
Data Collection
Data was collected as part of a larger study investigating neurophysiology during reading comprehension. Only aspects germane to the present study are presented here. The data analyzed here have not been previously published.
Participants (N=147, age 23±6 years, 67% female, 1% other) were students from a large public University in the Western US. Participants were paid $20 per hour plus $10 for a follow-up survey via Amazon gift cards. All procedures were approved by the institution’s internal review board and all participants provided informed consent.
Binocular gaze was tracked using a high-resolution desktop-mounted eye tracker (SR Research EyeLink 1000+) with a sampling rate of 1000Hz. Stimuli were displayed on a 23.8”, 1920x1080 pixel display, and participants viewed the screen at a distance of ~90cm. A chin rest was used to minimize movement during the study.
Participants read five expository texts of around 1000 words each, where a single text was split into 10 pages. Each text was on the topic of behavioral research methods: Bias, Hypothesis, Casual Claims, Validity, and Variables. The texts had a mean Flesch-Kincaid grade level (a measure of textual difficulty) of 13.2 indicating an advanced reading level [22], but suitable for college students. Reading was self-paced in that participants pressed a key to advance to the next page but could not advance back to a previous page. On average, participants spent 5.5 minutes (1.8 SD) reading each text, for a total average reading time of 27.6 minutes (9.2 SD).
Reading comprehension was assessed via: 1) Rote items - four-alternative forced-choice item targeting factual knowledge explicitly presented in the text); 2) Inference items - a statement which is either a valid or false inference from the text, which the participant identified as ‘true’ or ‘false’ (see Table 2 for examples). Rote and inference questions were developed by researchers led by an instructor of a behavioral research methods undergraduate course. They were then piloted and refined using Mechanical Turk in order to calibrate the difficulty to the appropriate level. Items with less than 20% accuracy or greater than 80% accuracy were reexamined and either discarded or adapted based on patterns of responses. The final assessments and texts included in the study were tested on 10 unique participants per text.
Text | Question |
|---|---|
“Occam’s razor, also called the principle of parsimony, teaches that hypotheses introduced to explain relationships should be as parsimonious as possible. We ‘cut away’ what is superfluous.” | (Rote Question) What is Occam’s Razor? A) The process by which we search for the simplest explanation for an observation (correct); |
Sentence S3: Internal validity refers to whether the relationship between the variables is free of confounds .…… | (Inference Question) True or False: Internal validity is not a prerequisite for content validity. False (correct response because for a test to separately measure all facets of a construct (S5) it must be able to identify relationships free of confounds (S3)). |
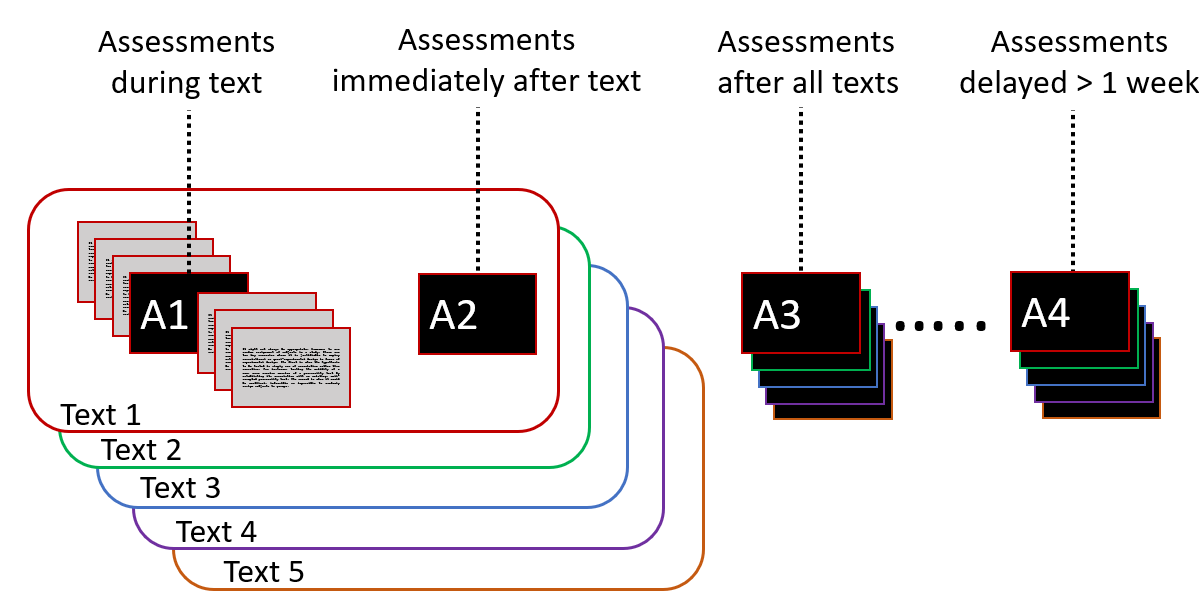
Both assessment items occurred at four time points: (A1) “during text” occurred immediately after reading the corresponding page, (A2) “after each” occurred after each individual text was completed; (A3) “after all” occurred once all five texts were read; and (A4) "delay” occurred a minimum of seven days after the reading session (Figure 2; median completion time 8.0 days, mean completion time 11.27 days after reading). The assessment items were linked to content covered in a particular page of the text so that gaze on that page could be associated with a corresponding item (Figure 2). At each time point, each participant received assessments corresponding to a randomized subset of two pages for each text from a pool of questions common to the A1, A2 and A3 assessments (Figure 2) but without overlap (e.g., if a page was selected for A1, then it could not be used for A2 and A3). A4 assessments were selected from a different pool of questions than A1-A3.
Data Processing and Feature Extraction
Gaze data was processed with EyeLink’s event detection algorithm, using a velocity threshold of 30°/s and an acceleration threshold of 9500°/s2. The right eye was used in the analyses if available, otherwise the left eye was used. No manual alignment of eye movements was done to address eye tracking errors as this would not be possible in a real-time application. Further, a pilot study comparing features (see Table 3) extracted from aligned vs. unaligned tested on the A1 (‘during text’) assessments yielded highly similar results.
Fixations and saccades greater than the 99th percentile across participants were removed to account for mis-parsed fixations and saccades (i.e., saccade amplitudes greater than 20°, durations above 600 ms, peak velocity below 5°/s or above 800°/s, distances over 1000 pixels, and fixation durations below 40 ms and above 3000 ms). The first and last fixations on a page were removed as these likely corresponded to orienting rather than reading behaviors.
Feature | Description |
|---|---|
Fixation Duration | Duration of a fixation in milliseconds |
Fixation Count | Number of fixations on a page |
Saccade Amplitude | Degrees of visual angle the eye travels during a saccade |
Saccade Velocity | Saccade amplitude divided by saccade duration |
Saccade Distance | Euclidian distance between saccade start and end points |
Saccade Duration | Duration in milliseconds of a saccade |
Saccade Relative Angle | Acute angle between the line segments of two saccades |
Horizontal Saccade Angle | Angle between a saccade and the horizontal axis |
Pupil Diameter (Z) | Diameter of the pupil, z-scored within-participant |
Fixation Dispersion | Root mean square from each fixation to the mean fixation position on a page |
Horizontal Saccade Prop. | The proportion of saccades no greater than 30 degrees above or below the horizontal axis to the right or left |
Forward Horizontal Saccade Prop. | Proportion of saccades no greater than 30 degrees above or below the horizontal axis only to the right |
Blink Count | Number of blinks on a given page |
Blink Duration | Duration in milliseconds of a blink |
Dwell Time | The sum of the durations across all fixations that fell in a given interest area. Reflects the amount of time spent fixating on the words |
IA Fixation Prop. | The total proportion of fixations that landed in a given interest area (e.g., 2 for “following” #12 in Figure 3, 2/13 for the proportion) |
Regression-In Prop. | The proportion of times an interest area was entered at the beginning of a regression. (e.g.,1 for #3 “start” in Figure 3, and 1/13 for the proportion) |
Regression-Out Full Prop. | The proportion of times an interest area was regressed from (e.g., 2 for “experiment” #13 in Figure 3, and 2/3 for the proportion) |
First Pass Regression-Out Prop. | The proportion of times an interest area was regressed from on the first pass (before having read any text past that interest area). (e.g., 1 for “experiment” #13 in Figure 3, and 1/13 for the proportion) |
Regression Path Duration | The total time from when an interest area is fixated until it is exited to the right (also called go-past duration). This includes all the time spent regressing until that interest area is passed. (e.g., the sum of the first fixation on “experiment” #13 in addition to the sum of the 3 subsequent regressive fixations, and the last fixation on that same word in Figure 3). |
Selective Regression Path Duration | Total gaze duration (duration of fixations and refixations) on an interest area before leaving the interest area to the right (e.g., 2 for the word “following” and the word “experiment” #13 in Figure 3). |
Bold indicates statistical functions (including min, max, mean, median, sum, skew, kurtosis, and standard deviation) were computed from these features at the page level. The word “proportion” indicates these features were normalized by the total number of fixations on the given page. Prop. = Proportion
Gaze Features
Global (content-independent) gaze features (Table 3) were calculated as statistical functions over low-level features at the page-level and have been previously used to predict comprehension and mind wandering [4, 19, 55]. A second set of features captured the fixations corresponding to interest areas, which were rectangular boxes around individual words and punctuation computed with EyeLink Dataviewer (see example in Figure 3). The gaze models consisted of these 109 features plus three context features (see below). One goal of these features is to find participant-general patterns in gaze and comprehension, so to account for the variation in individual differences in fixation rates [26, 60], we normalized interest area features by the total number of fixations on a given page.
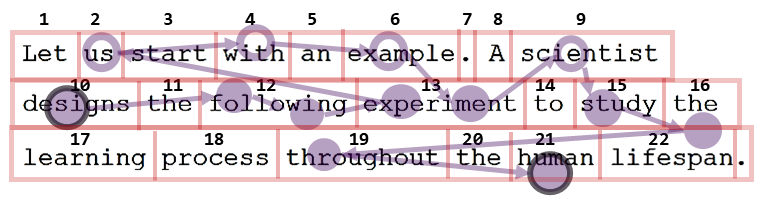
Table 4 includes summary statistics for a few key gaze features, which are consistent with what is typically observed during reading [46, 48]. The mean fixation duration was 210.30 ms, well in range of the 200-250 ms average during reading, and the mean saccade duration of 42.04 ms is approximately the average saccade duration of 50 ms during reading [46]. Further, the average saccade amplitude in the study was 3.46 degrees, whereas the average during reading is reported to be 2 degrees [48]. This study does differ slightly in regressive fixations, as it is estimated that 10-15% of saccades are regressive during reading [46], where this study had 34%. There was also a slightly higher horizontal saccade proportional (95%) than previous studies (e.g., 85% in D’Mello et al. [16]).
Feature | M (SD) |
|---|---|
Mean Saccade Amplitude | 3.46 (0.45) |
Total Scan Path Length | 422.68 (105.61) |
Fixation Dispersion | 0.41 (0.03) |
Mean Fixation Duration | 210.84 (25.20) |
Mean Saccade Duration | 42.04 (8.94) |
Horizontal Saccade Proportion | 0.95 (0.03) |
Mean Pupil Size (z) | 0.11 (0.30) |
Regression Fixation Proportion | 0.34 (0.09) |
IA Percent Visited | 0.56 (0.08) |
Proportion of Fixations in IAs | 0.91 (0.06) |
Mean IA Regression Path Duration | 984.57 (450.88) |
Mean Blink Duration | 189.91 (229.87) |
Baseline Models: Context Features, Shuffled Labels and Shuffled Fixation Events
Context features capture situational factors independent of gaze and were used as a baseline measure to gauge the added value of gaze features. They included reading rate (reading time divided by the number of characters on a page), text order, and the eye tracker calibration error. For a second baseline, we fit gaze models where comprehension scores were shuffled within each participant, preserving the distribution of the features, but breaking the temporal dependency between gaze and the comprehension. Additionally, the LSTM baseline models shuffled the units in the sequence, preserving the distribution of the features, but breaking the temporal dependency between fixation events.
Machine Learning Models
We chose Random Forest classifiers since they incorporate nonlinearity and interactivity among features and have good generalization properties. The random forest classifier was implemented in sklearn, with 100 estimators, minimum of 15 samples per leaf, and the maximum number of features set to the square root of the total number of features. The class weights of the models were balanced by setting the weights to be inversely proportional to the number of samples in each class. Note that no resampling was done on either the training or testing sets: setting the class weights to ‘balanced’ simply penalizes wrong predictions made on the minority class.
We also trained LSTM (implemented in Keras) models to examine to what extent the sequence of local fixation events can be used to predict reading comprehension. Each unit in the sequences represents a fixation event, which was described by five features: 1) fixation duration, 2) average horizontal (x) position, 3) average vertical (y) position, 4) average pupil size, and 5) the elapsed time since the end of last fixation. We also explored using other features, such as the position of the previous and next fixation, the distance between the current and previous fixation, but this did not improve model performance. The maximum sequence length was set to 160 units, which is longer than 85% of the sequences. For those shorter than 160 units, 0s were filled at the beginning and for the longer ones, the last 160 units were kept. The LSTM network included a LSTM later followed by two fully connected layers and used the binary cross entropy loss function. We tuned the following hyper-parameters: the number of hidden nodes in the LSTM layer (e.g., 8,16, 32), the number of nodes in the fully connected layers (e.g., 8, 16, 32), batch size (e.g., 16, 32, 64), and dropout rate (e.g., 0, 0.2, 0.4). The hyper-parameters for each model were selected through a random search in 4-fold cross validation with 50% of data for training, 25% for validation, and 25% for testing.
Validation, Metrics, and Statistical Comparisons
We used four-fold cross-validation at the participant level to ensure generalizability to new participants [16]. Here, the dataset was randomly split into four folds, with the data from a given participant only being in a single fold. The process was repeated 10 times with a different random partitioning of the folds for each run. The same fold assignments were used to train the Random Forest gaze models and baseline models per run, but fold assignments were not preserved for the LSTM models as they were run in a different pipeline. For the random forest models, we only used participants who completed all assessments for a fair comparison across time (N=122). All participants (irrespective of whether they completed all assessments) were used for the LSTMs to maximize the data needed for these data-intensive models (N=147). Because there was very little variability across runs, predictions were pooled for each participant from all runs prior to computing accuracy measures.
Performance was evaluated using the area under the precision-recall curve (AUPRC), which ranges from 0 to 1 with the ratio of true classes to total data (i.e., base rates) indicating baseline classification by guessing. The AUPRC was used because it is well-suited for class imbalance unlike the receiver operator curve (ROC) which may provide an overly optimistic view of model performance when classes are imbalanced [29]. AUPRCs were separately computed for each assessment type and time on a per-participant basis, resulting in eight values per participant per classification model.
We used linear mixed models [21] via the lmer package in R [2] to compare the percent improvement of AUPRCs over baseline (100*((AUPRC – base rate) / base rate)). Mixed models are the recommended approach due to the repeated nature of the data (i.e., eight values per participant per model). Here, participant was included as an intercept-only random effect. We probed significant effects with the emmeans (estimated marginal means) package using a false discovery rate (FDR) adjustment for multiple comparisons and a two-tailed p < .05 significant criterion.
Results
Observed comprehension differences across depth and time
We first considered how comprehension changed as a function of depth and time (Figure 4). To examine the extent to which each assessment measured the same construct, we first computed the proportion correct for each assessment for each participant. From here, we computed the Pearson correlation between the comprehension scores for each pairwise assessment (Table 5 upper diagonal). Overall, the average correlation was 0.23 and ranged from -0.13 to 0.54, suggesting that there was some overlap but also unique information in what each assessment measured.
Assessment | Rote: During | Rote: After Each | Rote: After All | Rote: Delay | Inference: During | Inference: After Each | Inference: After All | Inference: Delay |
|---|---|---|---|---|---|---|---|---|
Rote: During | - | 0.33 | 0.42 | 0.35 | 0.38 | 0.13 | 0.08 | 0.11 |
Rote: After Each | 0.19 | - | 0.54 | 0.37 | 0.26 | 0.23 | 0.17 | 0.11 |
Rote: After All | 0.51 | 0.04 | - | 0.47 | 0.44 | 0.22 | 0.18 | 0.18 |
Rote: Delay | -0.01 | 0.18 | -0.02 | - | 0.35 | 0.26 | 0.25 | 0.18 |
Inference: During | 0.62 | 0.05 | 0.51 | -0.03 | - | 0.17 | 0.16 | 0.14 |
Inference After Each | 0.02 | 0.21 | -0.10 | 0.10 | -0.02 | - | 0.20 | 0.10 |
Inference: After All | 0.02 | -0.007 | 0.16 | 0.02 | 0.002 | 0.003 | - | -0.13 |
Inference: Delay | 0.16 | 0.07 | 0.30 | -0.10 | 0.18 | -0.28 | -0.07 | - |
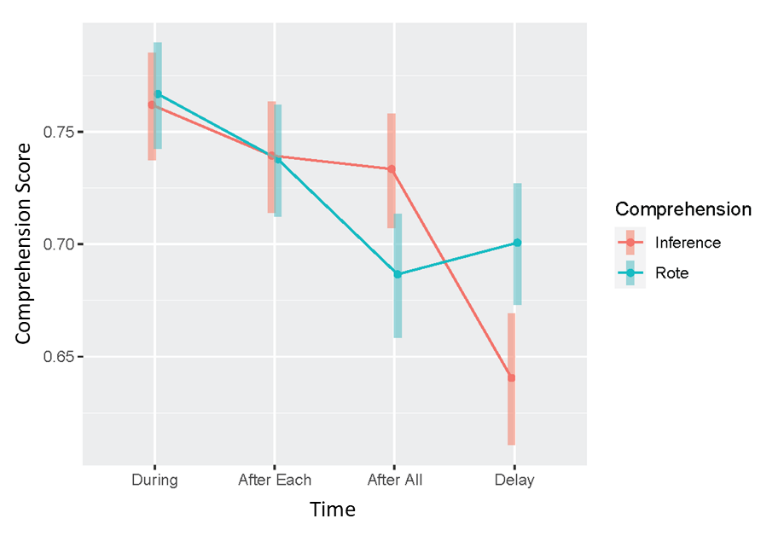
Next, we examined how averaged subject-level comprehension measures varied as a function of depth and time using the following linear mixed-effects model: proportion correct ~ depth*time + (1|participant). There were significant main effects (ps < .01) and interactions (ps < .07). For the main effect of comprehension depth, the rote assessment scores were significantly (B = 0.05, p = .01) higher than the inference assessments. We then probed the significant interactions using emmeans. For rote comprehension, the mean score during reading was statistically equivalent to the score after reading each text (p = 0.10) which were both statistically greater (p < 0.05) than assessments after reading all the texts (p > 0.05) and at delay (p > 0.05), suggesting the following pattern: [During = After Each] > [After All = Delay]. This suggested that as people read, rote comprehension was stable but drops upon completion of reading. Inference comprehension was stable across the reading session but dropped at delay with the pattern of significance: [During = After Each = After All] > Delay.
Gaze Models can predict short and long-term reading comprehension
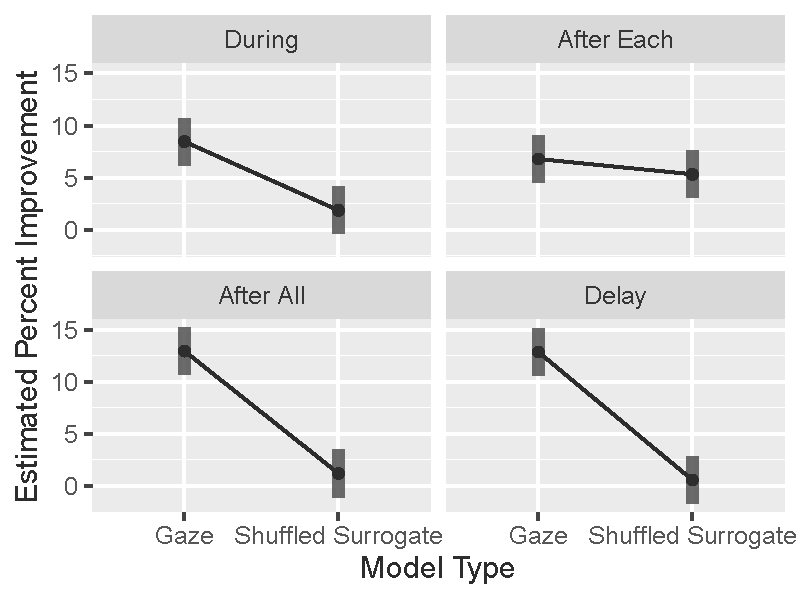
Gaze vs. shuffled (Random Forest and LSTM). Our first comparison examined whether the random forest gaze models performed significantly better than the shuffled surrogates across depth and time (Figure 5): percent improvement ~ model type (shuffled vs. gaze)*depth*time + (1|participant). Overall, there was a significant interaction between model type and time (p < 0.001). All other interactions and main effects were non-significant (all ps > 0.05). When probing the model type x time interaction, we found that the gaze models outperformed the shuffled models for all cases (Figure 5; ps < 0.001) except for the “after each” model (p = 0.37), though the trend was in the expected direction. When we repeated the analysis for the LSTM model, the interactions and main effects of interest were non-significant (all ps > 0.28), indicating that they performed at chance in all cases and was indistinguishable to the shuffled model. Given the chance performance of the LSTMs, the results focus on the random forest models.
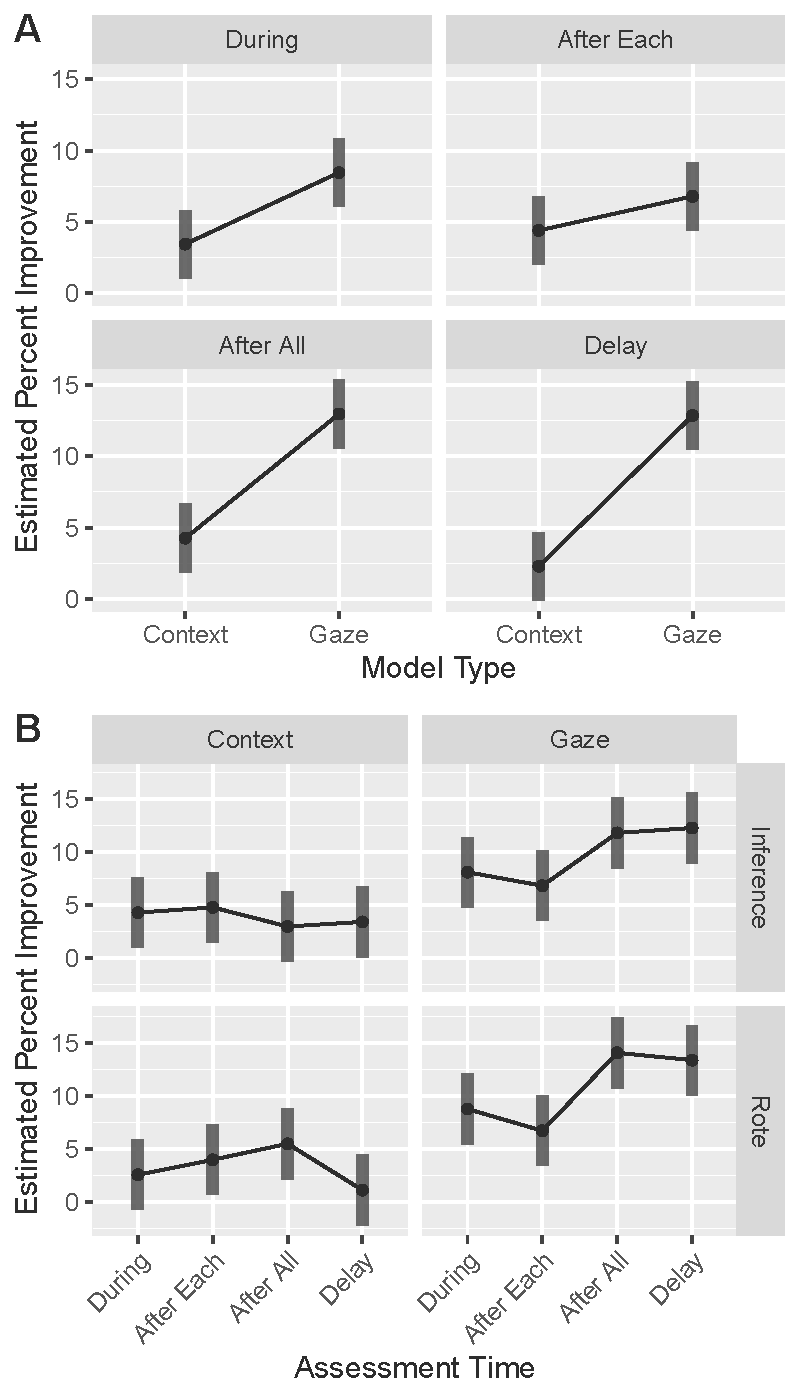
Gaze vs. context (Random Forest only). Our second analysis evaluated whether the random forest gaze models performed significantly better than the context models across depth and time (Figure 6): percent improvement ~ model type (gaze vs. context)*depth*time + (1|participant). Overall, there was a model by time interaction (p = 0.002), indicating that the gaze model outperformed the context model for all cases (ps < 0.05) except for the “after each” model (p = 0.14), though the trend was in the expected direction. Furthermore, there were no significant differences across time for the context model, as expected. However, for gaze, there were differences across time (Figure 6b). Specifically, comprehension assessed after reading all texts was statistically equivalent to the delay (p = 0.90) which was statistically higher than assessments during reading (p = 0.02) which was in turn equivalent to assessments after each text (p = 0.34), suggesting the following pattern: [After All = Delay] > [During = After Each]. There were no significant main effects nor interactions for comprehension depth, indicating similar patterns for rote and inference comprehension items.
Assessment | Gaze | Context | Base Rate | |
|---|---|---|---|---|
Rote: During | 0.81 [0.80, 0.81] | 0.77 [0.77, 0.78] | 0.67 | |
Rote: After Each | 0.76 [0.76, 0.76] | 0.74 [0.74, 0.75] | 0.72 | |
Rote: After All | 0.75 [0.75, 0.76] | 0.71 [0.71, 0.72] | 0.68 | |
Rote: Delay | 0.75 [0.75, 0.75] | 0.68 [0.68, 0.69] | 0.68 | |
Inference: During | 0.80 [0.80, 0.81] | 0.78 [0.78, 0.78] | 0.75 | |
Inference: After Each | 0.78 [0.78, 0.78] | 0.76 [0.76, 0.76] | 0.73 | |
Inference: After All | 0.80 [0.80, 0.80] | 0.74 [0.74, 0.75] | 0.73 | |
Inference: Delay | 0.71 [0.70, 0.71] | 0.65 [0.65, 0.65] | 0.64 | |
Model discrimination. To understand to what extent the random forest gaze model predictions were generally picking up on the same comprehension constructs, we computed the average model probabilities for each participant and assessment and correlated them (Table 5, grey diagonal). Overall, the average correlation was 0.09 and ranged from -0.28 to 0.62, suggesting that the models were discriminating among the different comprehension assessments, with the highest correlation being between Rote During and Inference During, suggesting the model might be picking up on similar gaze patterns for both ‘During’ assessments.
Feature Analyses (Random Forest only)
We examined impurity-based feature importances from the Random Forest model to determine which aspects of gaze were most predictive of comprehension and whether the predicted features differed across comprehension types and delays. Here, we computed the correlation between the feature importances between each pairwise assessment for each run and then averaged across runs (Table 7). The grand average correlation excluding the diagonals was 0.15, indicating some overlap of feature importances across depth and time despite the broad range of features. Overall, the rote measures showed a mean rs = 0.19, with a range from -0.007 to 0.35 (light grey in Table 7), with rote comprehension during reading showing the lowest correlations with the other rote assessments (rs = -0.007, 0.06, and 0.16 compared to rs = 0.27, 0.30, and 0.35 for the other rote assessments). Conversely, the inference comprehension measures showed a wide range of correlations with each other (from rs = -0.14 to 0.57). This is in part due to the delayed inference assessments showing negative correlations with all other inference assessments (rs = -0.14, -0.05, -0.10), while all other correlations were positive, with inferencing assessed during reading and after reading all texts showing the highest correlation (r = 0.57). Correlations among rote and inference assessments showed a mean rs = 0.15, with a range from -0.10 to 0.57 and the strongest correlations among the delayed rote assessments and inferencing assessed during the session (rs from 0.26 to 0.57). Thus, the pattern of inter-associations among feature importances is mixed.
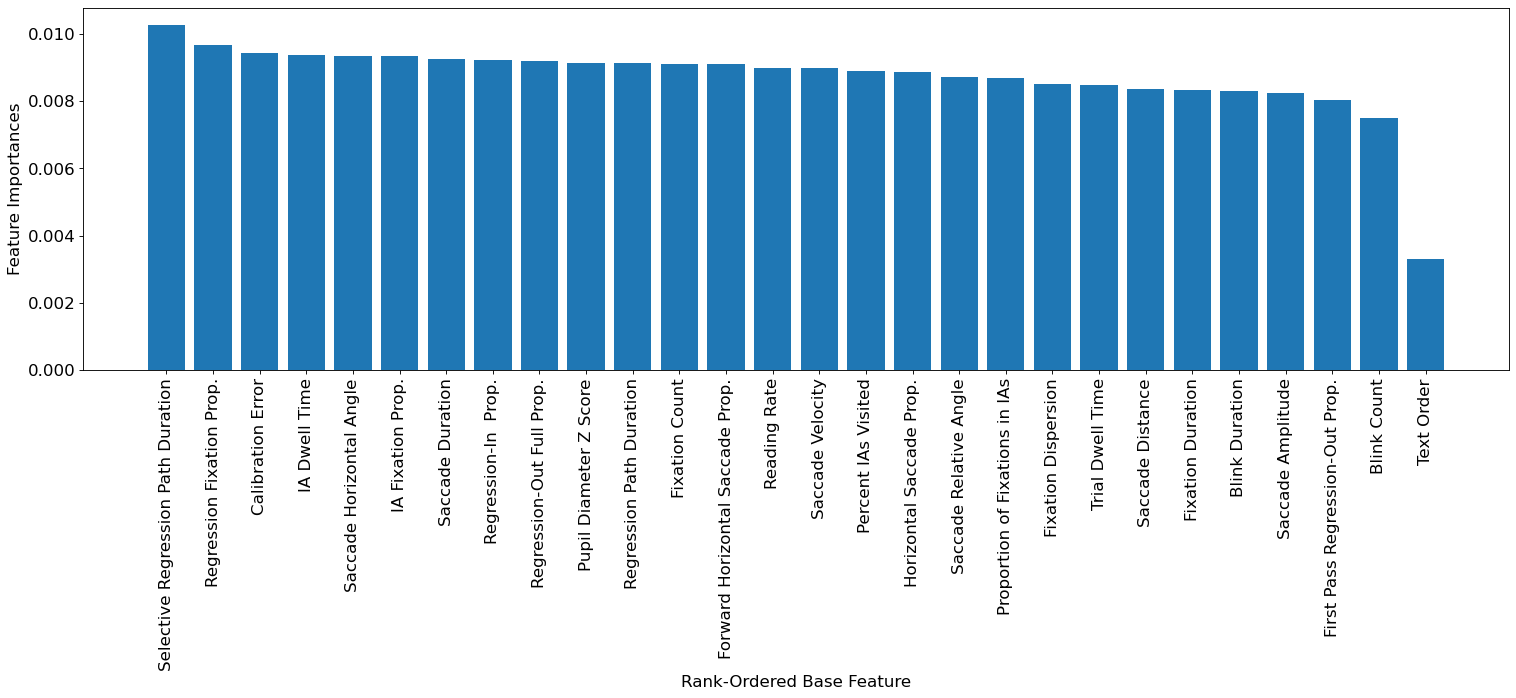
We then assessed which features were most important to comprehension across depth and time. To this end, we first computed the overall mean feature importances for each run across all assessments and averaged across runs. We then grouped and averaged each set of statistical features together to assess relative importance of each feature type. For example, for the “fixation duration” feature set, the feature importances for the eight statistical features of fixation duration were averaged together. We found that the top four feature categories were: the selective regression path duration (average importance = 0.0103), regression fixation proportion (average importance = 0.0097), calibration error (average importance = 0.0094), and interest area dwell time (average importance = 0.0094). Although these features were the most important, it appeared that all features contributed to model performance as they were all greater than zero (Figure 7).
Assessment | Rote: During | Rote: After Each | Rote: After All | Rote: Delay | Inference: During | Inference: After Each | Inference: After All | Inference: Delay |
|---|---|---|---|---|---|---|---|---|
Rote: During | - | -0.007 | 0.16 | 0.06 | -0.01 | 0.10 | -0.10 | 0.02 |
Rote: After Each |
| - | 0.27 | 0.30 | 0.35 | 0.10 | 0.32 | -0.05 |
Rote: After All |
|
| - | 0.35 | 0.06 | 0.35 | 0.05 | -0.03 |
Rote: Delay |
|
|
| - | 0.57 | 0.26 | 0.46 | -0.04 |
Inference: During |
|
|
|
| - | 0.15 | 0.57 | -0.14 |
Inference After Each |
|
|
|
|
| - | 0.13 | -0.05 |
Inference: After All |
|
|
|
|
|
| - | -0.10 |
Inference: Delay |
|
|
|
|
|
|
| - |
Discussion
Our goal was to investigate the relationship between eye tracking and reading comprehension outcomes by identifying whether gaze-based models of reading could predict different depths of comprehension at varying degrees of delay. We discuss our main findings followed by applications, and limitations.
Main Findings
Beginning with observed rote and inference comprehension, we found that accuracies were highest during reading and dropped when assessed at seven days post-study, which is what we would expect. Nevertheless, the gaze-based Random Forest models could still predict both comprehension types significantly better than baselines during all stages of reading except for the “after each” assessment, which followed the same trend. Furthermore, we found a pattern such that gaze became more predictive of comprehension as time progressed within the main reading session, with performance peaking for assessments administered after reading all the texts.
As noted in Figure 1, theories of reading comprehension posit that readers first attend to and encode the text at the surface-level to form a text-based representation followed by a situational (mental) model via bridging inferences and elaboration, which is then consolidated into long-term memory. While there are reasons to expect that gaze should predict rote, short-term retention of information that simply requires attention to and basic encoding of the text (as others have shown – see Table 1), our results indicate that it is also related to the processes underlying deep, long-term comprehension which are typically viewed as internal cognitive processes that occur in the absence of eye movements [40]. To our knowledge, this is the first study to show that gaze during reading is predictive of deep, long-term comprehension since previous work has mainly focused on rote comprehension [55].
Second, while our models demonstrated participant-level generalizability (in contrast to prior work – see Table 1), the percent improvements of our models relative to baseline were admittedly modest (i.e., Random Forest percent improvements ranging from 6.74 to 14.08). However, as indicated in the Introduction, the present goal was not to develop the most predictive model but to examine the predictive accuracy of a set of eye gaze features across comprehension depth and time. As such, we did not include many pertinent non-gaze features (e.g., text difficulty; item difficulty) that may be highly predictive when coupled with eye gaze.
It should be noted that D’Mello et al. [16] found that a gaze model yielded very high accuracies (AUROCs close to 0.9) for modeling rote comprehension during reading. One key difference is the D’Mello et al. study only measured rote comprehension with the items triggered in response to an automated mind-wandering detector. This may have engendered a very different reading strategy (and corresponding eye movement patterns) entailing skimming the text to identify targets for subsequent questions (the authors acknowledge this in Mills et al. [14]) than the more general reading strategies required here given the variety of comprehension measures. Thus, the high-accuracy scores reported in D’Mello et al. [16] might not generalize more broadly.
Third, there was overlap in feature importances across depth and time, with the top four predictive features being the selective regression path duration, regression fixation proportion, calibration error, and dwell time per interest area. It is possible these features capture measures of processing later in the time course of reading, and rereading text for comprehension repair, both of which are key to higher-level comprehension [9]. Dwell time, for instance, reflects the processing time (early and late), and in combination with selective regression path duration could be reflecting processing difficulty later in reading a page (e.g., low selective regression path duration but high dwell time suggests difficulties only later on in the comprehension of a page [36]). Regression fixation proportion is also an important indication of comprehension repair [46, 52], and has been used in previous gaze models of comprehension [55]. Because it is difficult to interpret the direction of association of individual features in random forest models (due to interactivity), these patterns are speculative, and await further empirical data.
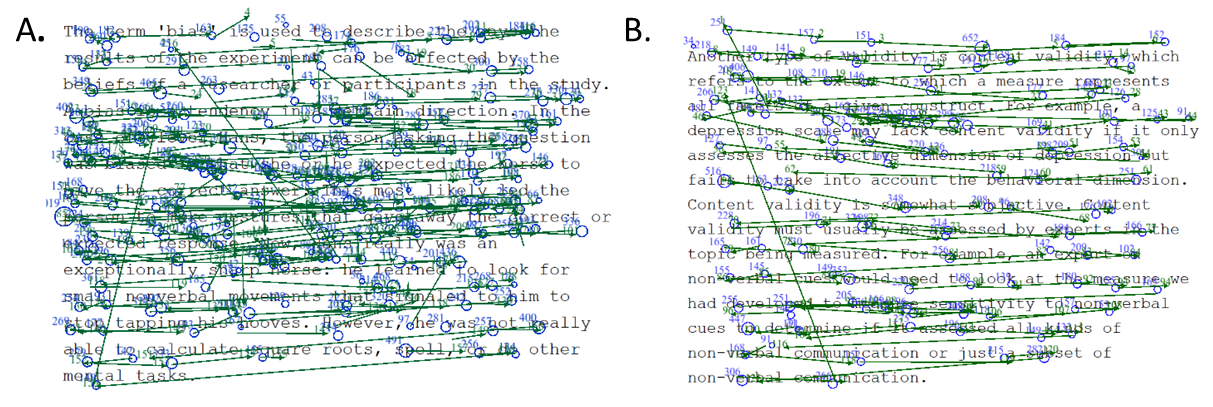
Historically, regressions have been one of the more difficult aspects of eye behavior to capture [48]. While it has long been posited that regressions occur when a reader experiences a difficulty in comprehension which triggers the reader to look back in the text to repair their comprehension deficit [9], several studies have linked an increase in regressions to better comprehension [28, 52], while others show the opposite effect [31]. Regression fixation proportion, the feature with the second highest average importance, indicates how often readers did not understand the text and acted to repair their comprehension [46], and might also be a way to distinguish better from poor readers, as better readers reread less and are more efficient at redirecting their gaze efficiently [64]. Figure 8 shows an example of gaze behavior that leads to accurate and inaccurate comprehension. Note that in Figure 8A there are more regressions (seen as long saccades cutting across multiple lines of text) and more reading in the middle of the text- an area which might have been giving the student some difficulty. On the other hand, the gaze on the page with inaccurate comprehension demonstrates a more even pattern of eye movements: possibly less attention to the text and less comprehension repair.
We also found that calibration error was predictive of comprehension. Indeed, prior work has found that greater pre-trial fixation dispersion is prospectively predictive of mind wandering [65]. Because mind wandering is negatively related to comprehension [14, 54], it might be the case that calibration error (and pre-trial fixation dispersion) is also negatively predictive of comprehension.
Applications
This research is a step towards gaze-based computational models of reading comprehension. Such models can be integrated into adaptive systems that trigger assessments and provide opportunities to correct comprehension deficiencies when lapses of comprehension are detected (similar to the gaze-based models that adaptively trigger interventions when mind wandering is detected [4, 13, 19, 27]). Given the modest accuracies obtained in the present study, the most immediate applications are in interventions that can be applied in a ‘fail-soft’ manner. These do not disrupt the student and do not pose any harm if comprehension is miss-classified. Interleaving questions during reading is one such example [57] , as is encouraging re-reading at the end of a text or adaptively selecting post-reading assessments based on model-assessed comprehension during reading.
With further research, more fine-grained interventions that target different depths (rote vs. inference) and timescales (short- or long-term comprehension) are also feasible. For instance, if a student is preparing for an upcoming examination, models and interventions supporting long-term comprehension might be preferred compared to cases where short-term retention suffices (reading a short article). Other possible interventions include reducing textual difficulty or providing scaffolds when comprehension difficulties are detected [53] or even increasing difficulty when the reader is not being sufficiently challenged (e.g., the reverse cohesion effect [44] where good comprehenders benefit more from texts with lower cohesion).
In addition to direct intervention, the models also have applications with respect to assessment. For example, if the rote and inference model consistently (i.e., across multiple participants) predict high and low comprehension scores on a given page, respectively, this might suggest that there is a cohesion gap with respect to the content on the page that is impeding inference generation.
Limitations
Like all studies, ours has limitations. First, we only examined gaze on a particular page, thereby overly constraining the models. Therefore, there may have been other factors, such as gaze on the preceding page, that may have been relevant to reading comprehension but were not incorporated into the gaze models.
Furthermore, it might be the case that the lab settings changed behaviors relative to how participants would behave in more ecologically valid settings. Specifically, participants donned other sensors and face masks to adhere to COVID safety procedures, which may have resulted in discomfort and unnatural reading behaviors (but see Table 4 which showed high horizontal saccade proportion and percent of fixations in interest areas indicating people were on task).
Next, the classes in the data were imbalanced, and we chose to not balance the classes since this might not capture real-world variation in comprehension. However, class imbalance might have introduced a confound when comparing model performance over time in that accuracies reflected the level of class imbalance rather than differences in comprehension depth and time. To address this possibility, we did test models on balanced classes and results did not change.
Although the present study demonstrated cross-subject generalization, participants only read one set of texts and therefore it is unknown whether the models would generalize to new texts. That said, because we used features which capture relative changes in gaze (e.g., angles) as opposed to absolute, stimulus-dependent values (e.g., coordinates), we think they are likely to generalize to similar contexts. To this point, prior work using similar global page-level features demonstrated cross-task-generalization for mostly rote comprehension after reading [55], but this is an empirical question for comprehension models at different depths and time delays.
Finally, the LSTMs yielded chance-level performance. This was despite using features that reflected relative changes in gaze (e.g., relative angles) in contrast to prior LSTM work that used absolute fixation coordinates [1]. It might be the case that there are not generalizable patterns in local gaze dynamics that are predictive of comprehension. Alternatively, and more likely, there might not have been sufficient data to learn these patterns should they exist given the relatively small number of training examples compared to the number of parameters in the LSTM models.
Concluding Remarks
Reading comprehension is a complex cognitive process that is critical to daily tasks. It unfolds across different depths and over time, raising the question of what eye movements known to index initial encoding of information can reveal about the processes underlying deep, long-term comprehension (Figure 1). Our results show, for the first time, that eye movements have the potential to provide an index into deeper inference-level comprehension assessed as late as a week after reading, indicating they capture far more than temporary surface-level encoding of a text.
References
- Ahn, S., Kelton, C., Balasubramanian, A. and Zelinsky, G. 2020. Towards Predicting Reading Comprehension From Gaze Behavior. ACM Symposium on Eye Tracking Research and Applications. (2020), 1–5. DOI:https://doi.org/10.1145/3379156.3391335.
- Bates, D., Mächler, M., Bolker, B. and Walker, S. 2015. Fitting Linear Mixed-Effects Models Using lme4. Journal of Statistical Software. 67, (Oct. 2015), 1–48. DOI:https://doi.org/10.18637/jss.v067.i01.
- Biedert, R., Buscher, G., Schwarz, S., Möller, M., Dengel, A. and Lottermann, T. 2010. The text 2.0 framework: writing web-based gaze-controlled realtime applications quickly and easily. Proceedings of the 2010 workshop on Eye gaze in intelligent human machine interaction - EGIHMI ’10. (2010), 114–117. DOI:https://doi.org/10.1145/2002333.2002351.
- Bixler, R. and D’Mello, S. 2016. Automatic gaze-based user-independent detection of mind wandering during computerized reading. User Modeling and User-Adapted Interaction. 26, 1 (Mar. 2016), 33–68. DOI:https://doi.org/10.1007/s11257-015-9167-1.
- Booth, R.W. and Weger, U.W. 2013. The function of regressions in reading: Backward eye movements allow rereading. Memory & Cognition. 41, 1 (Jan. 2013), 82–97. DOI:https://doi.org/10.3758/s13421-012-0244-y.
- Chi, M.T. 2000. Self-explaining expository texts: The dual processes of generating inferences and repairing mental models. Advances in instructional psychology. 5, (2000), 161--238.
- Christianson, K., Luke, S.G., Hussey, E.K. and Wochna, K.L. 2017. Why reread? Evidence from garden-path and local coherence structures. Quarterly Journal of Experimental Psychology. 70, 7 (Jul. 2017), 1380–1405. DOI:https://doi.org/10.1080/17470218.2016.1186200.
- Conati, C., Aleven, V., Mitrovic, A., Graesser, A., Sottilare, A., Hu, H. and Holden, H. 2013. Eye-Tracking for Student Modelling in Intelligent Tutoring Systems. Design Recommendations for Intelligent Tutoring Systems - Volume 1: Learner Modeling. Army Research Laboratory. 227–236.
- Cook, A.E. and Wei, W. 2019. What Can Eye Movements Tell Us about Higher Level Comprehension? Vision. 3, 3 (Sep. 2019), 45. DOI:https://doi.org/10.3390/vision3030045.
- Copeland, L. and Gedeon, T. 2013. Measuring reading comprehension using eye movements. 2013 IEEE 4th International Conference on Cognitive Infocommunications (CogInfoCom) (Dec. 2013), 791–796.
- Copeland, L., Gedeon, T. and Caldwell, S. 2016. Effects of text difficulty and readers on predicting reading comprehension from eye movements. 2015 6th IEEE International Conference on Cognitive Infocommunications (CogInfoCom). (Jan. 2016), 407–412. DOI:https://doi.org/10.1109/coginfocom.2015.7390628.
- Copeland, L., Gedeon, T. and Mendis, S. 2014. Fuzzy Output Error as the Performance Function for Training Artificial Neural Networks to Predict Reading Comprehension from Eye Gaze. (2014), 586–593. DOI:https://doi.org/10.1007/978-3-319-12637-1_73.
- D’Mello, S., Kopp, K., Bixler, R.E. and Bosch, N. 2016. Attending to Attention: Detecting and Combating Mind Wandering during Computerized Reading. Proceedings of the 2016 CHI Conference Extended Abstracts on Human Factors in Computing Systems - CHI EA ’16 (San Jose, California, USA, 2016), 1661–1669.
- D’Mello, S. and Mills, C. Mind wandering during reading: An interdisciplinaryandintegrative review of psychological, computing, & intervention research and theory. Language and Linguistics Compass: Cognitive Science of Language.
- D’Mello, S.K. 2016. Giving Eyesight to the Blind: Towards Attention-Aware AIED. International Journal of Artificial Intelligence in Education. 26, 2 (Jun. 2016), 645–659. DOI:https://doi.org/10.1007/s40593-016-0104-1.
- D’Mello, S.K., Southwell, R. and Gregg, J. 2020. Machine-Learned Computational Models Can Enhance the Study of Text and Discourse: A Case Study Using Eye Tracking to Model Reading Comprehension. Discourse Processes. 57, 5–6 (Jul. 2020), 420–440. DOI:https://doi.org/10.1080/0163853X.2020.1739600.
- D’Mello, S.K., Tay, L. and Southwell, R. 2022. Psychological Measurement in the Information Age: Machine-Learned Computational Models. Current Directions in Psychological Science. 31, 1 (Feb. 2022), 76–87. DOI:https://doi.org/10.1177/09637214211056906.
- Engbert, R., Nuthmann, A., Richter, E.M. and Kliegl, R. 2005. SWIFT: A Dynamical Model of Saccade Generation During Reading. Psychological Review. 112, 4 (2005), 777–813. DOI:https://doi.org/10.1037/0033-295X.112.4.777.
- Faber, M., Bixler, R. and D’Mello, S.K. 2018. An automated behavioral measure of mind wandering during computerized reading. Behavior Research Methods. 50, 1 (Feb. 2018), 134–150. DOI:https://doi.org/10.3758/s13428-017-0857-y.
- Faber, M., Krasich, K., Bixler, R.E., Brockmole, J.R. and D’Mello, S.K. 2020. The eye–mind wandering link: Identifying gaze indices of mind wandering across tasks. Journal of Experimental Psychology: Human Perception and Performance. 46, 10 (Oct. 2020), 1201–1221. DOI:https://doi.org/10.1037/xhp0000743.
- Faraway, J.J. 2016. Extending the Linear Model with R: Generalized Linear, Mixed Effects and Nonparametric Regression Models, Second Edition. CRC Press.
- Flesch, R. 1948. A new readability yardstick. Journal of applied psychology. 32, 3 (1948), 221.
- Frazier, L. and Rayner, K. 1982. Making and correcting errors during sentence comprehension: Eye movements in the analysis of structurally ambiguous sentences. Cognitive Psychology. 14, 2 (Apr. 1982), 178–210. DOI:https://doi.org/10.1016/0010-0285(82)90008-1.
- Graesser, A.C., Singer, M. and Trabasso, T. 1994. Constructing inferences during narrative text comprehension. Psychological Review. 101, 3 (1994), 371–395. DOI:https://doi.org/10.1037/0033-295X.101.3.371.
- Grainger, J. and Holcomb, P.J. 2009. Watching the Word Go by: On the Time‐course of Component Processes in Visual Word Recognition. Language and Linguistics Compass. 3, 1 (2009), 128–156. DOI:https://doi.org/10.1111/j.1749-818x.2008.00121.x.
- Henderson, J.M., Choi, W., Luke, S.G. and Schmidt, J. 2018. Neural correlates of individual differences in fixation duration during natural reading. Quarterly Journal of Experimental Psychology. 71, 1 (Jan. 2018), 314–323. DOI:https://doi.org/10.1080/17470218.2017.1329322.
- Hutt, S., Krasich, K., Mills, C., Bosch, N., White, S., Brockmole, J.R. and D’Mello, S.K. 2019. Automated gaze-based mind wandering detection during computerized learning in classrooms. User Modeling and User-Adapted Interaction. 29, 4 (Sep. 2019), 821–867. DOI:https://doi.org/10.1007/s11257-019-09228-5.
- Inhoff, A.W., Kim, A. and Radach, R. 2019. Regressions during Reading. Vision. 3, 3 (2019), 35. DOI:https://doi.org/10.3390/vision3030035.
- Jeni, L.A., Cohn, J.F. and De La Torre, F. 2013. Facing Imbalanced Data–Recommendations for the Use of Performance Metrics. 2013 Humaine Association Conference on Affective Computing and Intelligent Interaction (Sep. 2013), 245–251.
- Just, M.A. and Carpenter, P.A. 1980. A theory of reading: From eye fixations to comprehension. Psychological Review. 87, 4 (Jul. 1980), 329–354. DOI:http://dx.doi.org/10.1037/0033-295X.87.4.329.
- Kemper, S., Crow, A. and Kemtes, K. 2004. Eye-Fixation Patterns of High- and Low-Span Young and Older Adults: Down the Garden Path and Back Again. Psychology and Aging. 19, 1 (2004), 157–170. DOI:https://doi.org/10.1037/0882-7974.19.1.157.
- Kendeou, P. and van den Broek, P. 2007. The effects of prior knowledge and text structure on comprehension processes during reading of scientific texts. Memory & Cognition. 35, 7 (Oct. 2007), 1567–1577. DOI:https://doi.org/10.3758/BF03193491.
- Kintsch, W. 2011. An Overview of Top-Down and Bottom-Up Effects in Comprehension: The CI Perspective. Discourse Processes. 39, 2–3 (2011), 125–128. DOI:https://doi.org/10.1080/0163853x.2005.9651676.
- Kintsch, W. 2005. An Overview of Top-Down and Bottom-Up Effects in Comprehension: The CI Perspective. Discourse Processes. 39, 2–3 (May 2005), 125–128. DOI:https://doi.org/10.1080/0163853X.2005.9651676.
- Kruthiventi, S.S.S., Ayush, K. and Babu, R.V. 2017. DeepFix: A Fully Convolutional Neural Network for Predicting Human Eye Fixations. IEEE Transactions on Image Processing. 26, 9 (Sep. 2017), 4446–4456. DOI:https://doi.org/10.1109/TIP.2017.2710620.
- Liversedge, S.P., Paterson, K.B. and Pickering, M.J. 1998. Eye Movements and Measures of Reading Time. Eye Guidance in Reading and Scene Perception. Elsevier. 55–75.
- Masson, M.E.J. 1983. Conceptual processing of text during skimming and rapid sequential reading. Memory & Cognition. 11, 3 (1983), 262–274. DOI:https://doi.org/10.3758/bf03196973.
- McDonald, S.A. and Shillcock, R.C. 2003. Eye movements reveal the on-line computation of lexical probabilities during reading. Psychological Science. 14, 6 (Nov. 2003), 648–652. DOI:https://doi.org/10.1046/j.0956-7976.2003.psci_1480.x.
- McNamara, D.S. and Magliano, J. 2009. Chapter 9 Toward a Comprehensive Model of Comprehension. Psychology of Learning and Motivation. Academic Press. 297–384.
- Meseguer, E., Carreiras, M. and Clifton, C. 2002. Overt reanalysis strategies and eye movements during the reading of mild garden path sentences. Memory & Cognition. 30, 4 (Jun. 2002), 551–561. DOI:https://doi.org/10.3758/BF03194956.
- Mills, C., Gregg, J., Bixler, R. and D’Mello, S.K. 2021. Eye-Mind reader: an intelligent reading interface that promotes long-term comprehension by detecting and responding to mind wandering. Human–Computer Interaction. 36, 4 (Jul. 2021), 306–332. DOI:https://doi.org/10.1080/07370024.2020.1716762.
- Miyata, H., Minagawa-Kawai, Y., Watanabe, S., Sasaki, T. and Ueda, K. 2012. Reading Speed, Comprehension and Eye Movements While Reading Japanese Novels: Evidence from Untrained Readers and Cases of Speed-Reading Trainees. PLoS ONE. 7, 5 (May 2012). DOI:https://doi.org/10.1371/journal.pone.0036091.
- Nadel, L., Hupbach, A., Gomez, R. and Newman-Smith, K. 2012. Memory formation, consolidation and transformation. Neuroscience & Biobehavioral Reviews. 36, 7 (2012), 1640–1645. DOI:https://doi.org/10.1016/j.neubiorev.2012.03.001.
- O’reilly, T. and Mcnamara, D.S. 2007. Reversing the Reverse Cohesion Effect: Good Texts Can Be Better for Strategic, High-Knowledge Readers. Discourse Processes. 43, 2 (Apr. 2007), 121–152. DOI:https://doi.org/10.1080/01638530709336895.
- Price, C.J., Moore, C.J., Humphreys, G.W. and Wise, R.J.S. 1997. Segregating Semantic from Phonological Processes during Reading. Journal of Cognitive Neuroscience. 9, 6 (1997), 727–733. DOI:https://doi.org/10.1162/jocn.1997.9.6.727.
- Rayner, K. 1998. Eye movements in reading and information processing: 20 years of research. Psychological Bulletin. 124, 3 (Nov. 1998), 372–422. DOI:https://doi.org/10.1037/0033-2909.124.3.372.
- Rayner, K. and McConkie, G.W. 1976. What guides a reader’s eye movements? Vision Research. 16, 8 (Jan. 1976), 829–837. DOI:https://doi.org/10.1016/0042-6989(76)90143-7.
- Rayner, K. and Slattery, T.J. 2009. Eye movements and moment-to-moment comprehension processes in reading. Beyond decoding: The behavioral and biological foundations of reading comprehension. Guilford Press. 27–45.
- Rayner, K., Slattery, T.J., Drieghe, D. and Liversedge, S.P. 2011. Eye Movements and Word Skipping During Reading: Effects of Word Length and Predictability. Journal of Experimental Psychology: Human Perception and Performance. 37, 2 (2011), 514–528. DOI:https://doi.org/10.1037/a0020990.
- Reichle, E.D., Warren, T. and McConnell, K. 2009. Using E-Z reader to model the effects of higher level language processing on eye movements during reading. Psychonomic Bulletin & Review. 16, 1 (Feb. 2009), 1–21. DOI:https://doi.org/10.3758/PBR.16.1.1.
- Roda, C. and Thomas, J. 2006. Attention aware systems: Theories, applications, and research agenda. Computers in Human Behavior. 22, 4 (Jul. 2006), 557–587. DOI:https://doi.org/10.1016/j.chb.2005.12.005.
- Schotter, E.R., Tran, R. and Rayner, K. 2014. Don’t Believe What You Read (Only Once): Comprehension Is Supported by Regressions During Reading. Psychological Science. 25, 6 (Jun. 2014), 1218–1226. DOI:https://doi.org/10.1177/0956797614531148.
- Shute, V.J. and Zapata-Rivera, D. 2012. Adaptive Technologies for Training and Education. (2012), 7–27. DOI:https://doi.org/10.1017/cbo9781139049580.004.
- Smallwood, J., McSpadden, M. and Schooler, J.W. 2008. When attention matters: the curious incident of the wandering mind. Memory & cognition. 36, 6 (2008), 1144–50. DOI:https://doi.org/10.3758/mc.36.6.1144.
- Southwell, R., Gregg, J., Bixler, R. and D’Mello, S.K. 2020. What Eye Movements Reveal About Later Comprehension of Long Connected Texts. Cognitive Science. 44, 10 (2020), e12905. DOI:https://doi.org/10.1111/cogs.12905.
- Strukelj, A. and Niehorster, D.C. 2018. One page of text: Eye movements during regular and thorough reading, skimming, and spell checking. Journal of Eye Movement Research. 11, 1 (Feb. 2018). DOI:https://doi.org/10.16910/jemr.11.1.1.
- Szpunar, K.K., Khan, N.Y. and Schacter, D.L. 2013. Interpolated memory tests reduce mind wandering and improve learning of online lectures. Proceedings of the National Academy of Sciences. 110, 16 (Apr. 2013), 6313–6317. DOI:https://doi.org/10.1073/pnas.1221764110.
- Turan, C., Wang, Y., Lai, S.-C., Neergaard, K.D. and Lam, K.-M. 2018. Facial Expressions of Sentence Comprehension. 2018 IEEE 23rd International Conference on Digital Signal Processing (DSP) (Nov. 2018), 1–5.
- Van Dijk, T.A. and Kintsch, W. 1983. Strategies of discourse comprehension. (1983).
- Veldre, A. and Andrews, S. 2014. Lexical Quality and Eye Movements: Individual Differences in the Perceptual Span of Skilled Adult Readers. Quarterly Journal of Experimental Psychology. 67, 4 (Apr. 2014), 703–727. DOI:https://doi.org/10.1080/17470218.2013.826258.
- Vrzakova, H., Amon, M.J., Stewart, A.E.B. and D’Mello, S.K. 2019. Dynamics of Visual Attention in Multiparty Collaborative Problem Solving using Multidimensional Recurrence Quantification Analysis. Proceedings of the 2019 CHI Conference on Human Factors in Computing Systems (New York, NY, USA, May 2019), 1–14.
- Wang, X., Zhao, X. and Ren, J. 2019. A New Type of Eye Movement Model Based on Recurrent Neural Networks for Simulating the Gaze Behavior of Human Reading. Complexity. 2019, (2019), 1–12. DOI:https://doi.org/10.1155/2019/8641074.
- Yeari, M. 2017. The role of working memory in inference generation during reading comprehension_ Retention, (re)activation, or suppression of verbal information? Learning and Individual Differences. 56, (2017), 1–12. DOI:https://doi.org/10.1016/j.lindif.2017.04.002.
- Zabrucky, K. and Commander, N.E. 1993. Rereading to Understand: The Role of Text Coherence and Reader Proficiency. Contemporary Educational Psychology. 18, 4 (Oct. 1993), 442–454. DOI:https://doi.org/10.1006/ceps.1993.1033.
- Zeng, H. and Jonides, J. 2021. Pre-trial Gaze Stability Predicts Momentary Slips of Attention. PsyArXiv. (2021).
© 2022 Copyright is held by the author(s). This work is distributed under the Creative Commons Attribution-NonCommercial-NoDerivatives 4.0 International (CC BY-NC-ND 4.0) license.