ABSTRACT
A strategy for allocating merit-based awards and need-based aid is critical to a university. Such a strategy, however, must address multiple, sometimes competing objectives. We introduce an approach that couples a gradient boosting classifier for predicting outcomes from an allocation strategy with a local search optimization algorithm, which optimizes strategies based on their expected outcomes. Unlike most existing approaches that focus strictly on allocating merit-based awards, ours optimizes simultaneously the allocation of both merit-based awards and need-based aid. Further, the multi-objective optimization lets users experiment with different combinations of institution-centric and student-centric objectives to deliver outcomes that suit desired goals. With this approach, we identify multiple allocation strategies that would yield higher enrollment, revenue, or students’ affordability and access to higher education than the University’s existing strategy. In particular, one strategy suggests that with moderate changes to the current funding structure the University can increase students’ access to higher education by more than 100%, while still maintaining a similar level of enrollment and revenue.
Keywords
1. INTRODUCTION
Public universities in the United States (US) create recruitment policies amidst decreased state funding and increased costs of attendance. Decreased funding was predicted as a result of state deficits [17]. This is now evident in data showing falling state appropriations as a percent of total revenue for public 4-year institutions from academic year 2008-09 (23.8%) to academic year 2018-19 (16.5%) [12]. Decreased state funding necessitates a greater reliance on tuition and fee revenue from enrolled students.
From academic year 2011-12 through 2016-17 tuition and fees increased by 9% at public 4-year institutions, making college too costly for an increasing proportion of students (especially those from low- and lower-middle-income families) [3, 9, 26]. Students are being priced out of college or choosing to take out loans and/or work while pursuing a course of study [25]. This rising cost has resulted in a national college debt crisis in which 57% of debtors with federal student loan debt owe up to $20,000 [3].
The combination of decreased funding and increased costs of attendance have implications for enrollment management activities. An increased reliance on tuition and fee revenue means that setting policies surrounding student recruitment efforts and accurately forecasting their outcomes is increasingly important to universities’ income and budget projections [2, 38]. However, these recruitment efforts are hindered by the increased prices charged to students. Higher prices reduce enrollment rates particularly for low-income students in public institutions [22]. The use of financial aid as an enrollment management tool to counteract these increased prices is well-established [15]. Further, the positive impact of both federal and state need-based financial aid programs on students from low-income families has also been explored [3, 8, 9]. With increasing costs of attendance leading to crises of affordability and access, universities should explore the role of need-based aid in their enrollment management strategies.
The call to optimize enrollment management activities with the consideration of access and affordability is one that appears difficult to achieve. However, the student and financial data needed for such predictions and optimizations are stored in universities’ existing data systems [31]. Despite having access to this data, universities are not quick to leverage it themselves perhaps due to untrained personnel or poor data infrastructure [31, 32]. Instead, the data and these analyses are outsourced to external consulting firms who organize and process the data to be used in proprietary models [16]. With this type of industry environment there is limited published work to demonstrate how machine learning prediction and optimization can be used in tandem to inform university recruitment policies.
Existing work on financial aid optimization has been limited in two regards: (1) the optimization only takes enrollment as the sole objective and (2) the resulting strategy is for merit-based aid only [4, 28]. The limiting of the optimization to enrollment is short-sighted in that universities are targeting multiple objectives that may not move with enrollment. Additionally, when only considering merit-based awards, student-centric outcomes like access and affordability are neglected despite their increasing importance in the dialogue surrounding higher education. Our work seeks to address these shortcomings.
Our approach consists of an interactive feedback loop between two core components: a gradient-boosting classifier and auto-start local search optimizer. First, given a current strategy for award and aid allocation (together with many other features), the classifier is used to predict enrollment, revenue, the affordability and accessibility of higher education, and other outcomes. These predicted outcomes are then used by an optimizer to revise the current strategy and suggest a possibly better one. The interaction between the classifier and optimizer forms a feedback loop that is the basis of the optimization. This loop aims to identify optimal strategies for allocating awards and aid with expected outcomes specified by the University. The novelty of this work includes (1) the allocation both merit-based awards and need-based aid in the optimization process; (2) the inclusion of the affordability and accessibility of higher education in the optimization of allocation strategies; and (3) an auto-start local search optimization that allows users to target institution-centric and student-centric objectives in a flexible way to produce desirable outcomes.
2. RELATED WORK
The following describes research on enrollment prediction, scholarship allocation, and financial aid optimization. There is significant work on predicting enrollment, but far less with regard to optimization and allocation of scholarships. Most authors looked at only one of these issues and most work has been primarily concerned with merit-based aid alone.
Predicting Enrollment. Universities’ increased reliance on tuition and fee revenue has increased pressure on their limited resources to accurately predict and increase enrollment (i.e. yield). Recruitment counselors need to allocate their limited time to contact students "on-the-fence" about their enrollment decisions [10]. This business need led to the literature on enrollment prediction at the individual applicant level using data mining and machine learning techniques.
There is a host of research that relies on logistic regression techniques to create these individual enrollment probabilities. A 2002 paper by DesJardins used a logistic regression to reveal the enrollment probabilities of applicants before any financial aid offers had been made. The resulting model, which relied heavily on demographic features, had a correct classification rate of approximately 67% [10]. In 2006, Goenner and Pauls used a logistic regression to predict the enrollment of students who had inquired about the university. The resulting model was 89% accurate at out-of-sample predictions [14]. Similarly, a 2014 paper by Sugrue generated a logistic regression to predict enrollment yield [34].
In another vein of literature, other prediction techniques are explored. Two related works explore the effectiveness of neural network models in predicting individual enrollment probabilities for applicants. A 1998 paper by Walczak revealed that a backpropogation neural network model could result in a 56% decrease in recruitment counselor caseloads due to its accuracy [39]. In a follow-up study, Walczak and Sincich explicitly compare the performance of neural network models to that of logistic regression and find that neural networks produce better results [40]. Chang similarly explores the efficacy of various prediction techniques, specifying models for logistic regression, neural networks, and classification and regression tree (CR&T). The work showed that both neural networks and CR&T outperformed logistic regression when judged based on prediction accuracy [6].
Scholarship Disbursement/Allocation. Not all scholarship policies employed by universities are rule-based. In these cases, the business process of selecting the applicants to receive an award may be ineffective and inefficient. Literature has shown that data mining techniques can be effective in creating rule-based scholarship allocation policies to help reduce business process inefficiencies. In 2019, Rohman et al. illustrated how an ID3 decision tree algorithm could generate rules to select the scholarship applicants most likely to be awarded a scholarship. This general rule allowed for the efficient identification of applicants so that offers could be made [27]. Alhassan and Lawal similarly used a tree-based data mining classification technique to determine a generic rule for scholarship disbursal. They found the technique to be effective and efficient [1].
Optimization of financial aid policies. Mathematical programming models are effective tools for generating and evaluating financial aid strategies. Spaulding and Olswang use discriminant analysis to test the efficacy of various aid strategies [33]. Linear programming was used by Sugrue et al in 2006 as an aid decision tool where the goal was to maximize net revenue with budget, average Scholastic Assessment Test (SAT) scores, recruitment pools, and enrollment targets as constraints [37]. In later work, Sugrue again employed a linear programming approach to optimize the quality of the incoming class with estimates of yield rates being derived from previous years’ yield rates [35].
More recent research has incorporated enrollment prediction models with optimization techniques to recommend financial aid strategies. In 2015 Sarafraz et al used a neural network model to predict enrollment and then employed a genetic algorithm to find a scholarship strategy that maximized total enrollment [28]. In 2019 Sugrue used data from the University of Miami to develop a merit-based aid allocation model that predicted enrollment via logistic regression and maximized the quality of the incoming class via a linear programming model [36]. In 2020 Aulck et al tested a group of machine learning tools to predict the enrollment decisions of admitted, domestic nonresident first-time students and then used those results in a genetic algorithm to recommend an optimal disbursement strategy for a domestic non-resident merit scholarship that would maximize enrollment [4].
None of these previous works have considered merit-based award and need-based aid strategies simultaneously as our paper proposes to do. Further, this joint consideration demands the consideration of a what an appropriate optimization objective should be given that the recruitment goals of merit-based awards and need-based aid differ in some regards. Though the joint consideration of merit and need strategies in one optimization problem does complicate the process, a multi-objective approach needs to be researched since these aid strategies compete for the same limited budget resources.
Local-search optimization. Local search is a heuristic method for solving computationally hard problems. A local search algorithm starts with an initial candidate solution and iteratively moves to a neighbor solution in hopes of finding better and better candidate solutions. The algorithm stops when it cannot find a neighbor solution that is better than the current candidate solution. For local search to work, a neighbor relation must be defined so that from an arbitrary candidate solution, a neighbor solution can be generated.
Stochastic hill climbing [20] is a fast local search method because it greedily moves from one candidate solution to a better one. It is similar to a popular method, stochastic gradient descent [19], but it is faster because it does not need to estimate the gradient of the objective function. The main disadvantage of stochastic hill climbing is that it is often stuck in locally optimal solutions.
Two popular methods that can find globally optimal solutions are simulated annealing [21] and genetic algorithms [41]. In a number of applications, genetic algorithms produced slightly better solutions than simulated annealing [30]. Nevertheless, simulated annealing and its variant, simulated quenching [18], seem to suit our technical approach better than genetic algorithm because it is not obvious to us how we can meaningfully apply the genetic algorithm’s crossover operator to allocation strategies.
3. METHODS
3.1 Overview of the problem and challenges
Merit-based awards and need-based aid. At the University, a certain amount of financial award or aid is offered to each applicant based on his or her profile on merit (academic performance) and need. Merit-based award eligibility is calculated based on a combination of standardized test scores (i.e. American College Testing (ACT) and Scholastic Assessment Test (SAT)) and high school GPA. Need-based aid eligibility is determined by expected family contribution from the Free Application for Federal Student Aid (FAFSA) and then adjusted in an ad hoc manner based on items such as cost of attendance and how much federal aid and other merit-based awards are promised to students. A student may receive both merit awards and financial aid. The allocation strategy of merit awards and aid strives to be fair in that two students with the same residency and academic performance profile will receive the same merit offer and two students with the same residency and need profile will receive the same aid offer. These offers are made in a guaranteed fashion in that each admitted applicant will be offered a merit-based award and/or need-based aid so long as requirements are met.
Allocation strategy of awards and aid. In the context of this work, an allocation strategy consists of a merit-based allocation strategy and a need-based allocation strategy. Each allocation strategy consists of (1) a list of buckets into which students are placed, and (2) how much financial award or aid students in each bucket will receive.
An allocation strategy has an important impact on the budget of the University because it affects enrollment in complex ways. Enrollment affects revenue. Revenue affects the number and amounts of awards and aid the University can give to its students. And awards and aid directly affect the applicants’ decision to enroll at the University. Increasing awards and aid can increase enrollment, but may reduce revenue, which in turn limits the University’s ability to increase awards and aid.
Our mission. Our team was tasked with revising the University’s current way of offering merit-based awards and need-based aid. Although the current system is fair, as it should be, the Financial Aid Office has thought that due to multiple reasons the current strategy might not be optimal. We were asked to generate a revised strategy that uniformly impacts the domestic student body in a way that improves multiple, possibly conflicting objectives such as increasing enrollment, increasing revenue, increasing student performance profiles, and making higher education more accessible and affordable.
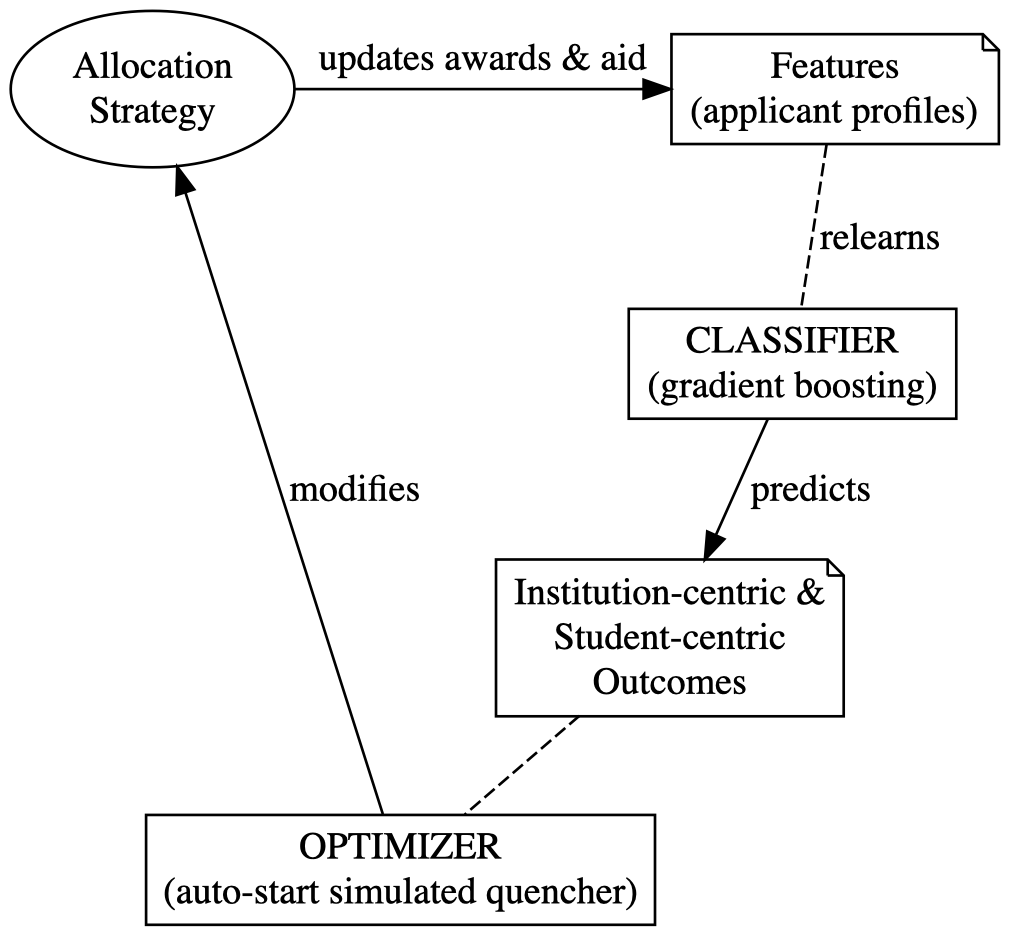
Technical approach. An overview of our approach is depicted in Figure 1. The approach utilizes a feedback loop that continually revises a feature set from which a classifier learns to predict various outcomes. In contrast to the traditional setting where features stay fixed, the features in our model are continually revised in this feedback loop. This is possible due to the fact that the University can change award and aid offer amounts, which is part of the feature set used to predict enrollment, revenue and other outcomes. The feedback loop is an iterative interaction between the classifier, which predicts expected outcomes, and an optimizer, which evaluates the outcomes and suggests a revised strategy with possibly better outcomes. In each iteration of this interaction, depicted in Figure 1, the current allocation strategy dictates offer amounts for awards and aid. This changes the features, which leads the classifier to relearn and re-predict multiple outcomes (e.g. enrollment, revenue, student affordability and accessibility, etc.). This allows the auto-start local-search optimizer to revise and possibly improve the current strategy; and so on and so forth.
3.2 Data Collection and Cleaning
Data for this research is all first-time freshmen (FTF) domestic admitted applicants to the University in the Fall 2020. The data on students is compiled from the University’s admission application, the FAFSA, and the student information system. Only the students who filed a FAFSA (making them eligible for need-based aid) are included resulting 7,564 observations which is approximately 67% of the total number of domestic FTF students for that term. Data from the admission application includes admission test scores, high school GPA, location/residency, and intended major. Data from the FAFSA includes expected family contribution and family income. Data from the student information system includes whether or not the student had previously enrolled at the institution as a dual enrollment student, aid offer amounts for various categories of aid, and an enrollment indicator. Of the 7,564 students 2,340 chose to enroll (approximately 31%). No demographic variables are used in the study so as to avoid bias in recommending aid strategies to the University.
Financial data points are expected full time tuition, merit-based award offers, need-based aid offers, actual and estimated Pell grant offers, and all other aid offers before loans. Estimated Pell grant offers are included as the University will make offers prior to actual Pell amounts being known. These are estimated based on cost of attendance and expected family contribution using the Pell schedules released each year with the assumption that students will enroll full time. Each of the aid offer features enters the predictive model independently and in a total financial aid variable. These offer amounts are not manipulated when generating the predictive model, but are updated during the optimization process.
3.3 Feature Engineering
Prior to building prediction models and optimizations, feature engineering is done using Pandas [23]. Categorical variables are either converted to binary indicators or converted to binary dummies. Continuous distance variables that measure distance from the University and its key market competitors are converted to binary daily and weekly commute variables. We compute an historic 5-year average yield by high school to serve as a proxy of familiarity and/or social network at the University. We convert the major declared on the application into five major group binary indicators: STEM, Fine Arts, Health, Business, and Humanities. The feature engineering results in 95 features from our data sources on which to build our predictions.
Two important features that affect applicants’ decisions to enroll are the promised amounts of merit-based awards and need-based aid. These features are determined by a specific strategy for allocating awards and aid. As indicated in Figure 1, these two features are updated during an optimization process that traverses through the solution space to find an optimal one. As the features are updated, the classification model relearns to update its estimate of enrollment probabilities.
3.4 Modeling enrollment
The data is stored in a matrix where each row represents an applicant’s profile. The first column of is the binary enrollment variable, , where being equal to 1 means applicant enrolled at the University and being equal to 0 means the applicant did not enroll at the University. All other columns of are features that a classifier uses to learn . The goal in modeling enrollment is to assess the viability of using popular classification methods to predict enrollment, and to identify and adopt the best method to assist in the optimization of strategies for allocating merit-based awards and need-based aid.
Classifiers. We investigate the performance of several popular classifiers that can predict enrollment probabilities. These include classification methods based on diverse approaches such as support vector, logistic regression, and k-nearest neighbors. We also consider the ensemble methods of random forest, AdaBoost [29], gradient boosting [13], and a more regularized version of gradient boosting known as extreme gradient boosting [7]. Many of these methods do not strictly predict probabilities of a target variable. Rather, they can provide quantities that can loosely be interpreted as probabilities. For example, in case of ensemble methods, which output quantities based on binary decisions of the base learners, we interpret these quantities as probabilities. We used available implementations of these methods in the scikit-learn [24] and xgboost [7] libraries.
Data scaling. Classification methods such as support vector, logistic regression, and k-nearest neighbors operate on distances between data points. Since distances between different features are not of the same scales, the features need to be standardized first. We employ a popular method of data standardization. For each data point, we subtract from it the mean of the training samples, and then divide that by the standard deviation of the training samples.
Performance metrics. We employ multiple metrics to measure the performance of the classifiers from multiple perspectives. Since the data is imbalanced, a single metric, e.g. accuracy, does not meaningfully reflect different aspects of the performance of a classifier. We consider 3 compound metrics: F-score, balanced accuracy, and AUC (area under the ROC curve), which show different aspects of performance. F-score is a useful metric when we are interested in the ability to predict class-1 samples (applicants who ultimately enroll at the university). It combines two individual measures and is defined as , where precision is the probability that a positive prediction is correctly predicted, and sensitivity is the true positive rate or the probability that class-1 samples are correctly predicted. Balanced accuracy is used when we are equally interested in the ability to predict both class-1 and class-0 samples. It gives equal weights to true positive rates (sensitivity) and true negative rates (specificity). AUC is useful when we are interested in the trade-offs between sensitivity and specificity at various thresholds as it sums up the area under the curve defined by sensitivity (true positive rate) and 1-specificity (false positive rate).
Comparison to baseline. To gauge the performance of each classification method, we compare its performance to that of two baseline methods. The first baseline is a popular method, ZeroR [11], which always predicts the most frequent label in the training set. The second baseline, Stratified, makes predictions based on the distribution of the labels in the training set.
Cross-validation. To determine the performance of each classifier under a metric, we train the classifier using 90% of the data and test it using the other 10% of the data. We experiment with two popular cross-validation methods of partitioning the data randomly into training and testing sets: (1) repeated random subsampling (up to 50 random splits) and (2) k-fold with k=5 and 10. Although the data partitions are randomly generated, in each iteration, we compare the classifiers using the same random partition.
3.5 Optimization of allocation strategies
2: Run Stochastic Hill Climb to find
3:
4: while progress is still being made do
5:
6: for from 1 to do
7: compute_value
8: RandomNeighbor
9: update_strategy
10: fit
11: compute_value -
12: if or with probability then
13:
14: if is better than then
15:
16: end if
17: else
18: roll_back_strategy
19: fit
20: end if
21: end for
22: end while
23: return
Local search optimization. Simulated annealing [21] is inspired from a physical annealing process, in which an initially hot temperature lets the local search explore the solution space more freely, allowing the adoption of neighbor solutions that are not as good as the candidate solution. As the search goes on, the temperature cools down and the search is more aggressive in finding better solutions. When the temperature is low enough the search essentially becomes a stochastic hill climb. Starting at a high initial temperature, the annealing is known to be able to escape locally optimal solutions and reach a globally optimal solution eventually.
We adopt a modified version of simulated quenching [18], which is a variant of simulated annealing. It is faster than simulated annealing because it cools temperatures faster. It is shown that in practice simulated quenching was as good as simulated annealing [18].
While Figure 1 provides a high-level description of each iteration of the optimization, Algorithm 1 provides a more detailed description of how the optimization utilizes simulated quenching to find optimal strategies for allocating merit-based awards and need-based aid. The algorithm takes as input an initial allocation strategy (), which is an estimate from the university’s current strategy; a classifier , which learns from historical or updated features to predict enrollment probabilities; an interface to dataset, which can updates features based on a new strategy or rollbacks previous features based on a previous strategy; and , which dictate how fast the temperature schedule is decreased and how long the temperature is kept constant, in each quenching step.
The simulated quenching process aims to improve upon the initial strategy, , by moving from one neighboring strategy to the next. A better neighboring strategy replaces the current one. Additionally, a worse neighboring strategy can also replace the current one with a certain probability (lines 12-13, Algorithm 1), which is determined by the current temperature and how much worse the neighbor is. At a higher temperature , a worse neighboring strategy can replace the current one in hopes of getting to an eventual better optimum.
Auto-start simulated quenching To explore the search space liberally at the start of the search, the initial temperature needs to be sufficiently high. This initial temperature is, however, problem dependent. As such, users generally have to experiment with different values to find an appropriate one. We employ a stochastic hill climber to derive an initial temperature to start the simulated quenching process without requiring users to initiate the search by specifying an initial temperature (lines 2-3 in Algorithm 1). We set the initial temperature to , where is the difference between the worst strategy and the best strategy (local optimum) that the stochastic hill climber finds. At this initial temperature, the largest backward move is accepted with probability 0.5. As decreases, this probability decreases and a backward move is less likely allowed. When is small enough, the search effectively turns into a stochastic hill climber.
Solution representation. The local search algorithm navigates through the search space of allocation strategies to find an optimal solution (strategy). An allocation strategy consists of a merit-based award allocation strategy and a need-based aid allocation strategy. Each consists of (1) a list of buckets into which students are placed and (2) how much money students in each bucket will receive. Buckets and amounts must be increasing. This means a higher achievement results in higher merit-based amounts, and higher need results in higher need-based amounts. As an example, consider this allocation strategy:
- Achievement buckets: [0, 0.25, 0.50, 0.75, 1]
- Merit amounts: [$0, $2000, $6000, $10000]
- Need buckets: [$0, $500, $5000, $10000, $20000, $40000]
- Need amounts: [$0, $1000, $1500, $2500, $3000]
If an applicant’s achievement index (or need index) falls between bucket[] and bucket[], then the applicant receives amounts[]. For example, if applicant has a merit index of 0.4 and a need index of $15000, then the applicant will receive a merit-based amount of $2000 and a need-based amount of $2500. Collectively, the offered amounts of merit-based awards and need-based aid are captured in the features and of .
Generating neighboring strategies. Local search requires the ability to generate a neighboring strategy from a current candidate strategy. The two main steps of how the function RandomNeighbor (line 8, Algorithm 1) generates a neighboring strategy for a given strategy are as follows:
2: Second, with probability 0.5, either add a small amount to a random amount () in A, or remove a small amount from a random amount in .
RandomNeighbor keeps repeating these steps of adding or removing small amounts from until it finds a neighboring strategy that satisfies the following constraints: (1) remains in an increasing order ; (2) the resulting amount, , must be sufficiently different from its adjacent entries ( and ); and (3) the minimum amount in cannot be too small (in case of a remove) or the maximum amount in cannot be too big (in case of an add).
Updating allocation strategies and relearning. To determine if a neighboring strategy is better or worse than the current one two steps must be taken. First, we have to use this strategy to update the merit-based awards (feature of the dataset ) and need-based aid (feature of the dataset ) for all applicants (rows of ). Second, we have to refit the classifier to this updated dataset. These two steps are shown in lines 9-10 of Algorithm 1.
If ends up replacing , the search moves on to the next iteration. If does not replace , we have to roll back to strategy and refit the classifier to the previous dataset with strategy (lines 18-19, Algorithm 1).
Expected outcomes as a result of an allocation strategy. An allocation of funds to awards and aid affects enrollment, which affects multiple outcomes that the University is interested in. We utilized a classification method, e.g. gradient boosting, to predict enrollment probabilities of applicants. This enables us to compute the expected outcomes that we are interested in. Let be the binary target variable enrollment, and let , where is the probability that applicant enrolls at the University.
The expected outcomes we are interested in include:
- Expected enrollment . Denote the expected enrollment as .
- Expected net revenue , where is net revenue obtained from applicant . , where is the tuition that the applicant pays, and and are the merit-based and need-based amounts offered to this applicant.
- Expected unmet need , where COA, EFC, and Pell are cost of attendance, expected family contribution, federal Pell grant; and and are the University’s merit-based award and need-based aid. A positive unmet need amount is what the applicant is expected to borrow to pay for attending the University. This definition is widely used as a measure affordability.
- Expected accessibility , where iff applicant is offered some financial aid (i.e. ) and has unmet need that exceeds a certain threshold. Note that and are the amounts of merit-based award and need-based aid that applicant is promised. This threshold is set by the University and is believed to represent a level of need that is not surmountable through existing State and Federal programs.
- Expected return on investment . It is the expected revenue divided by the expected total promised amounts of awards and aid.
- Expected achievement , where is the achievement index of applicant and is calculated from a combination of the applicant’s standardized test scores (e.g. SAT or ACT) and high school GPA. Applicant is offered a merit-based award in an amount of based on .
Multi-objective optimization. Algorithm 1 aims to find a strategy that maximizes the weighted sum of expected enrollment (enr), net revenue (rev), unmet need (un), accessibility (acc), return of investment (roi), and achievement (ach) as follows:
where ’s are the weights of the expected outcomes. Implicitly, the allocation strategy is applied to the data , from which the classifier learns to predict enrollment the probability , which is used to compute the expected values on the right hand side of the equation.
Although we do not expect the algorithm to find a strategy that is optimal in each individual objective, an overall optimal value of the function should benefit both the University and the applicants. While higher expected values of enrollment, revenue, and achievement benefit the University, less unmet need and high accessibility benefit applicants. On the one hand, it seems that reducing unmet need for applicants may reduce revenue. On the other hand, making attendance more affordable may actually increase both the expected enrollment, which in turn may increase the expected revenue. In other words, increasing merit-based and need-based amounts may reduce the revenue from each enrolled applicant, but may increase the number of enrolled applicants and, ultimately, the overall revenue.
Users can experiment with ’s to give different weights to different objectives to obtain realistically acceptable trade-offs and improvements among the individual objectives.
Constraints. In constructing this research, certain constraints were determined by the University’s administration. These constraints reflect the administration’s perspective on the competitive environment and internal business processes that will support any proposed strategy. These constraints depend on the award structure under consideration. For merit-based awards, there could be no more than 6 awards with award amounts restricted to a specific range. The need-based aid strategy specification was limited to 4 awards with their own maximum and minimum constraints on aid amounts. It is worth noting that the maximum value for a merit-based award was four times higher than the maximum need-based aid amount. Need-based aid eligibility also had a minimum need index cutoff (). For both allocation strategies there needed to be a minimum difference of $100 between award buckets.
4. RESULTS
| balanced accuracy | F-score | AUC | |
|---|---|---|---|
| Gradient Boosting | 0.91 | 0.88 | 0.96 |
| XGB | 0.91 | 0.88 | 0.96 |
| AdaBoost | 0.88 | 0.84 | 0.95 |
| Random Forest | 0.77 | 0.69 | 0.92 |
| Linear SVC | 0.72 | 0.61 | 0.83 |
| KNN | 0.61 | 0.44 | 0.69 |
| Stratified baseline | 0.50 | 0.30 | 0.50 |
| ZeroR baseline | 0.50 | - | 0.50 |
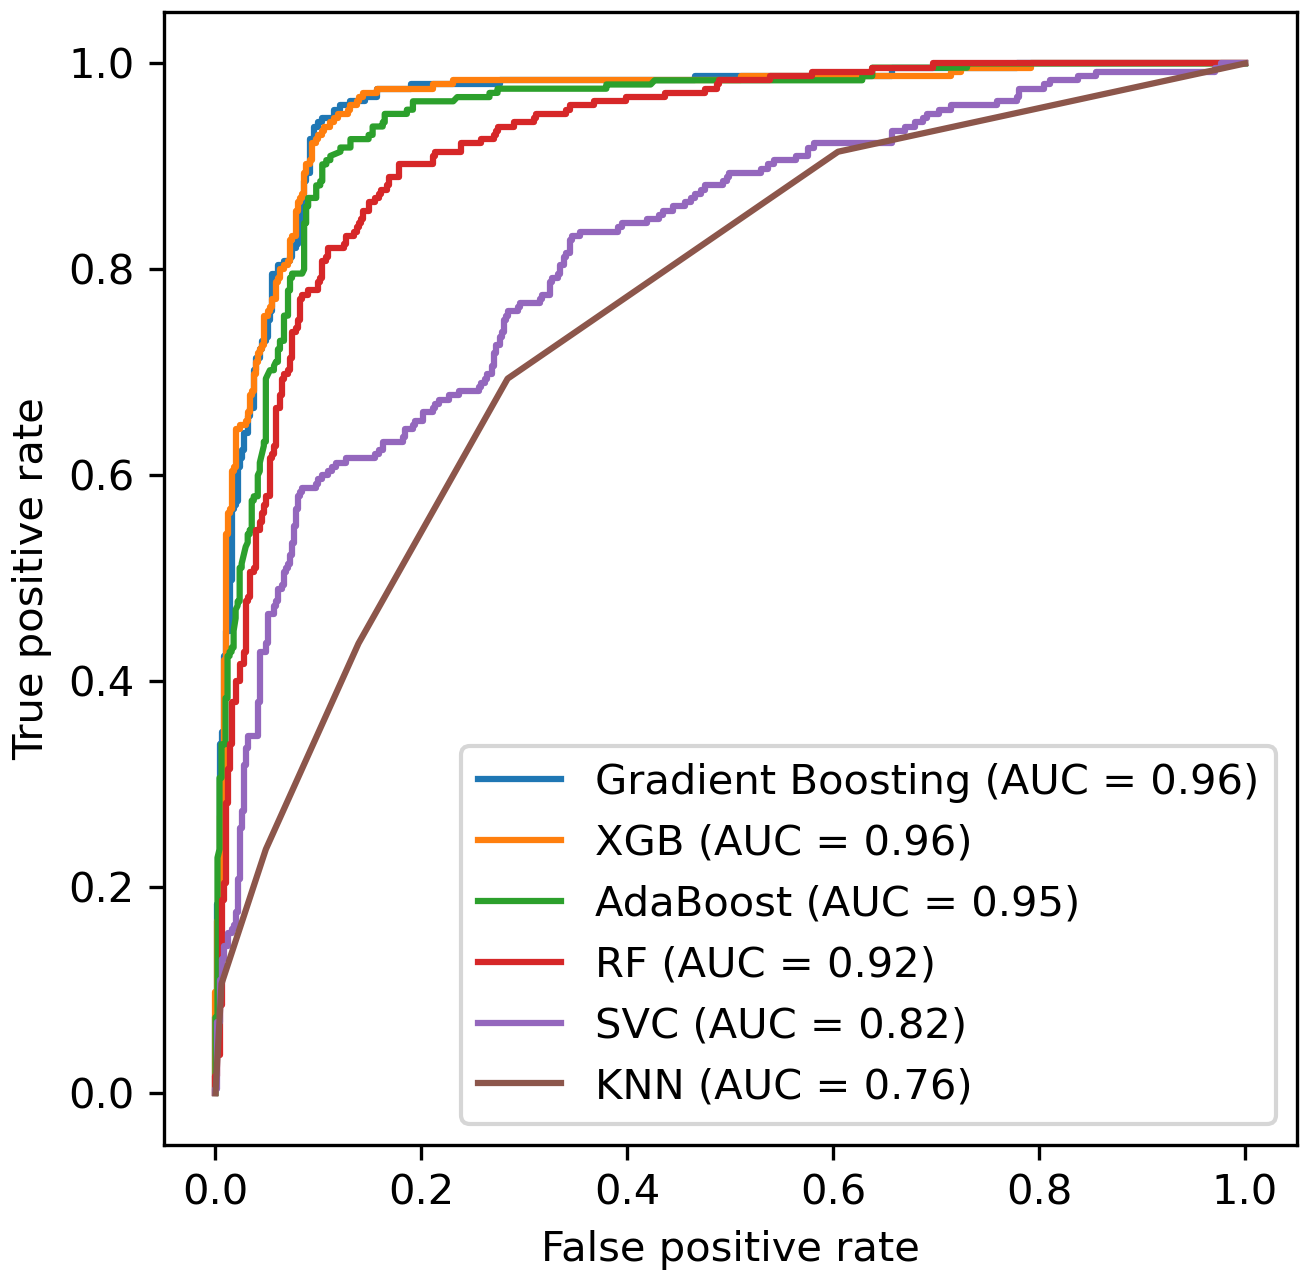
Predicting enrollment. We found gradient boosting [29] was the highest performing classifier and had very high performance in predicting enrollment. This result was obtained by comparing optimized versions of 6 different popular classification approaches, which could make probabilistic predictions. Figure 2 shows the ROC curve of the classifiers in one random partition the data into 90% training and 10% testing sets. The figure shows an excellent trade-off between true positive rate and false positive rate for the two top performers (gradient boosting and extreme gradient boosting).
Table 1 shows the performance of the classifiers averaged across 10 folds of cross validation. In validating the classifiers, we experimented with k-fold cross validation and repeated subsampling at various parameters. We ultimately decided that a 10-fold cross validation was a slightly better choice for our study than the others. All classifiers performed significantly better than the two baselines. Note that given the imbalance of the data, ZeroR did not predict any positive label, resulting in undefined precision and F-score. Gradient Boosting [29] and Extreme Gradient Boosting [7] had the same highest performance across all 3 metrics (balanced accuracy, F-score, and AUC). Gradient Boosting, AdaBoost, and Random Forest were optimized after considering various values of maximum depth and minimum leaf size of the decision-tree base learners.
Given an allocation strategy for awards and aid, we employed a gradient boosting classifier to predict expected outcomes if we were to apply the strategy. To assess this strategy, we compare the expected outcomes to the actual outcomes that were obtained from the original data based on the University’s existing strategy for allocating awards and aid.
| Institution-Centric | Student-Centric | Budget Change
| |||||
|---|---|---|---|---|---|---|---|
| Strategy | Enrollment (%) | Revenue (%) | ROI (%) | Achievement (%) | Accessibility (%) | Unmet need ($) | Total Funding (%) |
| SQ-enr-100,3 | 32.0 | 29.0 | -1.0 | -2.0 | 189.0 | 3320.0 | 48.0 |
| SQ-enr-un-2,0.6,100,3 | 17.0 | -26.0 | -3.0 | -1.0 | 132.0 | -403.0 | 191.0 |
| SQ-enr-un-2,0.6,100,5 | 22.0 | -25.0 | -3.0 | -2.0 | 142.0 | -51.0 | 216.0 |
| SQ-enr-un-rev-1,0.5,2,100,1 | 5.8 | 14.6 | 2.7 | -0.4 | 119.8 | 1247.0 | -28.1 |
| SQ-enr-un-rev-1,0.5,2,100,5 | 8.1 | 16.6 | 2.9 | -0.4 | 125.7 | 1429.7 | -24.5 |
| SQ-enr-un-rev-1,0.6,2,100,1 | 11.8 | 6.5 | -0.8 | -0.7 | 132.4 | 948.7 | 34.9 |
| SQ-enr-un-rev-1,0.6,2,100,2 | 8.3 | 6.9 | -0.2 | -0.5 | 124.0 | 825.0 | 15.5 |
| SQ-enr-un-rev-1,0.6,2,100,3 | 5.7 | 1.7 | -0.6 | -0.4 | 115.8 | 345.7 | 23.2 |
| SQ-enr-un-rev-1,0.6,2,100,4 | 3.5 | -0.2 | -0.5 | -0.3 | 109.8 | 135.2 | 19.5 |
| SQ-enr-un-rev-1,0.6,2,100,5 | 2.0 | -4.8 | -0.4 | -0.2 | 104.3 | -288.6 | 29.9 |
| Institution-Centric Outcomes | Student-Centric Outcomes | Budget Changes
| ||||||
|---|---|---|---|---|---|---|---|---|
| Enrollment | Revenue | ROI | Merit | Accessibility | Unmet need | Total Funding | Awards | Aid |
| 1.3% | 0.1% | -0.2% | -0.1% | 104.7% | -$2.7 | 6.5% | -2.2% | 93.4% |
Defining strategies for allocating funds. A strategy for simulated quenching consists of 3 parameters: (1) the number of steps in decreasing an initial temperature, (2) the number of times to keep the current temperature constant, and (3) the weights (’s) of the expected outcomes in Equation 1. For example, we denote SQ-enr-100,3 as the strategy that optimizes enrollment where temperatures are decreased 100 steps, and each temperature is kept constant for 3 steps. As another example, we denote SQ-enr-un-2,0.6,100,3 as the strategy that optimizes enrollment and unmet need with weights 2 and 0.6, respectively, where temperatures are decreased 100 steps, and each temperature is kept constant for 3 steps.
Table 2 shows the expected outcomes (averaged across 10 random runs) relative to the baseline (actual outcomes) of a few distinguishing strategies. These expected outcomes are from (1) a strategy for optimizing enrollment; (2) two strategies for optimizing enrollment and unmet need; and (3) seven strategies for optimizing enrollment, unmet need, and revenue.
For clarity, expected outcomes are grouped into two categories: institution-centric outcomes and student-centric outcomes. In general, it is difficult to find a strategy that can improve all of the outcomes simultaneously.
Low impact on expected ROI and achievement in optimization strategies. In our evaluation of different strategies, it seems that the impact on expected ROI and merit profiles is relatively small. Percent changes to ROI are reported in column 5 of Table 2. ROI deviates 3% from the baseline in either direction at most, with the majority of deviations being a decrease of 1% or less. Similarly, expected achievement decreases from the baseline by 2% at most, which is equivalent to less than a one point drop in average ACT scores. As such these particular outcomes are not discussed at length in results discussed subsequently.
Optimizing for enrollment alone is good for the University but bad for students. Previous literature focused on optimizing for enrollment alone [4, 28]. In Table 2 this strategy is represented by SQ-enr-100,3. Enrollment and net revenue increase 32% and 29% over actual figures, respectively. These results appear attractive if considered in isolation. However, this return comes at the expense of a 48% increase in the total financial aid budget as well as a $3320 increase in the average amount of unmet need carried by matriculates, indicating attending the University has been made less affordable on average. This increase in expected average unmet need is particularly interesting when compared with the 189% increase in accessibility. Together affordability and accessibility are student-centric outcomes often paired in institutional mission statements. However, there appears to be a trade-off between the two. The extension of more strategic awards and aid to those students with fewer means, may increase their likelihood of attending but it will also raise the average amount of unmet need as the awards and aid are not enough to offset the total cost.
Optimizing for both enrollment and unmet need is good for students but bad for the University. Since optimizing for enrollment alone increases unmet need, we next examine the impact of optimizing for both simultaneously. SQ-enr-un-2,0.6,100,3 and SQ-enr-un-2,0.6,100,5 in Table 2 are two such strategies for this dual optimization specification. In both strategies the University sees improvements in terms of enrollment (17 - 22% increase), accessibility (increase 132-142%), and unmet need (decrease $51 - $403). However, these improvements are costly the University. To achieve this, total financial aid funding is anticipated to rise 191-216%, causing a reduction in net tuition revenue of 25%. This trade-off between affordability and net revenue necessitates a more nuanced optimization specification.
Optimizing for enrollment, unmet need and revenue results in reasonable trade-offs. If the University wishes to strike a balance between institution- and student-centric outcomes, enrollment, unmet need, and revenue must be simultaneously optimized. Seven different strategies for such a specification are seen in the last two sections of Table 2. From the University’s perspective, each of these strategies results in modest increases in enrollment (2% - 11.8%) and has a negligible to modest impact on expected net revenue (-4.8% - 16.6%). Further, each requires significantly less investment in total funding as compared to optimizing for enrollment or enrollment/affordability and, in some cases, could result in cost savings. From the student perspective there is still a marked gain in accessibility of over 100% in all of the strategies. Unmet need, as a measure of affordability, on average still experiences an increase over the actual amount under all but one strategy, but the amount of the increase in unmet need is always below $3000, which is a great improvement over optimizing for enrollment alone.
| Strategy | Awards (%) | Aid (%) | Total Funding (%) |
|---|---|---|---|
| SQ-enr-un-2,0.6,100,5 | 160.0 | 779.0 | 216.0 |
| SQ-enr-un-2,0.6,100,3 | 147.0 | 624.0 | 191.0 |
| SQ-enr-100,3 | 54.0 | 1079.0 | 48.0 |
| SQ-enr-un-rev-1,0.6,2,100,5 | 19.6 | 133.2 | 29.9 |
| SQ-enr-un-rev-1,0.5,2,100,5 | -5.6 | 441.8 | 34.9 |
| SQ-enr-un-rev-1,0.6,2,100,3 | -0.1 | 256.4 | 23.2 |
| SQ-enr-un-rev-1,0.6,2,100,4 | -1.2 | 226.9 | 19.5 |
| SQ-enr-un-rev-1,0.6,2,100,2 | -15.8 | 328.8 | 15.5 |
| SQ-enr-un-rev-1,0.6,2,100,1 | -57.4 | 304.9 | -24.5 |
| SQ-enr-un-rev-1,0.5,2,100,1 | -56.2 | 253.8 | -28.1 |
Few moderate strategic changes can increase accessibility significantly. After we identify a viable strategy, we can narrow it down to a specific solution that maybe adoptable by the University. Adopting a bold strategy that is recommended by an algorithm can be risky. A few reasons that threaten the validity of such a strategy include (1) flawed assumptions made by the model, (2) insufficient amounts of data, and (3) external forces that influence enrollment decisions that are not captured by the data, particularly in a pandemic year. These and other reasons make it hard for administrators to adopt bold strategies even if they might predict large increases in expected outcomes. At times, risk-averse administrators may prefer solutions that make moderate changes, but can move the needle in some significant way.
In addressing this, we identified a viable solution, which came from a random run of the SQ-enr-un-rev-1,0.6,2,100,4 strategy, which optimized for enrollment, affordability and revenue. Table 3 shows the expected outcomes as a result of adopting this solution.
If this solution is adopted, we expect that accessibility can increase more than 100% from baseline, while keeping enrollment, revenue, and most other relevant outcomes nearly identical as the status quo. For this big expected increase in accessibility to happen, the solution calls for an increase of 6.5% in financial aid funding, and a redistribution of merit-based awards (decreasing 2.2%) to need-based aid (increasing 93.4%).
How allocation strategies affect the redistribution of institution funds. As we assess strategies, we find that different levels of aggressiveness in financial aid spending are demanded. Table 4 illustrates this point by taking each strategy from Table 2 and presenting the percent change in expected spend on merit-based awards, need-based aid, and the total financial aid. As we move down through the table, the level of the impact on total financial aid generally decreases.
We find that optimizing for both enrollment and unmet need (SQ-enr-un-2,0.6,100,5 and SQ-enr-un-2,0.6,100,3) is a very aggressive approach as the optimization seeks to enroll as many students as possible with the smallest amount of unmet need. This leads to increases in both the expected merit and need spend with an overall budget increase of approximately 200%. A less aggressive strategy is the optimization of enrollment alone (SQ-enr-100,3). This strategy seeks enrollment by focusing on expanding need-based aid by 1079% and merit-based awards by only 54%. Since the amount of need-based aid was lower to start with this only results in a 48% increase in the total budget.
It is only when revenue is added to the optimization’s objective with enrollment and unmet need that we reach more moderate budget increases and, eventually, cost savings. These strategies recommend a reduction in merit-based awards and a redistribution of funds to need-based aid.
| Strategy | Runtime (sec) | Enrollment (%) |
|---|---|---|
| SHC-enr-100 | 8.6 | 31.4 |
| SQ-enr-100,1 | 16.9 | 31.9 |
| SQ-enr-100,2 | 24.4 | 32.1 |
| SQ-enr-100,3 | 34.1 | 32.2 |
| SQ-enr-100,4 | 43.8 | 32.0 |
| SQ-enr-100,5 | 50.0 | 32.3 |
| Strategy | Runtime (sec) | Enrollment (%) | Unmet Need ($) |
|---|---|---|---|
| SHC-enr-aff-100 | 10.2 | 16.9 | -1031.9 |
| SQ-enr-aff-2,0.5,100,1 | 19.6 | 26.3 | -1193.0 |
| SQ-enr-aff-2,0.5,100,3 | 39.5 | 16.7 | 403.2 |
| SQ-enr-aff-2,0.5,100,5 | 53.1 | 21.9 | 51.4 |
| SQ-enr-aff-2,0.5,100,7 | 66.4 | 21.1 | 205.6 |
| SQ-enr-aff-2,0.5,100,9 | 84.6 | 16.1 | 602.2 |
| SQ-enr-aff-2,0.5,100,11 | 98.5 | 18.0 | 489.6 |
| Strategy | Runtime (sec) | Enrollment (%) | Revenue (%) | Unmet Need ($) |
|---|---|---|---|---|
| SHC-enr-aff-rev-100 | 36.5 | 11.0 | 6.4 | -1091.8 |
| SQ-enr-aff-rev-1,0.6,2,100,1 | 19.3 | 11.8 | 6.5 | -948.7 |
| SQ-enr-aff-rev-1,0.6,2,100,2 | 121.5 | 8.3 | 6.9 | -825.0 |
| SQ-enr-aff-rev-1,0.6,2,100,3 | 160.5 | 5.7 | 1.7 | -345.7 |
| SQ-enr-aff-rev-1,0.6,2,100,4 | 197.6 | 3.5 | -0.2 | -135.2 |
| SQ-enr-aff-rev-1,0.6,2,100,5 | 227.5 | 1.8 | -4.5 | 283.2 |
Comparing simulated quenching and stochastic hill climbing. To contrast the runtime and performance of the two methods, we set both to have 100 iterations. For simulated quenching, temperature is decreased in each iteration, and in each iteration, the temperature is kept constant for another steps. Thus, in addition to an overhead for estimating the initial temperature, the runtime of simulated quenching should be approximately times slower than hill climbing. This can be observed in Table 5 for . Similarly, in terms of runtime, simulated quenching is slower than hill climbing by a constant that is directly proportional to , when both methods were used to optimize for enrollment and affordability (Table 6) and, respectively, for enrollment, affordability, and revenue (Table 7). These tables show the average performance and runtime of the two methods over 10 random runs.
When optimized for enrollment (Table 5), simulated quenching has a higher increase (from 31.9% to 32.3%) than stochastic hill climbing (31.4%). Further, this increase grows with higher values of (from 1 to 11). When optimized for enrollment and affordability (Table 6), performance also increases with higher values of (from 1 to 11). However, the increase in performance seems to be on affordability than on enrollment. When optimized for enrollment, affordability, and revenue (Table 7), affordability increases, while enrollment and revenue decrease with higher values of .
In our application, keeping the same temperature longer for simulated quenching (i.e. with large values of ) increases objective scores, but does not seem to produce solutions with more meaningful impacts on expected outcomes.
5. DISCUSSIONS AND CONCLUSIONS
We addressed multiple outcomes for each selected strategy. Two of those outcomes, achievement and ROI, did not see meaningful changes for the strategies selected. In the case of achievement, we could not improve it significantly over the actual outcomes. Perhaps this was due to the fact that as strategies drive the need-based aid budget upward we are successfully recruiting students from lower-income backgrounds who have traditionally scored lower in standardized tests [5]. Or there could be a limit to our ability to recruit high achieving students due to the University-constrained maximum merit-based award amount. For ROI, we could identify strategies that yielded small amounts of increase. However, those strategies were not as compelling as those we chose to include.
In our application, globally optimal solutions may be impractical. For example, a strategy that yields a 200% increase in enrollment might be mathematically optimal, but may not be accommodated easily. One could impose constraints. In our experimentation with the local search approach, however, having constraints on multiple objectives did not lead to great solutions. It can be very hard for a local search to navigate the search space from an initial random solution to get to an optimal solution that satisfies multiple constraints. Our approach, instead, is to optimize a relatively constraint-free multi-objective function and be optimistic that locally optimal solutions are also practical. Experimenting with different combinations of objectives and ways to control the optimization, we could find strategies that accommodate different levels of risk tolerance.
Thus, this approach provides a path for administrators to weigh risks versus rewards in terms of increasing merit-based awards and need-based aid to support students while maintaining an acceptable level of revenue and enrollment. Table 2 shows the trade-offs in how spending on financial aid funding can affect expected enrollment and revenue. In particular, we were able to identify and recommend a viable solution that requires moderate changes in the budget and yet increases accessibility by more than 100% in Table 3.
Our approach can be adapted to solve other problems that share the same types of interactions between a classifier and an optimizer. In such problems, the classifier expects a set of features that keep evolving based on an external strategy, and the optimizer evaluates expected outcomes predicted by the classifier to recommend a better strategy. For optimization, we employ local search, which is flexible and easily adaptable to different types of problems. For classification, although we employ gradient boosting, any method that is readily available from popular tool kits such as scikit-learn [24] can be used as long as it can make dependable predictions for the problem of interest.
6. REFERENCES
- J. Alhassan and S. Lawal. Using data mining technique for scholarship disbursement. International Journal of Information and Communication Engineering, 9(7):1741–1744, 2015.
- C. M. Antons and E. N. Maltz. Expanding the role of institutional research at small private universities: A case study in enrollment management using data mining. New directions for institutional research, 2006(131):69–81, 2006.
- A. Assalone, P. DeShawn, and B. McElroy. Unexpected hurdles: Unpacking the price tag of college affordability. Policy brief, Southern Education Foundation, Atlanta, GA, 2018.
- L. Aulck, D. Nambi, and J. West. Increasing enrollment by optimizaing scholarship allocations using machine learning and genetic algorithms. Proceedings of The 13th International Conference on Educational Data Mining, 2020.
- L. Barrow and C. E. Rouse. U.s. elementary and secondary schools: Equalizing opportunity or replicating the status quo? the future of children. The Future of children, pages 99–123, 2006.
- L. Chang. Applying data mining to predict college admissions yield: A case study. New Directions for Institutional Research, 131:53–68, 2006.
- T. Chen and C. Guestrin. XGBoost: A scalable tree boosting system. In Proceedings of the 22nd ACM SIGKDD International Conference on Knowledge Discovery and Data Mining, KDD ’16, pages 785–794, New York, NY, USA, 2016. ACM.
- D. J. Davis, L. C. Green-Derry, and B. Jones. The impact of federal financial aid policy upon higher education access. Journal of Educational Administration and History, 45(1):49–57, 2013.
- J. A. Delaney. The role of state policy in promoting college affordability. The ANNALS of the American Academy of Political and Social Science, 655(1):56–78, 2014.
- S. L. DesJardins. An analytic strategy to assist institutional recruitment and marketing efforts. Research in Higher education, 43(5):531–553, 2002.
- C. L. Devasena, T. Sumathi, V. Gomathi, and M. Hemalatha. Effectiveness evaluation of rule based classifiers for the classification of iris data set. Bonfring International Journal of Man Machine Interface, 1(Special Issue Inaugural Special Issue):05–09, 2011.
- N. C. for Education Statistics. Total revenue of public degree-granting postsecondary institutions, by source of revenue and level of institution: Selected years, 2007-08 through 2018-19, 2021. data retrieved from Digest of Education Statistics.
- J. H. Friedman. Greedy function approximation: a gradient boosting machine. Annals of statistics, pages 1189–1232, 2001.
- C. F. Goenner and K. Pauls. A predictive model of inquiry to enrollment. Research in Higher education, 47(8):935–956, 2006.
- D. Hossler. The role of financial aid in enrollment management. New directions for student services, 2000(89):77–90, 2000.
- D. Hossler. Enrollment management & the enrollment industry. College and University, 85(2):2, 2009.
- H. A. Hovey. State spending for higher education in the next decade: The battle to sustain current support. Technical report, National Center for Public Policy and Higher Education, San Jose, CA, 1999.
- L. Ingber. Simulated annealing: Practice versus theory. Mathematical and computer modelling, 18(11):29–57, 1993.
- A. W. Johnson and S. H. Jacobson. On the convergence of generalized hill climbing algorithms. Discrete applied mathematics, 119(1-2):37–57, 2002.
- A. Juels and M. Wattenberg. Stochastic hillclimbing as a baseline method for evaluating genetic algorithms. Advances in Neural Information Processing Systems, 8, 1995.
- S. Kirkpatrick, C. D. Gelatt Jr, and M. P. Vecchi. Optimization by simulated annealing. science, 220(4598):671–680, 1983.
- L. L. Leslie and P. T. Brinkman. Student price response in higher education: The student demand studies. The Journal of Higher Education, 58(2):181–204, 1987.
- W. McKinney et al. Data structures for statistical computing in python. In Proceedings of the 9th Python in Science Conference, volume 445, pages 51–56. Austin, TX, 2010.
- F. Pedregosa, G. Varoquaux, A. Gramfort, V. Michel, B. Thirion, O. Grisel, M. Blondel, P. Prettenhofer, R. Weiss, V. Dubourg, et al. Scikit-learn: Machine learning in python. Journal of machine learning research, 12(Oct):2825–2830, 2011.
- L. W. Perna, M. Asha Cooper, and C. Li. Improving educational opportunities for students who work. Readings on Equal Education, 22:109–160, 2007.
- L. W. Perna and C. Li. College affordability: Implications for college opportunity. NASFAA Journal of Student Financial Aid, 36(1):7–24, 2006.
- A. Rohman, I. Arif, I. Harianti, A. S. Hidayat, W. A. Teniwut, H. Baharun, A. Dja’wa, U. Rahmi, J. R. Saragih, J. Burhanudin, et al. Id3 algorithm approach for giving scholarships. Journal of Physics: Conference Series, 1175(1):012116, 2019.
- Z. Sarafraz, H. Sarafraz, M. Sayeh, and J. Nicklow. Student yield maximization using genetic algorithm on a predictive enrollment neural network model. Procedia Computer Science, 61:341–348, 2015.
- R. E. Schapire. Explaining adaboost. In Empirical inference, pages 37–52. Springer, 2013.
- R. S. Sexton, R. E. Dorsey, and J. D. Johnson. Optimization of neural networks: A comparative analysis of the genetic algorithm and simulated annealing. European Journal of Operational Research, 114(3):589–601, 1999.
- X. Shacklock. From bricks to clicks: The potential of data and analytics in higher education. Higher Education Commission London, 2016.
- F. Siraj and M. A. Abdoulha. Uncovering hidden information within university’s student enrollment data using data mining. In 2009 Third Asia International Conference on Modelling & Simulation, pages 413–418. IEEE, 2009.
- R. Spaulding and S. Olswang. Maximizing enrollment yield through financial aid packaging policies. Journal of Student Financial Aid, 35(1):3, 2005.
- P. Sugrue. A model for predicting enrolment yields. International Journal of Operational Research, 19(1):60–67, 2014.
- P. K. Sugrue. An optimization model for the allocation of university based merit aid. Journal of Student Financial Aid, 40(2):2, 2010.
- P. K. Sugrue. A comprehensive merit aid allocation model. International Journal of Operational Research, 36:467–476, 2019.
- P. K. Sugrue, A. Mehrotra, and P. M. Orehovec. Financial aid management: an optimisation approach. International Journal of Operational Research, 1(3):267–282, 2006.
- D. Trusheim and C. Rylee. Predictive modeling: Linking enrollment and budgeting. Planning for Higher Education, 40(1):12, 2011.
- S. Walczak. Neural network models for a resource allocation problem. IEEE Transactions on Systems, Man, and Cybernetics, Part B (Cybernetics), 28(2):276–284, 1998.
- S. Walczak and T. Sincich. A comparative analysis of regression and neural networks for university admissions. Information Sciences, 119(1-2):1–20, 1999.
- D. Whitley. A genetic algorithm tutorial. Statistics and computing, 4(2):65–85, 1994.
© 2022 Copyright is held by the author(s). This work is distributed under the Creative Commons Attribution-NonCommercial-NoDerivatives 4.0 International (CC BY-NC-ND 4.0) license.