ABSTRACT
As educational technology platforms become more and more commonplace in education, it is critical that these systems work well across a diverse range of student sub-groups. In this study, we estimated the effectiveness of MAP Accelerator; a large-scale, personalized, web-based, mathematics mastery learning platform. Our analysis placed a particular focus on students from historically under-resourced groups. Our sample comprised 181K students in grades 3-8 from 99 school districts across the United States, 52% of whom attended schools where the majority of the students are eligible for free or reduced price lunch (a proxy for high-poverty schools). Using a combination of system logs/platform telemetry data, standardized assessments, and publicly available school/district data, we estimated the causal effect of a year-long supplemental math intervention on students’ standardized mathematics growth outcomes via a quasi-experimental design with controls and a modification of the difference-in-differences framework. Students who used the platform as recommended (30+ min/wk) during the (COVID-19 disrupted) 2020-2021 school year had math growth scores 0.26 standard deviations higher on average than similar students who used the platform for <15 min/week. Further, positive benefits of the platform were observed across all genders, race/ethnic groups, and school poverty levels, but were not as large for districts with greater than 20% English language learners. Further analysis revealed that these students were predominantly Hispanic, and tended to make less progress on fewer skills than their peers given the same amount of practice time. We discuss the implications of these findings, and potential avenues to ensure more equitable outcomes for these students in the future.
Keywords
1. INTRODUCTION
Perhaps the most natural question to ask concerning any educational intervention is “does it work?" Indeed, the What Works Clearinghouse has reviewed over 11,000 studies evaluating the efficacy of various programs and technologies [26]. Overwhelmingly, these studies are concerned with establishing how well the intervention works in general. Of course, the results are inherently limited to the student population in the study, and generalizing the results is not always straightforward. In the U.S., student populations are becoming increasingly diverse[13], with students coming to the classroom with differing skills, backgrounds, and needs. Moreover, there is a growing awareness of educational inequities across the student population coupled with concerns about systemic bias. Even if a study sample is representative of national norms, it is unreasonable to expect that the expected effect would work the same for every subgroup within the sample. Thus, it is critical that we move from asking only “does it work?" to a more specific “for whom does it work?"
In this study, we estimated the effectiveness of Khan Academy’s MAP Accelerator, a large-scale, personalized, web-based, mathematics mastery learning platform. Like many other such studies, we used performance on a standardized test, NWEA MAP GrowthTM, to measure the impact of the intervention. We utilized statistical controls to rule out the influence of confounding variables when possible, and applied difference-in-differences to control for unobserved confounding as well. Critically, we also repeated the analyses across a variety of student sub groups (grade, gender, ethnicity, socioeconomic status, English language proficiency) in order to determine whether the software worked equally well for these groups.
2. BACKGROUND
2.1 NWEA MAP Growth
MAP Growth is a computerized, adaptive, standardized assessment designed to measure and track student mathematics, reading, language usage, and science [18]. For the purposes of this report, we are primarily interested in the mathematics assessment. MAP Growth is designed to be used as an interim assessment, allowing educators to monitor progress and tailor instruction in advance of a summative assessment. The assessment is typically administered three times per year—Fall, Winter, and Spring—with an optional summer administration. During the Fall 2020 administration, the MAP Growth test was completed by nearly 4.4 million students in the United States [14].
MAP Growth is based on the Rasch Model [2], which measures latent student ability on the tested domain. The assessment provides a “RIT" score (short for “Rasch Unit"), which is a linear transform of the estimates from the Rasch model. RIT scores typically range from 100 to 350. Given the adaptive nature of the assessment, the RIT scale is not grade dependent. Instead, a students RIT score improves incrementally across school years, affording the ability to track progress longitudinally. RIT scores can be categorized into different “bands", which describe the expected range for students at that grade level. Scores are also offered for four high level subscales: 1) Geometry, 2) Number & Operations/The Real & Complex Number Systems, 3) Operations & Algebraic Thinking, and 4) Measurement & Data/Statistics & Probability.
2.2 MAP Accelerator
MAP Accelerator is a web-based supplemental math learning tool designed to be used in schools that are also using the MAP Growth assessment. At the beginning of the school year, a student’s subscores from their fall MAP Growth assessment are sent to MAP Accelerator, which then constructs for them a set of supplemental instruction and practice content. For example, if a students RIT score for Geometry was in the 176-188/Grade 3 range, their lessons in Geometry would be aligned to that level.
A full description of MAP Accelerator’s functionality is beyond the scope of this paper. However, the key take away is that students can learn, practice, or quiz on content of their choosing (see Figure 1). Learn refers to study activities such as explanatory videos, worked examples, and articles. Practice refers to solving interactive math practice problems on specific skills[8]. Practice opportunities typically provide hints to students, as well as immediate elaborative feedback[21] after failed attempts. Quizzing is similar to practice, except provides an opportunity for students to self-test in a mixed skill environment.
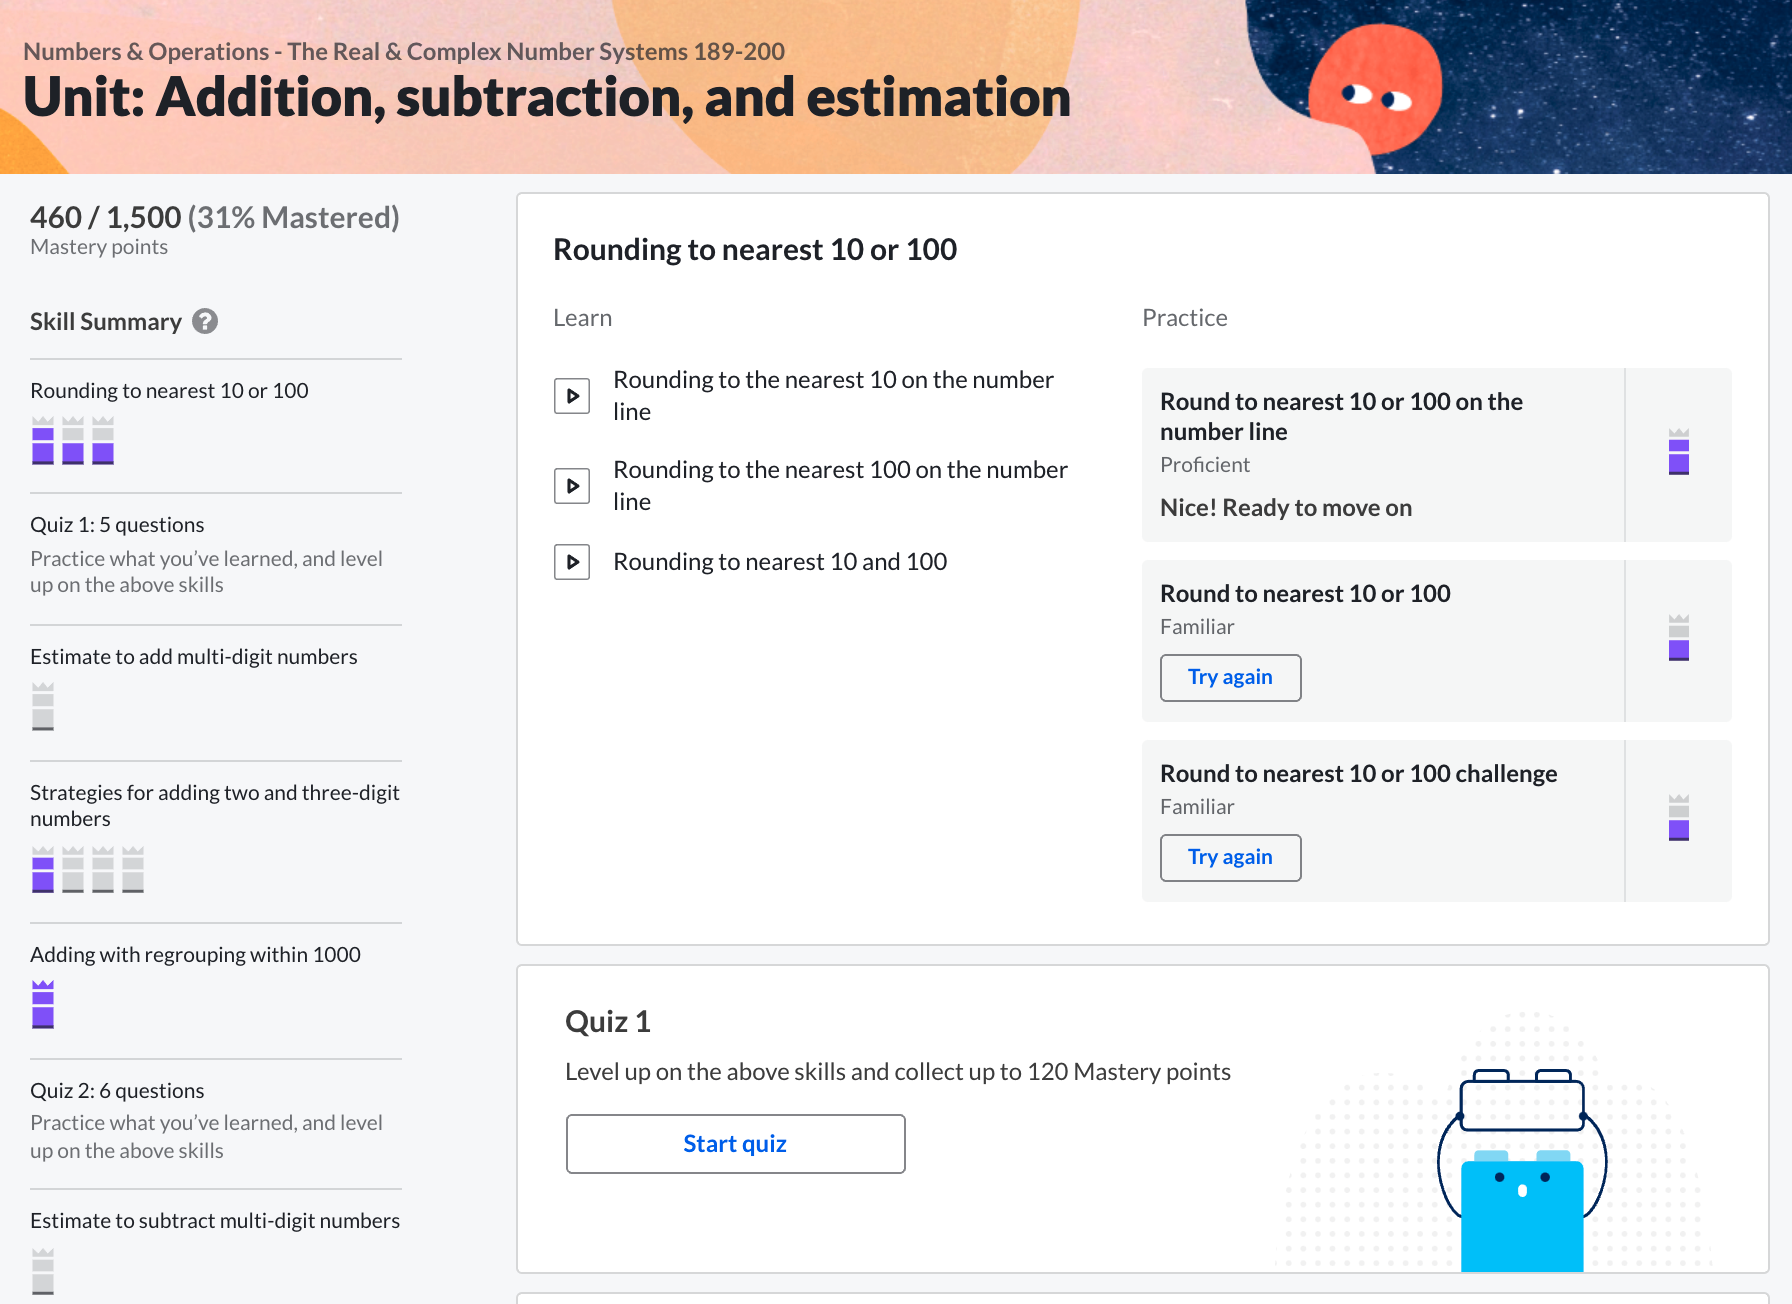
MAP Accelerator also implements concepts from mastery learning [15]. The idea behind mastery learning is that students should work at their own pace to master content before advancing on. MAP Accelerator monitors student performance on practice blocks, quizzes, and mastery challenges and provides feedback on their estimated level of mastery (attempted, familiar, proficient, or mastered). While MAP Accelerator allows students to chose their own path, the mastery feedback allows for easy selection of topics that need the most help.
Importantly, MAP Accelerator is intended to be used as a supplement and not a primary source of instruction. Teachers are encouraged to have their students use MAP Accelerator for at least 30 minutes of focused learning time per week—a dosage level that is meant to be reachable with one dedicated class period per week.
2.3 Impact of COVID-19 Pandemic
MAP Accelerator was first broadly released during the 2020-2021 school year. This was the peak of the COVID-19 pandemic and prior to wide spread availability of vaccines. Nearly two-thirds of U.S. students were enrolled in distance learning formats during the Fall 2020 school year [13]. In addition to academic life, home life was disrupted as well. Many parents were losing their jobs or shifting to at home work. Thus, many students had to complete the school year jockeying for internet access and a quiet place to study. Of course, the degree of disruption would obviously depend on socioeconomic-status of the household and available resources.
Given the extreme disruption to academic and home life, it is not surprising then that student achievement measures would drop. Lewis et al. [17] reported that overall Math RIT scores in Fall of 2020 were considerably lower than pre-pandemic levels. Moreover, the amount of growth from Fall 2020 to Spring 2021 was lower than historical averages. Thus, not only did students start the school year behind where they should have been, they grew at a slower pace than they would have been expected to pre-pandemic.
Lewis et al.[17] also found that the negative effects of the pandemic were not observed equally across all ages or demographic groups. First, younger students (grades 3-5) were more negatively affected than older students (grades 6-8). Second, pandemic related declines were more pronounced in students that attended schools with a high proportion of students on free or reduced lunch. Finally, students from historically under-served groups (e.g., Hispanic/Latino, Black/African American, American Indian/Alaskan Native) were more negatively affected than White and Asian students. In sum, the pandemic appears to have hit vulnerable populations the hardest, and exacerbated pre-existing inequities and achievement gaps.
3. METHODS AND RESULTS
3.1 Data and Sample Summary
In the sections below, we describe some of the data that was available to us, as well as any feature engineering we did. Data from Khan Academy and NWEA MAP Growth tests were privately shared with the researchers for this study. We also made use of publicly available government data from the National Center for Education Statistics (NCES). All data and analyses are limited to U.S. Schools that adopted MAP Accelerator for the 2020-2021 school year, and to students who took both a Fall and Spring administration of the test. A summary table of the data is available in Appendix A.
Several measures were taken to protect the privacy of students and teachers in this study. All data were deidentified, and personally identifiable information was removed and replaced with electronically encrypted hashed fields. Key files to decrypt the hashed fields were not shared with the researchers. Deidentified data was stored on encrypted and password protected servers. Only researchers directly involved with the project were permitted access to the data. Finally, all data was used in accordance with MAP Accelerator Supplemental Terms and Conditions, which was agreed to by participating districts.
3.1.1 School Data
For each student, we were provided with district_name,
school_name (school the student started the year enrolled in),
and math_teacher (unique math teacher identifier).
Using this information, we were able to merge publicly available
school level variables from the NCES. For each school,
we obtained the percent of students reported to be on
Free or Reduced Price Lunch (FRL), a commonly used
indicator of socioeconomic status[25]. From this, we created a
school_frl_level variable by binning schools into one of four
groups: High FRL (>= 75%), Med FRL (> 25%, < 75%), Low
FRL (<=25%), or Unknown. We also obtained the percent of
English Language Learners at the district level (ELL). From
this we created a district_ell_level variable by binning into
four groups: High ELL (>= 20%), Med ELL (>=5, <20%), Low
ELL (<5%), and Unknown.
The key point to note about the school level data is that 52% of the sample came from High FRL schools. The overall sample skews more towards high poverty schools than would be expected from a random sample of US schools (24%)[24].
3.1.2 Demographic Data
For each student, we were provided with their gender (Male,
Female), grade (3 - 8), and ethnic_group (American Indian or
Alaska Native, Asian, Black or African American, Hispanic or
Latino, Native Hawaiian or Other Pacific Islander, White,
Multi-ethnic, Not specified or Other).
A key point to note about the demographics of this sample (see Appendix A) is that the ethnicity breakdown is much different than national averages. In particular, Hispanic or Latino students are just as prevalent in the study sample as White students. Nationally we would expect around 47% White and 27% Hispanic or Latino [13].
3.1.3 MAP Accelerator Usage
For each student we obtained a summary of their total minutes
using MAP Accelerator, filtered to the time period between
when they took their Fall 2020 and Spring 2021 MAP Growth
assessments. Further, only “on task" (i.e., not navigation)
minutes working with math content specifically was used.
Because the duration of the period between tests varied across
students, we then divided the total minutes by the number of
weeks between the two assessments. Lastly, we created a
categorical usage_group variable by binning the total minutes
per week into four groups: No use, < 15 min/wk, 15-30
min/wk, or 30+ min/wk.
Only 5% of students reached the recommended level of 30+ min/wk, and only 9% reached the next highest level of 15-29 min/wk (see Appendix A for full table). We conducted an exploratory analysis to examine how much school level factors predicted an individual students level of usage. We fit a multi-level regression model predicting students’ total learning minutes on MAP Accelerator based on a single population-level intercept (global mean) and random intercepts for teacher, school and district. The random effect variance estimates are shown in Table 1. The intraclass correlation coefficient (ICC) indicated that 57% of the variance in students usage is explained by the environmental factors of teacher, school and district [12].
| Variance | Proportion of variance | |
|---|---|---|
| math_teacher | 38741.12 | 0.22 |
| school_name | 25034.16 | 0.14 |
| district_name | 35668.95 | 0.20 |
| Residual | 74729.04 | 0.43 |
| a ICC = 0.57
| ||
3.1.4 MAP Growth Data
NWEA provided several measures for each student, the critical
ones being: baseline_test_rit_score (Fall 2020 RIT
score), endline_test_rit_score (Spring 2021 RIT score),
subject (Math or reading), and conditional_growth_index
(population-normalized fall to spring gains).
The Conditional Growth Index (CGI) will be our primary outcome variable of interest, thus it warrants additional explanation. CGI is essentially a z-score of a students simple Fall to Spring growth relative to all other test takers. However, unlike a standard z-score, which is based on the population mean and standard deviation, the calculation is conditioned on the student’s starting RIT score, grade, and total instructional time between test events. CGI is then interpreted as the standard deviation change in RIT, relative to all other students who also started with the same RIT score (see [23] for more information on CGI calculation). An interesting aspect of CGI in the context of this study is that it utilizes pre-pandemic national norms. This means that CGI contextualizes a students’ observed growth relative to their expected growth prior to the pandemic. Concretely, a CGI of 0 does not mean that the student did not grow, but rather that they grew at a rate that would be expected for a similar student pre-pandemic.
We use CGI over simple growth for several reasons. The first is that it is a standardized metric that is easier to interpret without knowledge of the RIT scale. The fact that it is standardized against pre-pandemic norms also provides added context for interpreting the results for a COVID disrupted school year. The second reason has to do with the unique properties of the RIT scale. In particular, typical growth rates are not consistent across grades[18]. Students in earlier grades tend to gain more from Fall to Spring than students in later grades. Even within a grade, students with higher RIT score may actually be expected to grow less than students with a lower starting RIT score – which is not a typical or intuitive pattern[5]. Moreover, the logic of the difference-in-difference framework hinges on the “parallel trends" assumption [11] which is that the treatment group should be expected to follow the same trend as the untreated group if no treatment had taken place. The fact that expected growth depends on Fall 2020 starting values means that examining only raw scores would likely violate the parallel trends assumption. Standardization with CGI overcomes this issue.
3.2 Design Overview
In general, this study will use a quasi-experimental, pretest-postest nonequivalent groups design with controls. We leverage the natural variations in usage to infer the impact of using MAP Accelerator on gains in CGI, while controlling for covariates. Even with statistical controls, this design has the potential for confounding from unobserved variables. For example, students who received more parental support during the pandemic may have been more likely to succeed academically[10, 3] and more likely to use MAP Accelerator[19]. We account for unobserved confounding by using the logic of Difference-in-differences (DID)[6].
Difference-in-differences is a causal inference technique that compares an outcome measure before and after an intervention against a counterfactual. For example, the impact of a new traffic law could be evaluated by comparing traffic accidents before and after passing of the law both in the state that passed the law and in a neighboring state that did not. The logic is that the counterfactual (i.e., neighboring state) affords the ability to account for any changes in traffic accidents that could be attributable to other factors, such as bad weather. In our case we compare a low usage group (<15 min/wk) to a recommended usage group (30+ min/wk) on test scores before and after the intervention. We take the logic a step further by comparing the DID of two outcome measures, math and reading. Because MAP Accelerator is designed as a math intervention, we expect effects to be observed primarily in math outcomes. However, an unobserved confound such as parental support should also influence reading performance. DID provides a framework for removing the influence of these confounds. Finally, we add one more layer to DID by conducting a similar analysis across demographic subgroups in order to infer the effects within each of those groups.
3.3 Analysis 1
First we modeled conditional_growth_index for both
math and reading using mixed effect regression models.
We used the following fixed effects: usage_group, gender,
ethnic_group, and baseline_test_rit_score. We also
included the following random effects: district_name,
school_name, math_teacher. Math and reading were modeled
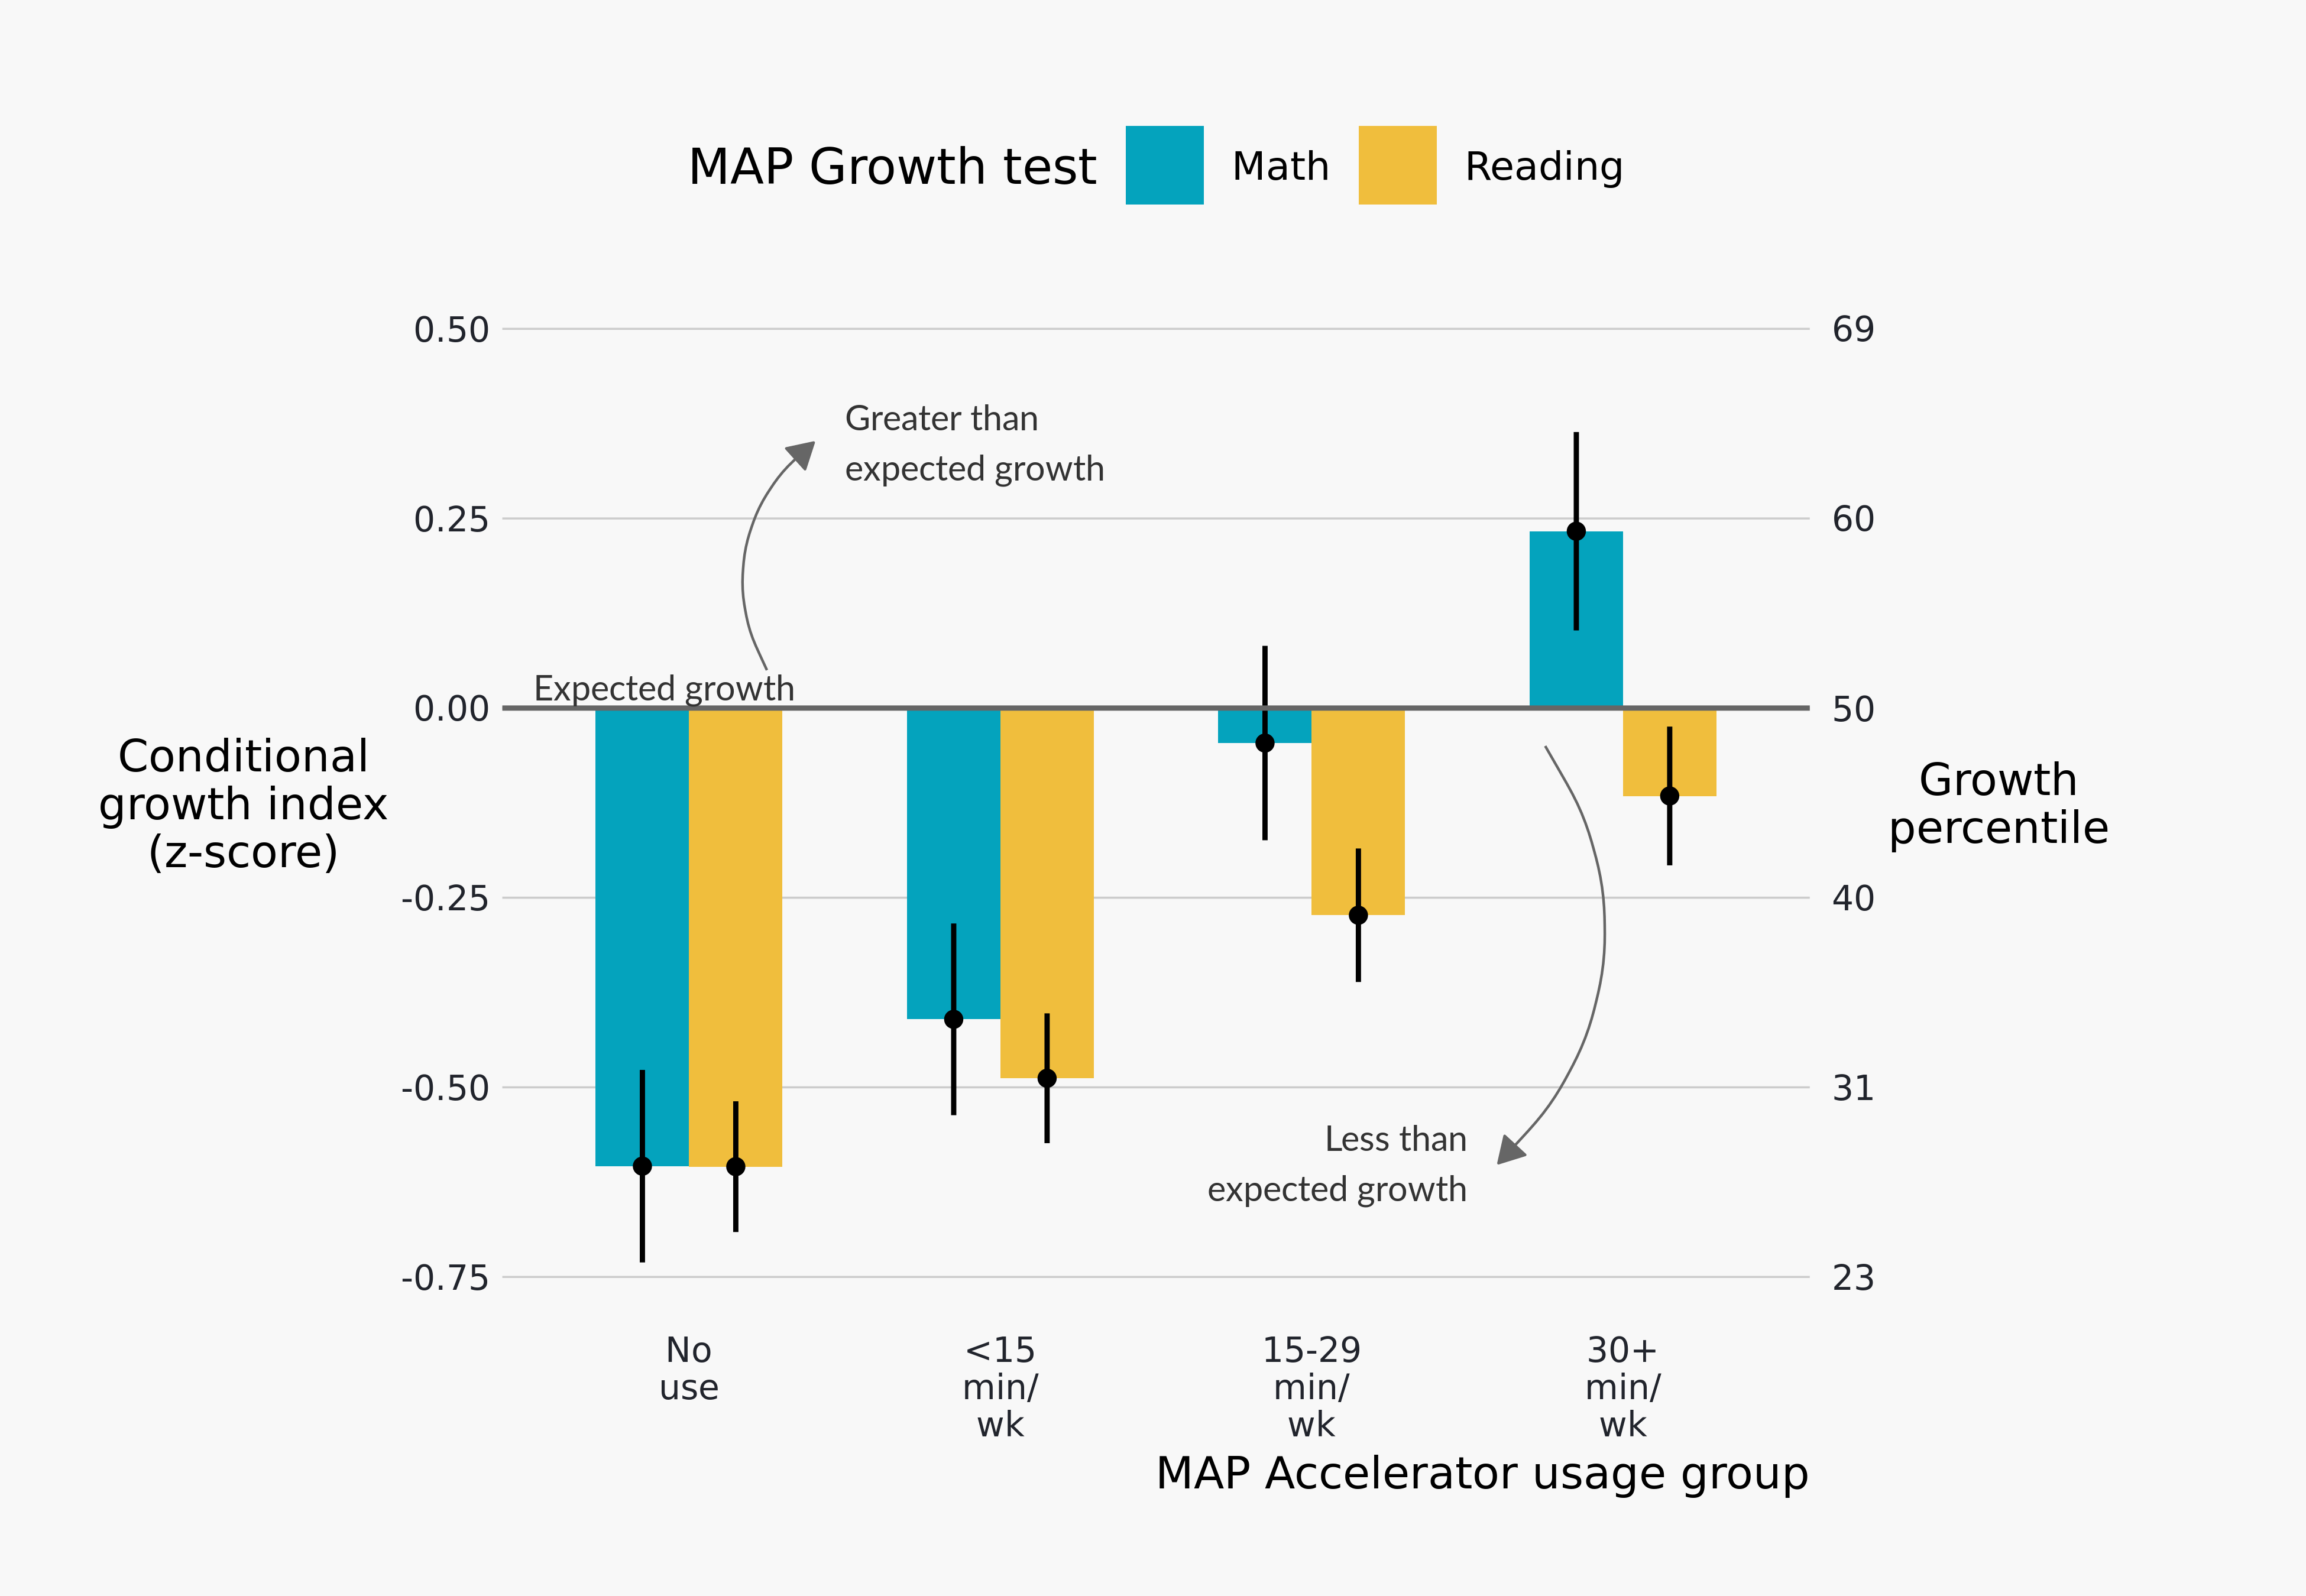
separately. The critical results are shown on Figure 2, which
shows the corrected marginal means of CGI for each of the
usage groups.
As we see on Figure 2, there was a positive relationship between between usage levels of MAP Accelerator and math CGI. Students in the No use group showed the lowest CGI scores, and CGI improved with each usage level. Interestingly, we also see a similar pattern for reading. Given that we did not expect substantive effects of a math supplement on reading performance, this pattern is problematic as it suggests the existence of unobserved confounding in the usage groups. However, we do note that the estimated effects of MAP Accelerator usage were larger for math than for reading. Notably, students in the 30+ min/wk group showed growth that was approximately 0.23 standard deviations higher than expected for math, but slightly below expected levels for reading. Thus, while there may be a degree of confounding, it does not fully explain the relationship between MAP Accelerator usage and performance. Nevertheless, it does make it difficult to determine how much of the true causal effect can be reasonably attributed to MAP Accelerator.
3.4 Analysis 2
In order to account for unobserved confounds, and to estimate
the effects across demographic subgroups, we applied the DID
approach as previously discussed. We fit a mixed effect
regression model using the lme4 package in R[1] and the
specifications on Listing 1. The interaction terms model the
various DID effects. The overall main effect was modeled as a
two-way usage_group * subject interaction. Similarly, the
effects for individual subgroups were modeled as three-way
interactions (e.g., usage_group * subject * grade). The
three-way interactions allow us to estimate the causal effects of
MAP Accelerator across subgroups.
Listing 1: Full model specification for difference-in-differences effects.lmer(conditional_growth_index~
usage_group* subject *
(grade+ gender + ethnic_group +
school_frl_level+
district_ell_level+
math_baseline_test_percentile)+
(1| math_teacher) +
(1| school_name) +
(1| district_name),
data=...,
control= lmerControl(
optimizer="bobyqa",
optCtrl=list(maxfun=2e5)),
REML= FALSE)
After fitting the model, we conducted post-hoc contrasts
to extract the DID effects of interest, using the emmeans
package[16]. We focus on contrasting the two highest usage
groups (30+ min/wk, 15-29 min/wk) against the lowest usage
group (<15 min/wk), and excluded the No use group from
further analysis. On the surface, the No use group seems a
natural reference point, however we noted fairly large differences
in pre-intervention measures between the No use group
and other groups, in some cases exceeding the maximum
standardized mean difference recommended by the What
Works Clearinghouse [27]. Moreover, the total lack of usage
may signal a substantive difference in and of itself. For
example, students in the No use group may have faced
technological barriers, such as limited computer or internet
access, that prevented them from using the tool in the
first place. Note that overall usage in the <15 min/wk
group was very low (Median 1.7 Hours over the entire
year). Thus, we would not expect usage at these levels to
have meaningful benefits on growth over an entire school
year.
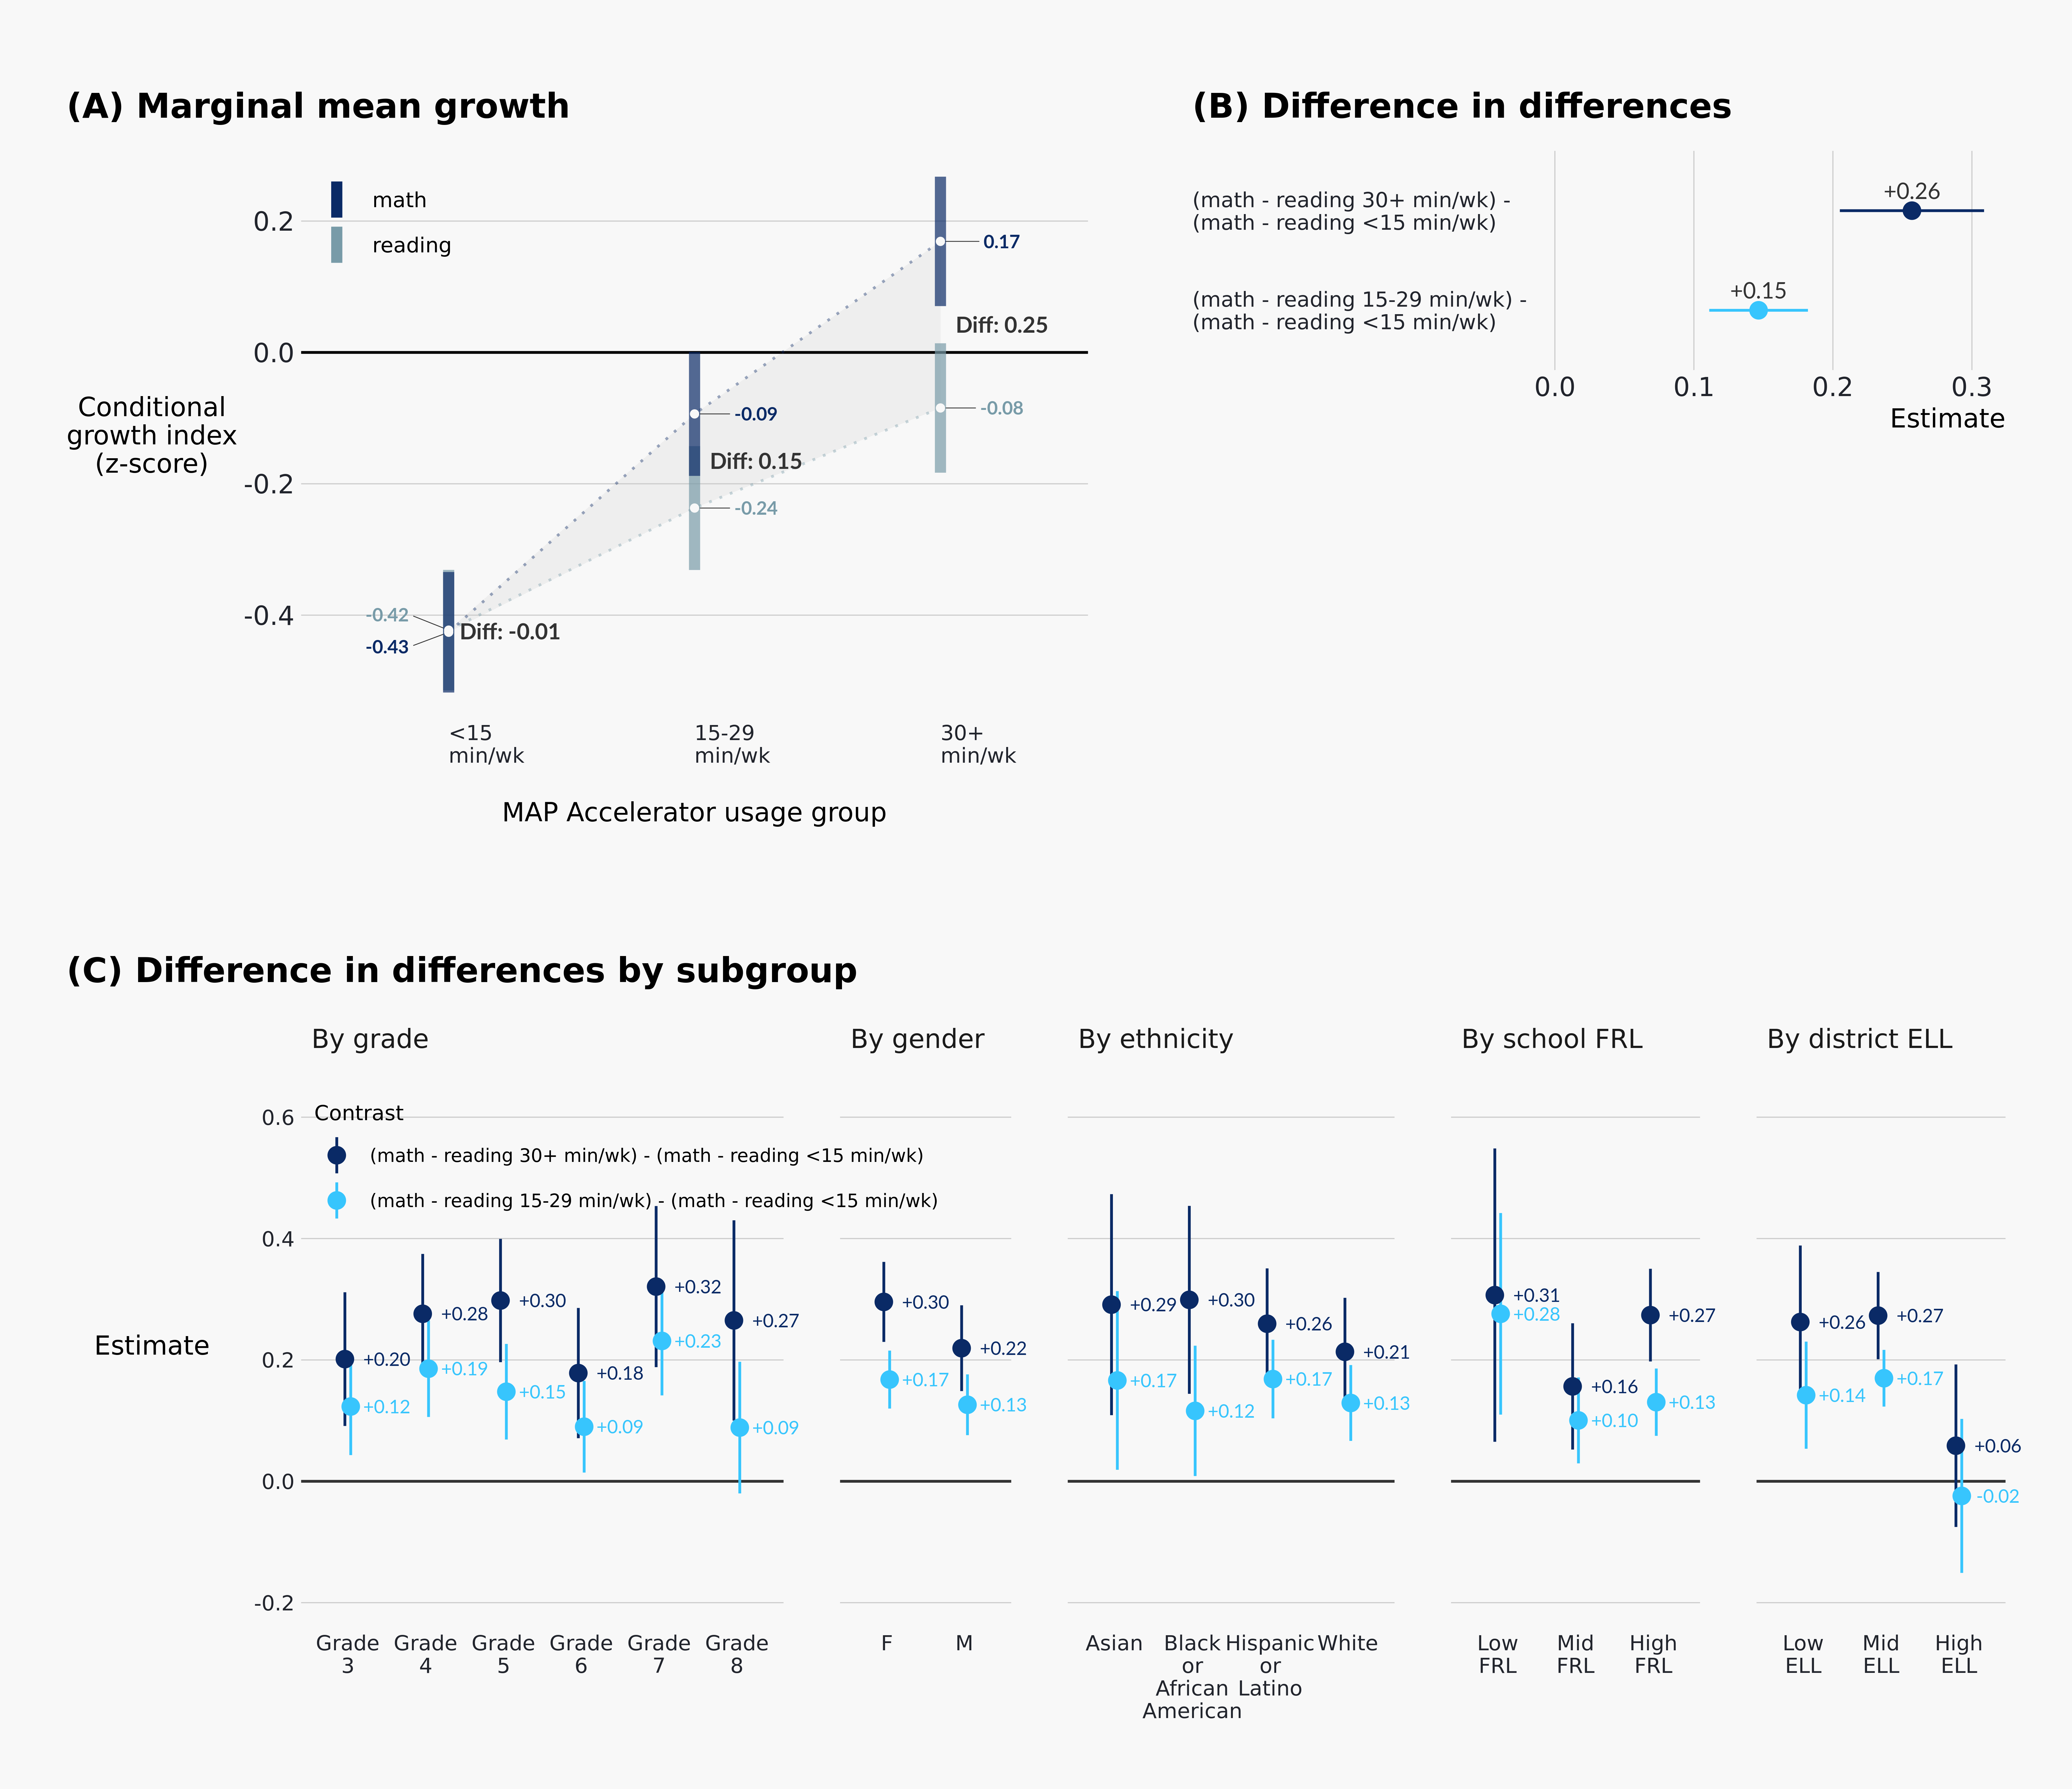
The critical results are shown on Figure 3. We will focus first on the overall effect, as it provides a nice explanation of how the DID are calculated. The panel A of Figure 3 shows the marginal means of CGI for each of the usage groups on both math and reading. Presented this way, we see a clear interaction – CGI improves incrementally with each usage group, but the improvement is larger for math than reading. The main DID is shown on panel B of Figure 3. These estimates are the less-contaminated causal effects of using MAP Accelerator on math CGI. The effect was larger for the 30+ min/wk group than the 15-29 min/wk group (+0.26 vs. +0.15). The direction of this difference is consistent with a causal effect of using MAP Accelerator.
The panel C of Figure 3 shows the DID effects broken down by various subgroups. In general, the pattern of 30+ min/wk students showing larger effects than 15-29 min/wk students held across most of the groups. However, while the magnitude of these gaps did fluctuate, so too do the confidence intervals, ultimately preventing any firm conclusions to be drawn regarding the relative effectiveness of 30+ min/wk vs. 15-29 min/wk within each group. Regardless, both usage levels were consistently positive and greater than 0 across subgroups. In particular, there were no meaningful differences across grades, gender, ethnicity1, or school FRL.
Figure 3 did reveal that students from high ELL districts did not experience the same benefits from their use of MAP Accelerator as their peers. We conducted some post-hoc exploratory analyses to learn more about these students. High ELL districts were demographically distinct from the overall sample, with a higher proportion of Hispanic or Latino students (64%), consistent with national norms[13]. The vast majority of MAP Accelerator usage in High ELL districts was in English (99.7%). Using additional MAP Accelerator data, we computed a rough estimate of learning efficiency by estimating the proportion of skills leveled up over the school year. Students from high ELL districts tended to level up an average of 5.3 (SE = .06) skills per hour, compared to 7.2 (SE = .03) for mid ELL and 8.9 (SE = .07) for low ELL.
4. DISCUSSION
We applied difference-in-differences with controls to estimate the causal effect of MAP Accelerator on NWEA MAP Growth assessment across a wide range of student subgroups. In general, we observed positive effects of MAP Accelerator, with an overall effect size of +0.26 for students who used at the recommended levels of usage. Effect sizes of that magnitude are fairly common in educational technology research [22, 9]. These results provide additional support for mastery learning and the importance of tailoring instruction to students ability levels[15]. In future analysis, we plan to conduct more targeted analyses to determine which specific features of MAP Accelerator resulted in the most benefits.
While the finding that use of MAP Accelerator improved MAP Growth scores is good news, such effects would be less welcomed if it only helped some students. Fortunately, the benefits of MAP Accelerator appeared mostly consistent across grade, ethnicity, and school FRL. These results are important, especially given the context of COVID-19 and known existing equity gaps. As noted earlier, Lewis et al. [17] found that the pandemic more negatively affected the change in MAP Growth scores of younger students, students from high FRL schools, and Black and Hispanic or Latino students. Here we see indication that the pattern was halted, at least for students who used MAP Accelerator at recommended levels. An exception was that students from high ELL schools did not appear to benefit as much from their use of MAP Accelerator as other students.
Why didn’t students from High ELL districts benefit from their use of MAP Accelerator? Prior research on ELL students has shown that learning new content in a language other than their primary language can be a source of cognitive overload [20]. The fact that these students also progressed on MAP Accelerator at a slower pace is consistent with this explanation. Other research has found that programs that allow students to receive instruction in their primary language is more effective relative to comparison groups[4]. Interestingly, students had the option to switch MAP Accelerator to their preferred language, but this was extremely rare. Students may have not been aware of this feature, or were instructed not to use it. Unfortunately, ELLs have long been under-served in U.S. schools, and policies for the instruction of ELL students are not always guided by evidence [7]. Nevertheless, these findings are relevant for other ed tech tools planning implementation in areas with a high concentration of ELLs.
While positive benefits of using MAP Accelerator at recommended levels were observed in the majority of subgroups that we analyzed, it is important to point out that a low proportion of students actually met this threshold. Exploratory analysis found that usage was mostly predicted by District/School/Teacher factors. This suggests that the degree of class level integration was the largest determinant of whether an individual student would reach recommended usage levels. We can only speculate as to why so many classrooms seemed to not use MAP Accelerator, and the context of the pandemic makes the question even more difficult to address. However, low levels of ed tech usage seems to be a common occurrence [28], suggesting that this challenge is not specific to MAP Accelerator.
4.1 Limitations
There are several limitations of this study that must be addressed. First, although we implemented several statistical and methodological controls, this was still an observational study and does not provide the same quality of causal evidence as a randomized control trial. Our DID approach can only control for unobserved confounds that affect general academic performance, not math specific ones. Second, the study took place during a COVID-disrupted school year. Whether these results will hold post-pandemic is uncertain and yet to be seen. Finally, the results from FRL and ELL analysis leveraged school and district level data, rather than the preferred student level data. Just because a student was in a High ELL group does not mean that they themselves were an ELL.
5. ACKNOWLEDGMENTS
We want to thank Robert Berry, Emma Brunskill, Philip Oreopoulos, and Bi Vuong for their guidance and feedback on this report. We also thank the NWEA research team for their helpful suggestions on an earlier version of our main analysis.
6. REFERENCES
- D. Bates, M. Mächler, B. Bolker, and S. Walker. Fitting linear mixed-effects models using lme4. Journal of Statistical Software, 67(1):1–48, 2015.
- T. G. Bond, Z. Yan, and M. Heene. Applying the Rasch Model: Fundamental Measurement in the Human Sciences. Routledge/Taylor & Francis Group, New York, NY, 4th edition, 2021.
- L. Boonk, H. J. M. Gijselaers, H. Ritzen, and S. Brand-Gruwel. A review of the relationship between parental involvement indicators and academic achievement. Educational Research Review, 24:10–30, 2018.
- G. Borsato, F. Genesee, K. Lindholm-Leary, B. Saunders, and D. Christian. Academic Achievement, page 176–222. Cambridge University Press, 2006.
- L. Cronbach and R. Snow. Aptitudes and Instructional Methods: A Handbook for Research on Interactions. New York: Irvington, 1977.
- S. Cunningham. Causal Inference: The Mixtape. Yale University Press, 2021.
- Z. de Araujo, S. A. Roberts, C. Willey, and W. Zahner. English learners in k–12 mathematics education: A review of the literature. Review of Educational Research, 88(6):879–919, 2018.
- K. A. Ericsson, R. T. Krampe, and C. Tesch-Romer. The role of deliberate practice in the acquisition of expert performance. Psychological Review, 100(3):363–406, 1993.
- M. Escueta, V. Quan, A. J. Nickow, and P. Oreopoulos. Education technology: An evidence-based review. Working Paper 23744, National Bureau of Economic Research, 2017. Series: Working Paper Series.
- X. Fan and M. Chen. Parental involvement and students’ academic achievement: A meta-analysis. Educational Psychology Review, 13(1):1–22, 2001.
- A. Fredriksson and G. M. d. Oliveira. Impact evaluation using difference-in-differences. RAUSP Management Journal, 54(4):519–532, 2019.
- J. Hox. Multilevel analysis: Techniques and applications. Routledge/Taylor & Francis Group, 2 edition, 2010.
- V. Irwin, J. Zhang, X. Wang, S. Hein, K. Wang, A. Roberts, C. York, A. Barmer, F. B. Mann, R. Dilig, S. Parker, T. Nachazel, M. Barnett, and S. Purcell. Report on the condition of education 2021. Technical report, U.S. Department of Education, 2021.
- M. Kuhfeld, B. Tarasawa, A. Johnson, E. Ruzek, and K. Lewis. Learning during COVID-19: Initial findings on students’ reading and math achievement and growth. Technical report, NWEA Research, 2020.
- C.-L. C. Kulik, J. A. Kulik, and R. L. Bangert-Drowns. Effectiveness of mastery learning programs: A meta-analysis. Review of Educational Research, 60(2):265–299, 1990.
- R. V. Lenth. emmeans: Estimated Marginal Means, aka Least-Squares Means, 2021. R package version 1.7.0.
- K. Lewis, M. Kuhfeld, E. Ruzek, and A. McEachin. Learning during COVID-19: Reading and math achievement in the 2020-21 school year. page 12, 2021.
- NWEA. MAP growth technical report. Technical report, NWEA, 2019.
- E. A. Patall, H. Cooper, and J. C. Robinson. Parent involvement in homework: A research synthesis. Review of Educational Research, 78(4):1039–1101, 2008.
- S. Roussel, D. Joulia, A. Tricot, and J. Sweller. Learning subject content through a foreign language should not ignore human cognitive architecture: A cognitive load theory approach. Learning and Instruction, 52:69–79, 2017.
- V. J. Shute. Focus on formative feedback. Review of Educational Research, 78(1):153–189, 2008.
- S. Steenbergen-Hu and H. Cooper. A meta-analysis of the effectiveness of intelligent tutoring systems on college students’ academic learning. Journal of Educational Psychology, 106(2):331–347, 2014. ISBN: 1939-2176(Electronic);0022-0663(Print).
- Y. M. Thum and M. Kuhfield. NWEA 2020 MAP growth achievement status and growth norms for students and schools. Technical report, NWEA Research Report. Portland, OR: NWEA, 2020.
- U.S. Department of Education and Institute of Education Sciences and National Center for Education Statistics. Back-to-school statistics. https://nces.ed.gov/FastFacts/index.asp, Accessed = 2022-01-04.
- J. K. Ware. Property value as a proxy of socioeconomic status in education. Education and Urban Society, 51(1):99–119, 2019.
- What Works Clearinghouse. Reviews of individual studies, 2020. https://ies.ed.gov/ncee/wwc/ReviewedStudies, Accessed: 2022-03-08.
- What Works Clearinghouse. What works clearinghouse standards handbook, version 4.1. Technical report, U.S. Department of Education, Institute of Educational Sciences, National Center for Educational Evaluation and Regional Assistance, 2020.
- C. Wood. Most educational software licenses go unused in k-12 districts, 2018. https://edscoop.com/most-educational-software-licenses-arent-used-in-k-12-districts/, Accessed: 2022-03-09.
APPENDIX
A. SUMMARY OF ANALYTIC SAMPLE
| | MAP Accelerator usage group | | |||
| No use | <15 min/wk | 15-29 min/wk | 30+ min/wk | All | |
| Students
| |||||
| n | 74,328 | 82,393 | 16,051 | 8,587 | 181,359 |
| prct | 41% | 45% | 9% | 5% | 100% |
| Locations
| |||||
| Districts | 95 | 98 | 91 | 80 | 99 |
| Schools | 632 | 563 | 472 | 404 | 649 |
| Teachers | 4,334 | 4,382 | 2,545 | 1,625 | 5,839 |
| Math Classes | 7,115 | 7,405 | 3,689 | 2,104 | 10,464 |
| Gender
| |||||
| Male | 52% | 51% | 48% | 47% | 51% |
| Female | 48% | 49% | 52% | 53% | 49% |
| Ethnicity
| |||||
| Am. Indian / Alaska Native | < 1% | < 1% | < 1% | < 1% | < 1% |
| Asian | 4% | 5% | 5% | 6% | 5% |
| Black or African American | 12% | 12% | 10% | 8% | 12% |
| Hispanic or Latino | 33% | 37% | 35% | 43% | 35% |
| Multi-ethnic | 4% | 5% | 5% | 4% | 5% |
| Native Hawaiian / Pac. Islander | < 1% | 1% | < 1% | < 1% | < 1% |
| White | 36% | 33% | 34% | 29% | 34% |
| Not specified / Other | 10% | 7% | 10% | 10% | 9% |
| Grade
| |||||
| Grade 3 | 19% | 15% | 19% | 21% | 17% |
| Grade 4 | 19% | 17% | 17% | 21% | 18% |
| Grade 5 | 18% | 19% | 17% | 20% | 18% |
| Grade 6 | 13% | 18% | 21% | 19% | 17% |
| Grade 7 | 15% | 18% | 14% | 11% | 16% |
| Grade 8 | 16% | 14% | 12% | 8% | 14% |
| School FRL level
| |||||
| High FRL school | 47% | 57% | 51% | 56% | 52% |
| Mid FRL school | 25% | 24% | 31% | 26% | 25% |
| Low FRL school | 11% | 7% | 4% | 3% | 8% |
| Unreported FRL level | 17% | 13% | 14% | 15% | 15% |
| District ELL level
| |||||
| High ELL district | 4% | 7% | 11% | 24% | 7% |
| Mid ELL district | 67% | 70% | 62% | 49% | 67% |
| Low ELL district | 24% | 18% | 21% | 19% | 21% |
| Unreported ELL level | 6% | 5% | 6% | 8% | 5% |
1We did not report results from Am. Indian/ Alaska native due to having too small a sample sizes. Not specified/other and multi-ethnic were also excluded because these labels were not specific enough for the results to provide practical utility.
© 2022 Copyright is held by the author(s). This work is distributed under the Creative Commons Attribution-NonCommercial-NoDerivatives 4.0 International (CC BY-NC-ND 4.0) license.