ABSTRACT
We present a new dataset which captures the sentiment and thoughts of applicants to an industrial IT training course in relation to technology careers and in relation to technology usage. The dataset is live and capturing over 2,000 new applicants’ data each week, from 12 countries, and contains a wide range of diversity information such as gender, ethnicity, and sexuality. The applicants are almost all a similar age, career status and education status, thereby limiting the demographic variables in the dataset.
This dataset has been created in collaboration with a technology consulting firm for use in this PhD research into increasing diversity and equity in technology careers and training. Research into how people from different demographics think about technology careers and technology usage and these topics side-by-side will be facilitated by this dataset. It is intended that relevant findings from the research will be applied at the technology consulting firm to increase equity and diversity.
The data are anonymised during the upload to the dataset and the data provenance is achieved through each upload being controlled, audited and fully repeatable.
It is the intention that a version of this dataset will be made public.
Keywords
INTRODUCTION
The substantial research into the low uptake of technology careers amongst underrepresented groups agrees that the representation of these groups in technology careers remains too low and has changed little despite considerable effort to try to affect change[6, 20, 25]. Use of technology such as internet and smartphones is now widespread across all demographics in society[27]. Research has shown that the diversity of users of technology has evolved, and, in the USA and Europe, we are in the third phase of the Digital Divide[27].
We have observed from working with the graduates who join the technology consultancy’s training programme that they show confidence with and ownership of their technology, whether mobile phone or Personal Computer (PC). This is often at odds with the lack of confidence with which they speak about the prospect and challenge of being active in creating and building technology.
This research will use ML/AI, sentiment analysis and Natural Language Processing (NLP) to understand patterns in the sentiment of different groups in society, including underrepresented demographic groups, to technology use and to technology careers and investigate whether this contributes to the continued absence of diversity in people in technology careers. Our focus will be an application of these ML/AI, sentiment analysis and NLP techniques and tools to the dataset gathered from the recruitment process of a global technology consultancy and enhanced with free text responses. The dataset will be extended by ~100,000 rows each year through the normal volume of applications for the training programme. Alongside analysing data patterns in sentiment across different groups in relation to both technology usage and technology careers, we will also examine the evolution of sentiment amongst graduates who are undertaking the consultancy’s training for a career in technology.
This paper describes the Graduate Technology Applicant Dataset (GTAD) which contains the applicants’ diversity data as well their free text responses to questions related to their thoughts on technology usage and technology careers. The diversity data includes, but is not limited to, gender, ethnicity, age, school type, sexual orientation, and whether the applicant was the first in their family to go to university. The questions have been designed to allow the respondent to write freely about their thoughts at the time of application. Growing at around 2,000 records per week and covering applicants from 12 countries, GTAD also receives around 2,000 responses to the free text questions each week.
This paper describes how the data provenance is maintained and gives some preliminary research findings using statistical methods, sentiment analysis and text analysis tools. The paper outlines a version of GTAD which could be made publicly available in the future.
RQ: Are there differences in perception of technology careers and technology usage for different demographic groups (e.g., women compared to men, ‘pale and male’ respondents compared to everyone else) which can be modelled?
To be able to address this question, the following objectives (Ox) have been defined:
O1: Create GTAD, collecting long text perceptions on technology careers and usage. As the related research shows, there is an absence of such datasets in the literature. In this paper, we mostly focus on objective O1 and how we create this dataset.
O2: Design experiments related to the demographics targeted, using the dataset created in O1. Preliminary results of some initial experiments are also outlined in this paper.
RELATED RESEARCH and WORK
The lack of gender diversity in technology careers has been an active area of research for many years[17, 21, 24], wherein it is agreed that the composition of the technology workforce does not reflect the diversity in society[6, 20]. The findings of Spertus [17] in 1991 in relation to women in IT, such as lack of role models, male-dominated work culture, and lack of workplace flexibility, were repeated in many of the 213 entries in Trauth’s Encyclopedia of Gender and IT[22] in 2006 and are found in Vainionpää’s work [23] in 2021, with much of the literature reporting findings from interviews and surveys of modest sized groups of people from specific, common demographics. Our research adopts a new approach of researching technology career perceptions using analysis of a large, tailored dataset of long text responses from multiple demographic groups.
Van Dijk notes that research into the digital divide doesn’t agree on a model but does agree that the digital divide is changing and his research agrees with Marler and the Office for National Statistics that the uptake and use of technology has diversified considerably and is more widespread [10, 19, 27]. This suggests that perceptions of technology usage have evolved, unlike perceptions of technology careers, which is why we are collecting perceptions on both topics for side-by-side research.
In terms of methodology useful for researching demographic perception diversity in technology careers, there is substantial research into NLP and sentiment analysis to analyse large bodies of data as described in the comprehensive survey by Pang and Lee in 2008[11] and in the scholars’ introduction to the subject by Liu in 2010[8]. Recent relevant research by Yu[4] has included sentiment analysis of attendees of a technology training course. Another recent research used statistics and tools such as Linguistic Inquiry and Word Count (LIWC)[14] to analyse emotional, structural, and cognitive components of long text datasets to comparing gender differences in the way people worry about COVID-19[26]. This research contains results of experiments on data in the Real-World Worry Dataset (RWWD) gathered from 2,500 respondents who wrote their thoughts on COVID-19. They demonstrated differences in the way men and women thought about COVID-19 at that time. The paper concluded that longer statements were more relevant and accurate than short tweets and called for more publicly available high-quality datasets rather than relying on social media datasets. Therefore, our research has created a new, long text dataset, specifically designed for capturing diverse perceptions in relation technology careers and usage and we propose to apply these techniques and tools to that dataset to look for patterns and themes.
CREATION OF THE DATASET
The Need for GTAD
As shown in section 2, a new dataset is necessary, with as many responses as possible, from a wide diversity of applicants commenting on their thoughts about technology careers and technology usage.
Creating a dataset using similar ‘long text’ responses as used in the RWWD but containing questions on technology usage and technology careers could replicate some of this methodology to examine whether there are statistically significant differences in responses – women compared to men, white respondents in relation to people of colour, pale and male respondents compared to everyone else. A dataset with as many diversity data points as possible could lead to multiple options for comparison in the future and can be made publicly available.
GTAD Methodology
Digital Divide research is the main area focus of our literature review in relation to IT usage. More than half the research into the Digital Divide comes from USA and most of the research originates in English-speaking developed and (relatively) rich counties[27]. This correlates with the origination of the majority of the work in relation to diversity in tech careers and, for these reasons the focus of our research is on the UK and USA[15]. There is not, to the best of our knowledge, a publicly available database containing data such as the data in GTAD.
GTAD’s main purpose is to capture free text responses on how the applicants feel about technology usage and technology careers. The data is collected from the technology consultancy’s Applicant Tracking System (ATS) and contains diversity related data such as gender, ethnicity, sexuality, first to go to university, disability. GTAD also contains data related to the application process and the outcomes of that process such as whether the candidate was rejected or withdrew and at what stage of the process.
Data collection started on May 22nd, 2018, from USA, Canada, UK, Germany, Poland, China, Hong Kong, Singapore, Australia, Ireland, South Africa, Luxemburg, Netherlands. Although the focus of this PhD research is UK and USA, the data for all other geographies will also continue to be captured to make GTAD as rich as possible for future research.
The free text questions were added to the system on August 1st, 2021, replicating the long word format from the RWWD paper[26], and replacing “the Corona situation” with our research topics of technology careers and technology usage as shown below:
Question 1 (careers):
“Write in a few sentences how you feel about starting a career in technology/IT at this very moment. This text should express your feelings at this moment.”
Question 2 (usage):
“Write in a few sentences how you feel about using technology/IT (e.g., smartphone/PC/Wi-Fi) at this very moment. This text should express your feelings at this moment.”
On the same ATS screen, alongside the questions, it is made clear that the data is to be used for research into diversity in technology careers, will be anonymised and has no bearing on the candidate’s application.
GTAD is populated with secondary data and is anonymised from the original dataset so has limited relevance in terms of data privacy. Nonetheless, approval was sought and gained from the Executive of the consultancy for the data to be used for research. Approval from the Ethics review board of Durham University for the use of GTAD for research was sought on February 15th, 2022.
It is the intention that a subset of this dataset, less any commercially sensitive information, will be made public for other researchers to use. An early instance of this proposed public dataset has been used for MSc level experiments at Durham University.
GTAD Population
For the GTAD dataset defined below, at least 91% of UK applications are from university graduates. All are at a similar stage in their career and considering a career and training in technology, with 91.1% of the current population who provided their age are aged 18-30. This limited variation in the dataset population could be classified as bias. At the same time, the similarities could ensure that the effect of different diversity characteristics are more pronounced. Combined with the various diversity data fields, GTAD could be a useful research asset when made public.
For the period up to January 1st, 2022, GTAD comprised:
- 565,937 applications from candidates, over 44,000 of which were received since the questions were added to the application form.
- 25,243 long text questions answers, spread 12,242 and 13,001 across usage and careers respectively.
- A corpus of 1,243,578 words.
The growth of GTAD has been constant throughout the period with an average of 2,000 applications per week, of which around 1,000 applicants are currently answering the free text questions, giving 2,000 answers and 100,000 words each week.
This growth rate trajectory to the end of this research (January 2027) suggests that the GTAD population could be substantial with over a million applications, over half a million free text questions answers and a corpus of over 27 million words.
Data Provenance
Via a series of initial data uploads from September 16th, 2021, to December 22nd, 2021, the upload process was tested and refined incrementally. The process is now controlled and repeatable and the scripts and code used to perform the uploads, as well as data manipulation and enrichment scripts, are stored and controlled using source code control tools and processes as prescribed by the technology consultancy’s ISO-27001 compliant[3] IT policies and practices.
It is important that any information related to the status of the application is a final status i.e., at the end of the recruitment process as this relates to outcomes of the process. For example, Did the candidate withdraw? Were they successful in their application? If they were rejected, at what stage was this? The recruitment process lasts a maximum of 4 weeks and so, only data older than 5 weeks was included an initial GTAD upload of February 24th, 2022, covering the period, May 1st, 2018, to January 1st, 2022. Incremental uploads and will be repeated monthly, five weeks in arrears, following the subsequent upload of March 15th, 2022.
Data Enrichment and Optimisation
Some applicants to the training programme apply more than once and so the ATS contains multiple applications from some applicants. Where this is the case, the applicant may answer the questions in different ways for different applications. They may also elect to complete different elements of the diversity data in different applications. So, for example, they might enter no data in their first application. They then provide gender and ethnicity in the second application. In their third and final application they may choose to provide their sexuality and their education information. The uploads of the dataset include logic to ensure that the superset of all diversity related data for that applicant is captured for each application. By capturing every individual application for every applicant, GTAD contains all responses to the technology questions at different times.
Future Enrichment
Predicting Gender and Ethnicity
The primary database (ATS) contains the names of applicants. It is intended to use the first name to enrich the data during the process of the upload and create derived attributes of ethnicity and gender, initial research into which is described later in this paper.
Anonymisation
Although the data is anonymised en route to GTAD by the removal of the identifying fields which are used in the ATS such as surname and date of birth, identifying data does appear in the dataset occasionally. One of the main ways in which this happens is when a contributor uses their name in their free text response. It is intended to use automated tools to anonymise the data during the upload to GTAD.
RESEARCH
Initial Research
Initial experiments were conducted on the data, some of which are summarised here.
Recruitment Process Outcomes Analysis
A comparison of the 10 of the most relevant recruitment process outcomes (from a total of 48 outcomes) such as ‘Rejected After Assessment Day’, ‘Rejected After Video/Phone Interview’ and ‘Invited to Video/Phone Interview’, in the UK revealed statistically significant patterns in the outcomes for different diversity groups. The recruitment process is reviewed and certified annually as fair by a ‘Big Four’ consultancy firm and so these differences in outcomes for specific demographic groups was an unexpected outcome.
Gender Prediction
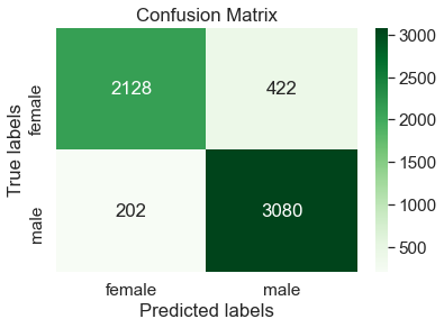
A dataset was created according to the method described here with the added step that the applications’ first name was retained. For the non-NULL values, the genderizeR[28] and Nltk[9] libraries were used to predict gender and the former was found to be most effective. Globally, genderizeR was 86% accurate and for the USA and UK, 89% and 88% respectively (see Table 1. Gender Prediction Performance). Figures 1,2 show the respective confusion matrices for these countries.
Accuracy | Precision | Recall | F_1 Score | |
|---|---|---|---|---|
GenderizeR (USA) | 89% | 0.88 | 0.94 | 0.91 |
GenderizeR (UK) | 88% | 0.86 | 0.93 | 0.90 |
GenderizeR (Global) | 86% | 0.85 | 0.79 | 0.88 |
Nltk (Global) | 67% | 0.75 | 0.69 | 0.70 |

Sentiment Analysis
Sentiment analysis was conducted using the Flair Python library[7, 18], returning a sentiment category (positive, negative, neutral) and a score. This analysis revealed mostly positive sentiment (career: 96.63% and usage: 89.69% positive). There was no neutral sentiment and entries from ‘not disclosed’ applications made up 30% of career and 68.4% of usage responses classed as negative.
K-means Clustering
K-means clustering was performed using the scikit-learn library[13]. The optimal number of clusters was found by the elbow method to be 3. Features resulted in the highest score of 0.878 were location, ethnicity, and stream (i.e., technical training course) chosen by the applicant.
LIWC Analysis
LIWC 2015[14] analysis was performed on the applicants’ long text responses, comparing the results for different groups to the results from the most dominant group in technology careers, white males. Non-parametric Kruskal-Wallis was used to determine differences which were statistically significant, and Cohen’s d was used to determine the magnitude of the differences.
There were differences between other groups and white males for usage, but these were not as pronounced as the differences in the responses related to careers. In the latter, white men focus more on professional aspects, by being more analytical and touching on subjects such as time, money, numbers, power, and work. Whereas other groups tend to share more personal thoughts speaking about feelings, drives, family and showing an emotional tone. White men also use more words per sentence when speaking about careers and are more authentic, speaking about certainty whereas the other groups seem to share personal experience, speaking about affect, affiliation, and rewards.
Top2Vec Analysis
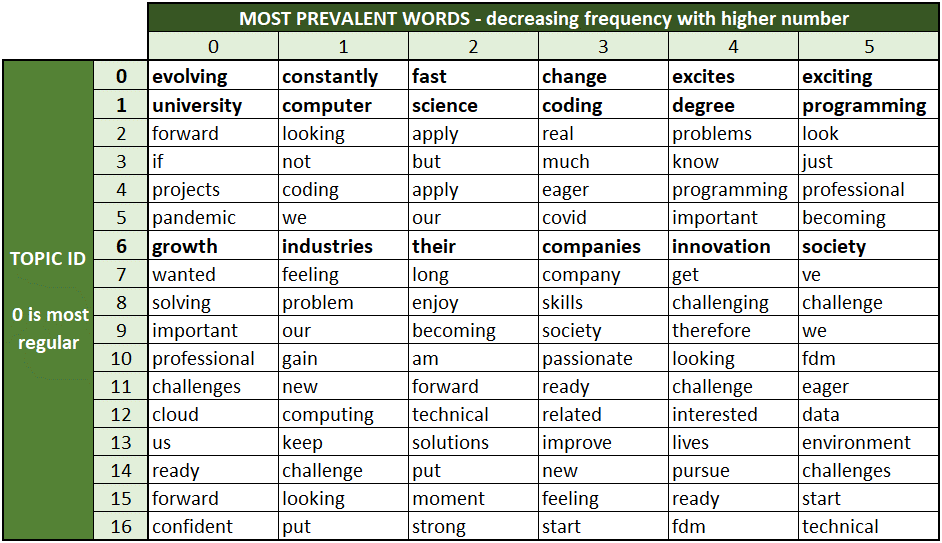
Topic modelling of questionnaire responses was performed, facilitated through Top2Vec[2]. This approach seeks to identify dense clusters of document vectors using hierarchical clustering techniques[5]. Based on an analysis of all responses to question 1 of the questionnaire, 16 distinct topics were identified from the topic modelling approach, shown with the first 5 words in each in Figure 3. These require a manual qualitative analysis when defining a topic label, with the topics demonstrating responses relevant to fast-paced work environments; educational background; and career growth when manually analysed and labelled (topic ids 0, 1, 6 respectively). This demonstrates the initial feasibility of the approach, which may be subsequently investigated further with the aims of identifying more coherent topics from the data.
Future Research
The immediate focus of the research is on the enhancement and enrichment of GTAD as the baseline for the analysis and experimentation. Further analysis of the enhanced dataset plus qualitative analysis, through interview and workshops with the consultancy’s recruiters, will be used to research the clustering of outcomes for different groups in the technology consultancy’s recruitment process. Derived ethnicity attribute via ethnicolr[16] will be further researched as well as anonymization of data using tools such as AnonyMate[1].
Sentiment analysis and textual analysis tools will then be tested against the data for patterns in the text across diverse groups and the LIWC analysis could be tuned and improved using the latest version of the tool. Improvements in the Top2Vec topic modelling performance could researched and analysis of the frequencies of demographic groups within specific topics may help in the identification of attitudes towards questionnaire responses and may aid in future works.
Since the researcher’s relationship with both the dataset and the recruitment processes is not passive, we intend to experiment with causal inference[12] and interventions in the process and data.
CONCLUSION AND OUTLOOK
There was a consistent rate of response to the questions on technology usage and technology careers from applicants to the technology consultancy’s training course, both in terms of numbers of applicants responding and length of responses. This suggests that GTAD will continue to grow, both in size and richness, and could be used for research including research into the PhD hypotheses of the author.
This work is at an early stage and any feedback or ideas on the paper would be highly welcomed. Particularly of interest would be comments on what research and analysis could be performed using the data, and thoughts on the wider distribution of the non-commercially sensitive dataset.
ACKNOWLEDGMENTS
We acknowledge the contribution of Stuart Brown from the IT consultancy’s technology team for his advice on database design and his implementation of the data extraction code for GTAD.
REFERENCES
- ADAMS, A., AILI, E., AIOANEI, D., JONSSON, R., MICKELSSON, L., MIKMEKOVA, D., ROBERTS, F., VALENCIA, J.F., and WECHSLER, R., 2019. AnonyMate: A toolkit for anonymizing unstructured chat data. In Proceedings of the Workshop on NLP and Pseudonymisation, 1-7.
- ANGELOV, D., 2020. Top2vec: Distributed representations of topics. arXiv preprint arXiv:2008.09470. DOI= http://dx.doi.org/https://doi.org/10.48550/arXiv.2008.09470.
- BRENNER, J., 2007. ISO 27001 risk management and compliance. Risk management 54, 1, 24-29.
- BUCK, G.A., CLARK, V.L.P., LESLIE-PELECKY, D., LU, Y., and CERDA-LIZARRAGA, P., 2008. Examining the cognitive processes used by adolescent girls and women scientists in identifying science role models: A feminist approach. Science Education 92, 4, 688-707.
- CAMPELLO, R.J., MOULAVI, D., and SANDER, J., 2013. Density-based clustering based on hierarchical density estimates. In Pacific-Asia conference on knowledge discovery and data mining Springer, 160-172. DOI= http://dx.doi.org/https://doi.org/10.1007/978-3-642-37456-2_14.
- HOLTZBLATT, K., BALAKRISHNAN, A., EFFNER, T., RHODES, E., and TUAN, T., 2016. Beyond the pipeline: addressing diversity in high tech. In Proceedings of the 2016 CHI Conference Extended Abstracts on Human Factors in Computing Systems, 1063-1068. DOI= http://dx.doi.org/https://doi.org/10.1145/2851581.2886422.
- KULA, S., CHORAŚ, M., KOZIK, R., KSIENIEWICZ, P., and WOŹNIAK, M., 2020. Sentiment analysis for fake news detection by means of neural networks. In International Conference on Computational Science Springer, 653-666. DOI= http://dx.doi.org/https://doi.org/10.1007/978-3-030-50423-6_49.
- LIU, B., 2010. Sentiment Analysis and Subjectivity.
- MAMGAIN, S., BALABANTARAY, R.C., and DAS, A.K., 2019. Author profiling: Prediction of gender and language variety from document. In 2019 International Conference on Information Technology (ICIT) IEEE, 473-477. DOI= http://dx.doi.org/https://doi.org/10.1109/ICIT48102.2019.00089.
- MARLER, W., 2018. Mobile phones and inequality: Findings, trends, and future directions. New media & society 20, 9, 3498-3520. DOI= http://dx.doi.org/https://doi.org/10.1177/1461444818765154.
- PANG, B. and LEE, L., 2008. Opinion mining and sentiment analysis. Foundations and Trends® in information retrieval 2, 1–2, 1-135. DOI= http://dx.doi.org/http://dx.doi.org/10.1561/1500000011.
- PEARL, J., 2010. Causal inference. Causality: objectives and assessment, 39-58.
- PEDREGOSA, F., VAROQUAUX, G., GRAMFORT, A., MICHEL, V., THIRION, B., GRISEL, O., BLONDEL, M., PRETTENHOFER, P., WEISS, R., and DUBOURG, V., 2011. Scikit-learn: Machine learning in Python. the Journal of machine Learning research 12, 2825-2830.
- PENNEBAKER, J.W., BOYD, R.L., JORDAN, K., and BLACKBURN, K., 2015. The development and psychometric properties of LIWC2015.
- REDDOCK, R., MCFEE, D., and RADIX, C.A., 2008. Encyclopedia of Gender and Information Technology, edited by Eileen M. Trauth. 2 vols. Hershey, PA: The Idea Group, 2006. 1451 pp. $525.00 cloth. ISBN: 1-59140-815-6. The Information Society 24, 2 (2008/03/04), 128-131. DOI= http://dx.doi.org/10.1080/01972240701884003.
- SOOD, G. and LAOHAPRAPANON, S., 2018. Predicting race and ethnicity from the sequence of characters in a name. arXiv preprint arXiv:1805.02109. DOI= http://dx.doi.org/https://doi.org/10.48550/arXiv.1805.02109.
- SPERTUS, E., 1991. Why are there so few female computer scientists?
- SRIRAM, A., LI, Y., and HADAEGH, A., 2021. Mining Social Media to Understand User Opinions on IoT Security and Privacy. In 2021 IEEE International Conference on Smart Computing (SMARTCOMP) IEEE, 252-257. DOI= http://dx.doi.org/DOI= https://doi.org/10.1007/978-3-030-50423-6_49.
- Office for National Statistics, 2020. Internet Access - households and Individuals. https://www.ons.gov.uk/peoplepopulationandcommunity/householdcharacteristics/homeinternetandsocialmediausage/datasets/internetaccesshouseholdsandindividualsreferencetables
- Office for National Statistics., 2020. Population Characteristic Research Tables. https://www.ons.gov.uk/peoplepopulationandcommunity/populationandmigration/populationestimates/datasets/populationcharacteristicsresearchtables
- TRAUTH, E., 2017. A research agenda for social inclusion in information systems. ACM SIGMIS Database: the DATABASE for Advances in Information Systems 48, 2, 9-20. DOI= http://dx.doi.org/https://doi.org/10.1145/3084179.3084182
- TRAUTH, E.M., 2006. Encyclopedia of gender and information technology. IGI Global.
- VAINIONPÄÄ, F., 2021. GIRLS’ CHOICES OF IT CAREERS A NEXUS ANALYTIC INQUIRY. In FACULTY OF INFORMATION TECHNOLOGY AND ELECTRICAL ENGINEERING UNIVERSITY OF OULU, 148.
- VAINIONPÄÄ, F., KINNULA, M., IIVARI, N., and MOLIN-JUUSTILA, T., 2019. Career Choice and Gendered Perceptions of IT–A Nexus Analytic Inquiry. In International Conference on Information Systems Development Springer, 37-56. DOI= http://dx.doi.org/10.1007/978-3-030-49644-9_3.
- VAINIONPÄÄ, F., KINNULA, M., IIVARI, N., and MOLIN-JUUSTILA, T., 2019. GIRLS'CHOICE-WHY WON'T THEY PICK IT?
- VAN DER VEGT, I. and KLEINBERG, B., 2020. Women worry about family, men about the economy: Gender differences in emotional responses to COVID-19. In International Conference on Social Informatics Springer, 397-409. DOI= http://dx.doi.org/https://doi.org/10.1007/978-3-030-60975-7_29.
- VAN DIJK, J., 2020. The digital divide. John Wiley & Sons.
- WAIS, K., 2016. Gender prediction methods based on first names with genderizeR. R J. 8, 1, 17.
© 2022 Copyright is held by the author(s). This work is distributed under the Creative Commons Attribution-NonCommercial-NoDerivatives 4.0 International (CC BY-NC-ND 4.0) license.