ABSTRACT
Mastery learning – requiring students to achieve proficiency in a topic before advancing – is a well-established and effective teaching method. Digital learning systems support this approach by personalizing content sequences, enabling students to focus on practicing topics they have not yet mastered. To achieve this, digital learning systems use knowledge tracing models, such as Bayesian Knowledge Tracing (BKT), to estimate students' knowledge. The estimation is often converted into a binary indicator reflecting whether mastery has been achieved based on a predefined threshold (e.g. 0.95). Determining optimal thresholds is critical. While prior studies have identified thresholds to prevent over-practice on the same skill, it is equally important to examine how a student’s degree of mastery predicts future learning on other skills, where prior mastery may facilitate acquiring new skills. The current study explores this relationship using data from Rori, an online tutoring system for foundational math skills. Using BKT, we categorized students’ knowledge estimates at the end of each lesson (lesson N) into eight mastery levels and analyzed how the current mastery level is associated with students’ future learning, measured by their performance, early and final knowledge estimates, and learning in the subsequent lesson (lesson N+1). Results indicate that while the widely adopted threshold of 0.95 remains relevant, higher thresholds, such as 0.98, yield additional benefits, including improved performance and learning in subsequent lessons. These findings provide empirical insights for designing adaptive learning technologies that enhance personalization, efficiency, and support for future learning.
Keywords
Mastery Learning
Mastery learning emphasizes that students should achieve a high level of understanding or proficiency in a given topic before moving on to the next [2]. Multiple studies show that mastery learning programs lead to improved learning outcomes [13, 21]. In digital learning, mastery learning is often supported by systems that incorporate adaptations to personalize the sequence of content. These systems first assess students’ knowledge of a skill and then either provide additional practice if mastery has not been achieved or allow students to move to the next topic if mastery is attained. This approach avoids over-practice, an inefficiency in learning that can account for up to 58% of practice if the system is not optimized [8]. It also ensures that students are not moved to a new topic prematurely, preventing negative learning experiences, such as frustration and boredom, which could also result in ineffective learning [5, 10]. As such, digital learning systems increasingly incorporate models that assess student learning, enabling adaptations that support mastery learning.
Mastery Criteria
However, given that knowledge is a latent construct, how do we measure mastery? Simple approaches without assumptions of learning, such as counting the number of consecutive correct or calculating the success rate from last N attempts, have been widely used in large-scale learning platforms to inform mastery learning decisions (e.g. [11, 12]). While these methods provide a practical and efficient solution, each of them suffers from certain limitations [20]. For example, defining mastery by counting the number of consecutive correct answers cannot account for haphazard mistakes (e.g., slips). In these cases, a typo can influence the student learning sequence and cause them to over-practice [19]. Additionally, the success rate from the last N attempts cannot effectively distinguish performance patterns that may be useful for inferring mastery (e.g. treating the correct and incorrect responses of 1,0,1,0,1,0 the same as 0,0,0,1,1,1 where both scenarios have a success rate of 50% yet it’s more reasonable to assume mastery in the latter scenario).
Given these issues, more complex approaches that rely on estimates from knowledge tracing (KT) models have been increasingly used in digital learning systems to determine mastery over the last 25 years [1]. These KT models use students' past performance to infer their knowledge level on a given skill, estimating the likelihood of mastery, and mastery is determined by a predefined threshold [20]. To represent this process numerically, KT models estimate the probability of mastery in the form of a continuous value ranging from 0 to 1; these estimates are subsequently converted to a binary form (0 or 1) using a predefined threshold. Values below the threshold indicate that the student has not yet mastered the skill, whereas values at or above the threshold indicate mastery.
In [9], where Bayesian Knowledge Tracing (BKT) was used to estimate students’ knowledge, the mastery criterion was set to 0.95. This means mastery is assumed when the knowledge estimate (i.e., P(Ln)) exceeds 0.95; otherwise, the student is considered to have not mastered the skill. However, 0.8, 0.9, and unique thresholds for different topics have also been used in the past as the criterion for mastery (e.g., [11, 12, 20, 23]). To identify optimal thresholds, [20] used simulated data to optimize thresholds by minimizing the difference between the moment when the algorithm identified mastery, and the moment when mastery occurred according to the data simulation, focusing on the knowledge estimates of questions with the same skill. This analysis yields unique thresholds for different skills, ranging from 0.9 to 0.97.
While [20] provide insights into optimizing thresholds to optimize the amount of practice on the current skill, this approach does not indicate what amount of practice is optimal for later student success on future skills. Being able to master a skill to a greater degree may facilitate student acquisition of other skills in subsequent learning. Thus, it may be even more valuable to identify thresholds that support future learning, where mastery of one skill facilitates learning of other skills—an approach termed Accelerated Future Learning (AFL) by VanLehn and Chi [14]. According to [14], AFL occurs when prior knowledge increases the rate at which students acquire new skills or knowledge. Specifically, mastering one skill can support success in new learning situations, preparing students for future learning and increasing their chances of success. Therefore, understanding the relationship between students’ knowledge of one skill and subsequent performance on other skills could provide valuable insights into determining the knowledge thresholds that optimally support future learning.
The Current Study
In this study, we collected data from Rori, an online tutoring system designed to teach upper elementary and junior high school students foundational math skills. The platform features micro-lessons, with each micro-lesson focusing on a single mathematical concept (i.e., skill), followed by 10 practice questions to assess mastery of that concept. Within the current platform, mastery learning is not yet implemented. We conducted a series of analyses to examine the relationship between students' knowledge level in micro-lesson N and their performance in the subsequent micro-lesson, N+1 that’s in the same grade level and on the same math topic.
We used Bayesian Knowledge Tracing (BKT) to estimate students' latent knowledge after each question. As BKT iteratively updates the knowledge estimate based on the correctness of each attempt, the estimate from the final question of a micro-lesson was considered the knowledge level for that micro-lesson, which was then grouped into one of eight mastery levels (e.g., lower than 0.3, between 0.3 and 0.5, between 0.5 and 0.7, etc.). Using the mastery level derived from the current micro-lesson (micro-lesson N), we compared students' performance (i.e., percentage of correct responses), knowledge (early and final knowledge estimates), and learning (the difference between initial and final knowledge estimates) in the subsequent micro-lesson (micro-lesson N+1).
Through these analyses, we aim to understand how knowledge level in one lesson relates to future performance, providing insights into where the cut-off point should be in deciding mastery. This study contributes to a deeper understanding of how adaptive learning technologies, such as Rori, can leverage empirical evidence to enhance adaptivity and better support personalized learning.
Methods
Learning Platform
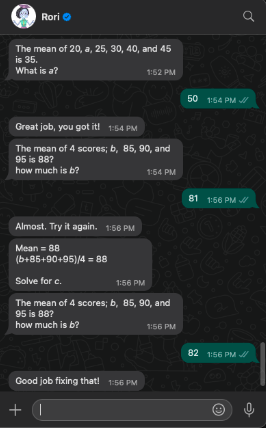
Rori is an AI-powered virtual math tutor designed to help children develop foundational math skills. Rori provides personalized instructions, practice opportunities, and feedback through conversational interactions with a chatbot. Available via WhatsApp, and accessible with a 2G internet connection, it is designed for learners with limited access to quality education. Since launching in November 2022, Rori has been used as a remote math tutor for users interested in learning math and also in classrooms as a supplementary math learning tool for students. Over 63,000 users have interacted with Rori across seven African countries: Ghana, Kenya, Liberia, Nigeria, Rwanda, Sierra Leone, and Tanzania.
Rori structures learning based on what is referred to as “microlessons,” a series of 10 math problems focused on a specific math topic (e.g., Algebra, Fractions) and a corresponding grade level (1 to 9) (see Figure 1). Math problems corresponding to different grade levels are developed using the Global Proficiency Framework [16]. After joining, students can choose the topic and grade level of the math problems they want to practice. Due to students’ different prior knowledge levels and needs, the platform allows them to switch between different topics or grade levels at any time. Students can also ask Rori for hints on how to solve math problems they struggle with.
Data
We extracted chat logs of students completing math problems in Rori from September 2023 to May 2024. The dataset included students making attempts at answering problems in micro-lessons. Each attempt was recorded with a timestamp, a unique student ID, the associated micro-lesson, and an indicator of whether the attempt was correct. For each problem, students can make multiple attempts, and only the first attempt at solving a problem was considered. Given that students may choose to discontinue a micro-lesson (e.g. moving to a different micro-lesson) before completing all ten problems, we only included cases where a student worked on at least eight problems in a micro-lesson, to avoid cases where a student stopped out of a micro-lesson early, which could occur due to disengagement [7], which could reduce the quality of the knowledge inference. In total, the final dataset includes 5,039 micro-lessons from 543 students working on 49,612 problems.
Bayesian Knowledge Tracing
N+1 | |||||
|---|---|---|---|---|---|
Mastery level on micro-lesson N | Number of microlessons | Accuracy (sd) | Early knowledge estimate (sd) | Final knowledge estimate (sd) | Difference between initial and final knowledge estimate (sd) |
1) P(Ln)<0.3 | 783 | 0.53 (0.28) | 0.42 (0.30) | 0.57 (0.41) | 0.22 (0.36) |
2) 0.3<=P(Ln)<0.5 | 148 | 0.59 (0.29) | 0.48 (0.29) | 0.66 (0.40) | 0.26 (0.37) |
3) 0.5<=P(Ln)<0.7 | 151 | 0.63 (0.27) | 0.54 (0.29) | 0.70 (0.40) | 0.28 (0.36) |
4) 0.7<=P(Ln)<0.8 | 139 | 0.65 (0.30) | 0.54 (0.29) | 0.71 (0.40) | 0.29 (0.36) |
5) 0.8<=P(Ln)<0.9 | 176 | 0.64 (0.28) | 0.51 (0.30) | 0.70 (0.40) | 0.28 (0.37) |
6) 0.9<=P(Ln)<0.95 | 129 | 0.66 (0.27) | 0.50 (0.29) | 0.75 (0.38) | 0.35 (0.35) |
7) 0.95<=P(Ln)<0.98 | 229 | 0.69 (0.27) | 0.56 (0.28) | 0.77 (0.37) | 0.33 (0.34) |
8) 0.98<=P(Ln) | 4140 | 0.83 (0.22) | 0.66 (0.26) | 0.91 (0.25) | 0.45 (0.21) |
Bayesian knowledge tracing (BKT) estimates the probability of a student mastering a given skill over time based on their previous performance [9]. Though its performance is lower at predicting future correctness than more contemporary approaches (e.g. [15, 18, 24]), BKT is still widely used in real-world systems (including Rori) due to its interpretability and straightforward estimates of skill mastery that teachers can use. To apply BKT, we estimated the four BKT parameters for each microlesson (i.e., initial knowledge, learning rate, guess, and slip). We used brute force grid search to find the best-fitting estimates of model parameters. This approach has been used in prior studies [4, 22], and its parameter estimations achieve fit comparable to those obtained with alternative methods [17]. In this approach, all possible combinations of four BKT parameters (at a pre-selected grain size, usually 0.01) are evaluated to find the combination that yields the lowest sum of square residual (SSR) between the likelihood of demonstrating a skill and the observed data. To avoid model degeneracy, we constrained Guess (G) and Slip (S) to values between 0.01 and 0.3, initial knowledge P(L0) to values between 0.001 and 0.5, and the learning rate (T) to values between 0.001 and 0.1 [3]. Using the estimated parameters, we then calculated the students’ mastery level of the micro-lesson P(Ln) after each practice attempt. The full description of BKT calculation can be found in [9].
Analysis
Using the P(Ln) values obtained from BKT, we analyzed the relationship between students’ final knowledge level (their last P(Ln)) in the prior micro-lesson (i.e., micro-lesson N) to multiple estimates of their knowledge and performance in the subsequent micro-lesson (i.e., micro-lesson N+1) within the same topic and grade level. When a student shifts topic or grade level between micro-lessons, the link between the prior and subsequent micro-lessons is unclear. Once we established the pairings between micro-lessons N and N+1, we next grouped the final knowledge level (last P(Ln)) of each micro-lesson N into one of eight mastery buckets: 1) P(Ln) < 0.3, 2) 0.3 ≤ P(Ln) < 0.5, 3) 0.5 ≤ P(Ln) < 0.7, 4) 0.7 ≤ P(Ln) < 0.8, 5) 0.8 ≤ P(Ln) < 0.9, 6) 0.9 ≤ P(Ln) < 0.95, 7) 0.95 ≤ P(Ln) < 0.98, and 8) P(Ln) ≥ 0.98. The higher the P(Ln) as well as the mastery level for which it is bucketed, the more likely the student has mastered the skill in the prior lesson. Different cut-offs for mastery were considered in line with the extensive literature that has considered a range of different BKT knowledge values as evidence of mastery [11, 12, 20, 23]. We used buckets rather than a continuous analysis to match the practice of selecting a mastery cut-off.
For each micro-lesson N+1, we computed four performance and knowledge measures, capturing different aspects of the student’s readiness for micro-lesson N+1: 1) the percentage of questions that were answered correctly (i.e. accuracy), 2) an early knowledge estimate (i.e., P(Ln) after the first question -- P(L1)), 3) the final knowledge estimate (i.e., P(Ln) after the last question), and 4) learning, measured by the difference between the initial P(L0) and the final knowledge estimates.
For each performance and knowledge measure, we first computed the average and standard deviation for each mastery level. We then ran a series of multilevel models to evaluate if there were significant differences across mastery levels for each measure. Multilevel modeling is necessary for this data structure to prevent correlations between model errors and grouping variables (i.e., students and micro-lessons), which would violate a key assumption of regression that can cause inflation of type one errors. These models included one-hot encoding indicators of students' mastery categories and random intercepts for students and problems. For each outcome, we ran the multiple models seven times (for seven buckets), using different mastery level categories as the reference in the one-hot encoding in each model. Each model only included mastery categories greater than or equal to the reference category. This allowed for pairwise comparison between all of the mastery categories, without duplicating analyses. To account for potential inflation of the false positive rate due to multiple comparisons, we compared the p-value for each coefficient to adjusted  criteria using the Benjamini-Hochberg procedure [6]. Parametric models were used after reviewing the distributions for lack of hyper-kurtosis, bimodality, or skew. We report the multilevel model results for accuracy, early knowledge estimate, final knowledge estimate, and learning (measured by the difference between the initial and the final knowledge estimates).
Results
Descriptive statistics. Table 1 summarizes students' performance and knowledge estimates in the subsequent (N+1) micro-lessons based on the mastery levels in the prior micro-lessons (N). We observe a bimodal distribution in which most micro-lesson/student pairs N (the column titled “number of micro-lessons” in Table 1) end with students in the lowest (P(Ln) < 0.3) or highest (P(Ln) ≥ 0.98) mastery levels. This distribution indicates that most of the time when students completed a micro-lesson, they either had little knowledge of the skill or had mastered the skill to a significant degree (and may have over-practiced beyond the point where mastery was already established according to many commonly-used mastery criterion, e.g. 0.95).
Mastery level on micro-lesson N | 1) P(Ln)<0.3 | 2) 0.3<=P(Ln)<0.5 | 3) 0.5<=P(Ln)<0.7 | 4) 0.7<=P(Ln)<0.8 | 5) 0.8<=P(Ln)<0.9 | 6) 0.9<=P(Ln)<0.95 | 7) 0.95<=P(Ln)<0.98 |
|---|---|---|---|---|---|---|---|
2) 0.3<=P(Ln)<0.5 | 0.018 p = 0.273, a = 0.03 | - | - | - | - | - | - |
3) 0.5<=P(Ln)<0.7 | 0.033 p = 0.036, a = 0.021 | 0.02 p = 0.329, a = 0.034 | - | - | - | - | - |
4) 0.7<=P(Ln)<0.8 | 0.039 p = 0.016, a = 0.016 | 0.024 p = 0.226, a = 0.027 | <0.001 p = 0.987, a = 0.05 | - | - | - | - |
5) 0.8<=P(Ln)<0.9 | 0.033 p = 0.031, a = 0.018 | 0.023 p = 0.234, a = 0.029 | 0.002 p = 0.932, a = 0.046 | -0.001 p = 0.941, a = 0.048 | - | - | - |
6) 0.9<=P(Ln)<0.95 | 0.052* p = 0.002, a = 0.013 | 0.037 p = 0.075, a = 0.025 | 0.018 p = 0.379, a = 0.038 | 0.019 p = 0.353, a = 0.036 | 0.021 p = 0.289, a = 0.032 | - | - |
7) 0.95<=P(Ln)<0.98 | 0.042* p = 0.002, a = 0.011 | 0.033 p = 0.066, a = 0.023 | 0.013 p = 0.472, a = 0.043 | 0.015 p = 0.398, a = 0.041 | 0.015 p = 0.384, a = 0.039 | -0.008 p = 0.657, a = 0.045 | - |
8) 0.98<=P(Ln) |
0.072* p < 0.001, a = 0.002 | 0.063* p < 0.001, a = 0.004 | 0.043* p = 0.004, a = 0.014 | 0.047* p = 0.002, a = 0.009 | 0.050* p < 0.001, a = 0.005 | 0.032 p = 0.034, a = 0.020 | 0.041* p < 0.001 , a = 0.007 |
*Significant when compared with the Benjamini-Hochberg corrected alpha levels
Accuracy. Table 2 presents the estimated differences in accuracy on the subsequent micro-lesson (N+1) based on the mastery levels in micro-lesson N. Students with higher mastery levels in micro-lesson N performed significantly better than those in the lowest levels of mastery. Specifically, as shown in the results highlighted in green in Table 2, students with mastery at or above 0.98 had significantly higher accuracy in micro-lesson N+1 than those with a probability of mastery below 0.3 (estimate = 0.072; p < 0.001, α = 0.002), between 0.3 and 0.5 (estimate = 0.063; p < 0.001, α = 0.004), 0.5 and 0.7 (estimate = 0.43; p = 0.004, α = 0.014), 0.7 and 0.8 (estimate = 0.047; p = 0.002, α = 0.009), 0.8 and 0.9 (estimate = 0.050; p < 0.001, α = 0.005), and 0.95 and 0.98 (estimate = 0.041; p < 0.001, α = 0.007). The difference between the highest and the third highest (0.9<=P(Ln)<0.95) mastery levels was only marginally significant when using the Benjamini-Hochberg adjusted alpha levels (estimate = 0.032, p = 0.034, α = 0.020).
Additionally, students in the top three mastery levels mastery – 0.9<=P(Ln)<0.95 (estimate = 0.052; p = 0.002, α = 0.013), 0.95<=P(Ln)<0.98 (estimate = 0.042; p = 0.002, α = 0.011), 0.98<=P(Ln) (estimate = 0.072; p < 0.001, α = 0.002) – significantly outperformed those with the bottom mastery.
Early knowledge estimate. Table 3 summarizes the results of the multilevel model that estimates the differences in early knowledge estimates on the subsequent micro-lesson (N+1) based on the mastery levels in micro-lesson N. As shown in the results highlighted in green in Table 3, students with mastery at or above 0.98 had significantly higher early knowledge estimates on the next micro-lesson than those with a probability of mastery below 0.3 (estimate = 0.072; p < 0.001, α =0.002), between 0.3 and 0.5 (estimate = 0.060; p < 0.001, α =0.004), 0.8 and 0.9 (estimate = 0.049; p = 0.004, α = 0.005), 0.9 and 0.95 (estimate = 0.053; p = 0.006, α = 0.009), 0.95 and 0.98 (estimate = 0.040; p = 0.006, α = 0.011).
The difference between the highest master category and the middle categories – 0.5<=P(Ln)<0.7 (estimate = 0.020, p = 0.286, α = 0.029) and 0.7<=P(Ln)<0.8 (estimate = 0.034, p = 0.064, α = 0.016) – were not significant. These nonsignificant results may be due to the low certainty of early BKT estimates.
Final knowledge estimate. Table 4 presents the estimated differences in final knowledge estimates on the subsequent micro-lesson (N+1) based on the mastery levels in micro-lesson N. Similar to previous findings, compared to other mastery levels, students who achieved the highest mastery level in micro-lesson N tended to have higher knowledge estimates by the end of the next micro-lesson (i.e., micro-lesson N+1). Specifically, as shown in the results highlighted in green in Table 4, students in the highest master level had significantly higher final mastery estimates than those with a probability of mastery below 0.3 (estimate = 0.101; p < 0.001, α = 0.002) as well as between 0.3 and 0.5 (estimate = 0.084; p < 0.001, α = 0.009), 0.5 and 0.7 (estimate = 0.052; p = 0.008, α = 0.014), 0.7 and 0.8 (estimate = 0.109; p < 0.001, α = 0.004), 0.8 and 0.9 (estimate = 0.089; p < 0.001, α = 0.005), 0.9 and 0.95 (estimate = 0.047; p = 0.014, α = 0.020), 0.95 and 0.98 (estimate = 0.066; p < 0.001, a = 0.007).
Students in the lowest master level (below 0.3) had significantly lower final mastery estimates than those with a probability of mastery between 0.5 and 0.7 (estimate =0.053; p = 0.013, α = 0.018), 0.9 and 0.95 (estimate =0.076; p = 0.001, α = 0.011), and 0.95 and 0.98 (estimate =0.057; p = 0.002, α = 0.013). Students with a probability of mastery between 0.7 and 0.8 also had lower final mastery estimates than those with a probability of mastery between 0.9 and 0.95 (estimate =0.068; p = 0.010, α = 0.016), and 0.95 and 0.98 (estimate =0.057; p = 0.014, α = 0.021).
Learning measured by the difference between the initial and final knowledge estimates. Table 5 presents the estimated differences in learning on micro-lesson N+1 based on the mastery levels in micro-lesson N. The highest mastery level significantly outperformed all other mastery levels in terms of learning. As shown in the results highlighted in green in Table 5, the students in the highest master level (at and above 0.98) have significantly greater degree of learning than those with a probability of mastery below 0.3 (estimate = 0.102; p < 0.001, α = 0.002) as well as between 0.3 and 0.5 (estimate = 0.085; p < 0.001, α = 0.009), 0.5 and 0.7 (estimate = 0.058; p = 0.003, α = 0.014), 0.7 and 0.8 (estimate = 0.110; p < 0.001, α = 0.004), 0.8 and 0.9 (estimate = 0.093; p < 0.001, α = 0.005), 0.90 and 0.95 (estimate = 0.045; p = 0.018, α = 0.020), 0.95 and 0.98 (estimate = 0.068; p < 0.001; α = 0.007).
Mastery level on micro-lesson N | 1) P(Ln)<0.3 | 2) 0.3<=P(Ln)<0.5 | 3) 0.5<=P(Ln)<0.7 | 4) 0.7<=P(Ln)<0.8 | 5) 0.8<=P(Ln)<0.9 | 6) 0.9<=P(Ln)<0.95 | 7) 0.95<=P(Ln)<0.98 |
|---|---|---|---|---|---|---|---|
2) 0.3<=P(Ln)<0.5 | 0.011 p = 0.552, a = 0.039 | - | - | - | - | - | - |
3) 0.5<=P(Ln)<0.7 | 0.054* p = 0.004, a = 0.007 | 0.044 p = 0.07, a = 0.018 | - | - | - | - | - |
4) 0.7<=P(Ln)<0.8 | 0.044 p = 0.024, a = 0.013 | 0.03 p = 0.224, a = 0.023 | -0.012 p = 0.617, a = 0.043 | - | - | - | - |
5) 0.8<=P(Ln)<0.9 | 0.026 p = 0.15, a = 0.020 | 0.017 p = 0.464, a = 0.034 | -0.027 p = 0.248, a = 0.025 | -0.014 p = 0.546, a = 0.038 | - | - | - |
6) 0.9<=P(Ln)<0.95 | 0.026 p = 0.202, a = 0.021 | 0.013 p = 0.618, a = 0.045 | -0.029 p = 0.257, a = 0.027 | -0.018 p = 0.487, a = 0.036 | -0.004 p = 0.861, a = 0.05 | - | - |
7) 0.95<=P(Ln)<0.98 | 0.032 p = 0.051, a = 0.014 | 0.023 p = 0.30, a = 0.030 | -0.019 p = 0.385, a = 0.032 | -0.004 p = 0.849, a = 0.048 | 0.01 p = 0.629, a = 0.046 | 0.014 p = 0.554, a = 0.041 | - |
8) 0.98<=P(Ln) |
0.072* p < 0.001 , a = 0.002 | 0.060* p = 0.001, a = 0.004 | 0.020 p = 0.286, a = 0.029 | 0.034 p = 0.064, a = 0.016 | 0.049* p = 0.004, a = 0.005 | 0.053* p = 0.006, a = 0.009 | 0.040* p = 0.006, a = 0.011 |
Mastery level on micro-lesson N | 1) P(Ln)<0.3 | 2) 0.3<=P(Ln)<0.5 | 3) 0.5<=P(Ln)<0.7 | 4) 0.7<=P(Ln)<0.8 | 5) 0.8<=P(Ln)<0.9 | 6) 0.9<=P(Ln)<0.95 | 7) 0.95<=P(Ln)<0.98 | |
|---|---|---|---|---|---|---|---|---|
2) 0.3<=P(Ln)<0.5 | 0.03 p = 0.164, a = 0.034 | - | - | - | - | - | - | |
3) 0.5<=P(Ln)<0.7 | 0.053* p = 0.013, a = 0.018 | 0.03 p = 0.247, a = 0.036 | - | - | - | - | - | |
4) 0.7<=P(Ln)<0.8 | 0.013 p = 0.54, a = 0.045 | -0.016 p = 0.534, a = 0.043 | -0.052 p = 0.047, a = 0.023 | - | - | - | - | |
5) 0.8<=P(Ln)<0.9 | 0.033 p = 0.107, a = 0.029 | 0.009 p = 0.726, a = 0.048 | -0.023 p = 0.349, a = 0.039 | 0.024 p = 0.344, a = 0.038 | - | - | - | |
6) 0.9<=P(Ln)<0.95 | 0.076* p = 0.001, a = 0.011 | 0.044 p = 0.099, a = 0.027 | 0.016 p = 0.552, a = 0.046 | 0.068* p = 0.010, a = 0.016 | 0.045 p = 0.07, a = 0.025 | - | - | |
7) 0.95<=P(Ln)<0.98 | 0.057* p = 0.002, a = 0.013 | 0.037 p = 0.124, a = 0.03 | 0.005 p = 0.834, a = 0.05 | 0.057* p = 0.014, a = 0.021 | 0.031 p = 0.153, a = 0.032 | -0.018 p = 0.431, a = 0.041 | - | |
8) 0.98<=P(Ln) |
0.101* p < 0.001, a = 0.002 | 0.084* p < 0.001 , a = 0.009 | 0.052* p = 0.008, a = 0.014 | 0.109* p < 0.001, a = 0.004 | 0.089* p < 0.001, a = 0.005 | 0.047* p = 0.014, a = 0.020 | 0.066* p < 0.001, a = 0.007 | |
Students in the lowest master level have significantly smaller gains than those with a probability of mastery between 0.50 and 0.70 (estimate =0.050; p = 0.020, α = 0.021), 0.90 and 0.95 (estimate =0.076; p = 0.001, α = 0.011), and 0.95 and 0.98 (estimate =0.056; p = 0.002, α = 0.013). Students with a probability of mastery between 0.7 and 0.8 also had lower learning gains than those with a probability of mastery between 0.9 and 0.95 (estimate =0.071; p = 0.007, α = 0.016), and 0.95 and 0.98 (estimate =0.055; p = 0.017, α = 0.018).
Mastery level on micro-lesson N | 1) P(Ln)<0.3 | 2) 0.3<=P(Ln)<0.5 | 3) 0.5<=P(Ln)<0.7 | 4) 0.7<=P(Ln)<0.8 | 5) 0.8<=P(Ln)<0.9 | 6) 0.9<=P(Ln)<0.95 | 7) 0.95<=P(Ln)<0.98 |
|---|---|---|---|---|---|---|---|
2) 0.3<=P(Ln)<0.5 | 0.029 p = 0.174, a = 0.034 | - | - | - | - | - | - |
3) 0.5<=P(Ln)<0.7 | 0.05* p = 0.02, a = 0.021 | 0.025 p = 0.337, a = 0.038 | - | - | - | - | - |
4) 0.7<=P(Ln)<0.8 | 0.013 p = 0.564, a = 0.046 | -0.016 p = 0.53, a = 0.045 | -0.046 p = 0.075, a = 0.025 | - | - | - | - |
5) 0.8<=P(Ln)<0.9 | 0.03 p = 0.142, a = 0.03 | 0.005 p = 0.835, a = 0.05 | -0.021 p = 0.388, a = 0.041 | 0.02 p = 0.424, a = 0.043 | - | - | - |
6) 0.9<=P(Ln)<0.95 | 0.076* p = 0.001, a = 0.011 | 0.048 p = 0.076, a = 0.027 | 0.024 p = 0.36, a = 0.039 | 0.071* p = 0.007, a = 0.016 | 0.052 p = 0.037, a = 0.023 | - | - |
7) 0.95<=P(Ln)<0.98 | 0.056* p = 0.002, a = 0.013 | 0.035 p = 0.145, a = 0.032 | 0.009 p = 0.709, a = 0.048 | 0.055* p = 0.017, a = 0.018 | 0.033 p = 0.123, a = 0.029 | -0.022 p = 0.332, a = 0.036 | - |
8) 0.98<=P(Ln) |
0.102* p < 0.001 , a = 0.002 | 0.085* p < 0.001, a = 0.009 | 0.058* p = 0.003, a = 0.014 | 0.110* p < 0.001, a = 0.004 | 0.093* p < 0.001, a = 0.005 | 0.045* p = 0.018, a = 0.020 | 0.068* p < 0.001, a = 0.007 |
Discussion and conclusion
The current study explores the relationship between students’ mastery in one lesson and their performance, knowledge, and learning in the subsequent lessons, aiming to provide evidence to answer how much mastery is needed now to support future learning. While previous literature suggests using 0.95 as a threshold to define mastery in Bayesian Knowledge Tracing primarily to avoid over-practice [9, 19], the current study demonstrates the benefits of setting a threshold as high as 0.98 for supporting future performance. Specifically, our findings consistently show that students who achieved a knowledge estimate (P(Ln)) at and above 0.98 outperformed their peers across multiple learning metrics in the following lessons: they exhibited higher percentages of correct responses, higher early and final knowledge estimates, and greater learning gains (reflected by the difference between their initial and final knowledge estimates). These results suggest that P(Ln) > 0.98 may serve as a more effective threshold for defining mastery, given its potential to facilitate accelerated future learning [AFL; 14]. In other words, skipping students forward based on a mastery criterion of 0.95 or lower may overlook an opportunity for students to continue to improve their understanding on the current skill in a way that facilitates future learning. Or to put it another way, much of the over-practice identified by [8] may not be over-practice at all.
As is the nature of any correlational analysis, the relationship identified in the current study does not prove causation. Although it is possible that attaining a higher mastery level caused students to perform better on subsequent lessons, it is also plausible that the students who attain high mastery have characteristics that make them more likely to perform better on both lessons. Thus, future research should employ causal methods to evaluate the impact of thresholds on learning. Additionally, it will probably be valuable to replicate the current analysis using data from different platforms and domains to examine the generalizability of the identified threshold (and the overall phenomenon of a higher threshold for AFL than is commonly used for mastery of the current skill). Additionally, it will be valuable to evaluate this threshold with other knowledge tracing models that predict performance (e.g., deep knowledge tracing) rather than focusing solely on BKT, as demonstrated in the current analysis. Other knowledge tracing models (especially deep learning-based models) may already account for the relationships across skills, contextualizing the estimation of a student knowledge on one skill using information from other skills. This could partially capture and reflect the same relationships observed in the current study, confounding the results. By conducting analyses with diverse datasets and experimenting with various knowledge tracing models, it will be possible to develop a more comprehensive understanding of where the mastery threshold should be, contributing to the ongoing discussion of how much mastery is enough mastery. Such findings can help improve adaptivity in digital learning systems, better optimize personalized learning, and facilitate future learning.
ACKNOWLEDGMENTS
This research was supported by funding from the Learning Engineering Virtual Institute (LEVI) Engagement Hub. All opinions expressed are those of the authors.
REFERENCES
- Abdelrahman, G. et al. 2023. Knowledge tracing: A survey. ACM Computing Surveys. 55, 11 (2023), 1–37.
- Anderson, S.A. 1994. Synthesis of Research on Mastery Learning. (1994).
- Baker, R.S. et al. 2008. More Accurate Student Modeling through Contextual Estimation of Slip and Guess Probabilities in Bayesian Knowledge Tracing. Intelligent Tutoring Systems (Berlin, Heidelberg, 2008), 406–415.
- Baker, R.S. d et al. 2010. Contextual slip and prediction of student performance after use of an intelligent tutor. User Modeling, Adaptation, and Personalization: 18th International Conference, UMAP 2010, Big Island, HI, USA, June 20-24, 2010. Proceedings 18 (2010), 52–63.
- Baker, R.S.J. d. et al. 2010. Better to be frustrated than bored: The incidence, persistence, and impact of learners’ cognitive–affective states during interactions with three different computer-based learning environments. International Journal of Human-Computer Studies. 68, 4 (Apr. 2010), 223–241. DOI:https://doi.org/10.1016/j.ijhcs.2009.12.003.
- Benjamini, Y. and Hochberg, Y. 1995. Controlling the False Discovery Rate: A Practical and Powerful Approach to Multiple Testing. Journal of the Royal Statistical Society: Series B (Methodological). 57, 1 (Jan. 1995), 289–300. DOI:https://doi.org/10.1111/j.2517-6161.1995.tb02031.x.
- Botelho, A.F. et al. 2019. Refusing to Try: Characterizing Early Stopout on Student Assignments. Proceedings of the 9th International Conference on Learning Analytics & Knowledge (Tempe AZ USA, Mar. 2019), 391–400.
- Cen, H. et al. 2007. Is Over Practice Necessary?-Improving Learning Efficiency with the Cognitive Tutor through Educational Data Mining. Frontiers in artificial intelligence and applications. 158, (2007), 511.
- Corbett, A.T. and Anderson, J.R. 1995. Knowledge tracing: Modeling the acquisition of procedural knowledge. User Modelling and User-Adapted Interaction. 4, 4 (1995), 253–278.
- David, Y.B. et al. 2016. Sequencing educational content in classrooms using Bayesian knowledge tracing. Proceedings of the sixth international conference on Learning Analytics & Knowledge (2016), 354–363.
- Hu, D. 2011. How Khan academy is using machine learning to assess student mastery. Online: http://david-hu. com. (2011).
- Kelly, K. et al. 2016. Defining mastery: Knowledge tracing versus n-consecutive correct responses. Student Modeling From Different Aspects. (2016), 39.
- Kulik, C.-L.C. et al. 1990. Effectiveness of mastery learning programs: A meta-analysis. Review of educational research. 60, 2 (1990), 265–299.
- van Lehn, K. and Chi, M. 2012. Adaptive expertise as acceleration of future learning. Adaptive technologies for training and education. (2012), 28–45.
- Lu, Y. et al. 2024. Advanced Knowledge Tracing: Incorporating Process Data and Curricula Information via an Attention-Based Framework for Accuracy and Interpretability. Journal of Educational Data Mining. 16, 2 (2024), 58–84.
- Ovsyannikova, O. 2019. Global proficiency framework: Reading and Mathematics-Grades 2 to 6. (2019).
- Pardos, Z.A. et al. 2012. The sum is greater than the parts: Ensembling models of student knowledge in educational software. ACM SIGKDD explorations newsletter. 13, 2 (2012), 37–44.
- Pavlik, P. et al. 2009. Performance Factors Analysis – A New Alternative to Knowledge Tracing. Proceedings of the 14th International Conference on Artificial Intelligence in Education (Brighton, England, 2009), 531–538.
- Pelánek, R. and Řihák, J. 2018. Analysis and design of mastery learning criteria. New Review of Hypermedia and Multimedia. 24, 3 (2018), 133–159.
- Pelánek, R. and Řihák, J. 2017. Experimental analysis of mastery learning criteria. Proceedings of the 25th conference on user modeling, adaptation and personalization (2017), 156–163.
- Ritter, S. et al. 2016. How mastery learning works at scale. Proceedings of the Third (2016) ACM Conference on Learning@ Scale (2016), 71–79.
- San Pedro, M.O.Z. et al. 2013. Towards an understanding of affect and knowledge from student interaction with an intelligent tutoring system. Artificial Intelligence in Education: 16th International Conference, AIED 2013, Memphis, TN, USA, July 9-13, 2013. Proceedings 16 (2013), 41–50.
- Wang, K. et al. 2022. Iterative Refinement of an AIS Rewards System. International Conference on Human-Computer Interaction (2022), 113–125.
- Xiong, X. et al. 2016. Going Deeper with Deep Knowledge Tracing. Proceedings of the 9th International Conference on Educational Data Mining. (2016), 545–550.
© 2025 Copyright is held by the author(s). This work is distributed under the Creative Commons Attribution-NonCommercial-NoDerivatives 4.0 International (CC BY-NC-ND 4.0) license.