ABSTRACT
The traditional Elo rating system (ERS), widely used as a student model in adaptive learning systems, assumes unidimensionality (i.e., all items measure a single ability or skill), limiting its ability to handle multidimensional data common in educational contexts. In response, several multidimensional extensions of the Elo rating system have been proposed, yet their measurement properties remain underexplored. This paper presents a comparative analysis of two such multidimensional extensions specifically designed to address within-item dimensionality: the multidimensional extension of the ERS (MERS) by [24] and the Multi-Concept Multivariate Elo-based Learner model (MELO) introduced by [1]. While both these systems assume a compensatory multidimensional item response theory model underlying student responses, they propose different ways of updating the model parameters. We evaluate these algorithms in a simulation study using key performance metrics, including prediction accuracy, speed of convergence, bias, and variance of the ratings. Our results demonstrate that both multidimensional extensions outperform the unidimensional Elo rating system when the underlying data is multidimensional, highlighting the importance of considering multidimensional approaches to better capture the complexities inherent to the data. Furthermore, our results demonstrate that while the MELO algorithm is converging faster, it exhibits significant bias and lower prediction accuracy compared to the MERS. In addition, the MERS’s robustness to misspecifications of the Q-matrix and its weights gives it an edge in situations where generating an accurate Q-matrix is challenging.
Keywords
1. INTRODUCTION
Personalization of the learning process through the implementation of adaptive technology has received considerable attention in the last years as a way to deal with heterogeneity in the classroom [43, 18, 4]. Accurately tailoring the learning process requires modeling of learner characteristics such as their cognitive skills, motivation or affect. In adaptive online learning environments aimed at providing students practice and instructional material at their level, student models play a central role in tracking and estimating learners’ ability levels [27]. These models serve as the foundation for personalizing the learning experience, enabling systems to dynamically adjust content based on the learner’s evolving ability level [27, 18, 42, 16, 38].
In adaptive learning environments, the next learning task or item is chosen based on the estimation of the student’s current ability level, which allows for a more efficient and tailored learning process [36, 37]. Several theoretical frameworks support the idea that presenting students with tasks that are optimally challenging helps maintain engagement while maximizing learning outcomes [10, 12, 41]. This process of adaptivity is key in ensuring that students are neither overwhelmed by tasks that are too difficult nor bored by tasks that are too easy, thereby fostering an environment conductive to learning and improvement.
Over the years, several student models have been proposed, [27, 9, 25, 13, 8], all with their own advantages and disadvantages. Traditional models such as the Bayesian Knowledge Tracing (BKT) algorithm [9] have been widely used in educational technology due to their simplicity and interpretability. BKT aims to infer whether a student has mastered a particular concept based on their observed performance on related tasks. However, despite their widespread application, these student models often make simplifying assumptions that may not capture the full complexity of student learning behavior. In response to the limitations of earlier student models, more advanced approaches such as Performance Factor Analysis (PFA) [25] have been developed to provide a more nuanced picture of the student performance. These student models incorporate additional variables, such as the difficulty of items, and allow for multiple skills to be involved in an item, leading to more accurate predictions of student performance. However, this method does not provide continuously updated measures of student abilities, making it less suitable for providing feedback on the students’ progress. Additionally, with the rise of big data in education and the increasing availability of fine-grained learner interaction data, more sophisticated machine learning techniques have been applied to student modeling, further enhancing the ability to predict and personalize learning [3, 21, 31]. Machine learning models can process vast amounts of learner data, identifying patterns and trends that were previously difficult to detect using traditional methods. However, these black-box methods are often considered less desirable due to the lack of parameter interpretability [34]. In educational contexts, where transparency is crucial for fostering trust and accountability, the inability to clearly understand how a student model arrives at its decisions can pose significant challenges.
In recent years, Elo rating system (ERS) based student models have also gained popularity in educational contexts. Originally developed for ranking players in competitive games like chess [14], the ERS has found application in a variety of fields [44, 19, 15, 22, 35], among others the field of education [16, 26, 20]. ERS algorithms are appealing due to their transparency, simplicity, efficiency, and dynamic nature, making them particularly well-suited for environments where real-time updates to ability estimates are required. The ERS algorithm operates by adjusting a student’s ability after each interaction, depending on whether the student’s performance meets or exceeds expectations. This allows for a continuous adjustment of the ability estimate, providing adaptive systems with updated information to guide content selection and providing feedback to student, parents, and teachers.
ERS-based algorithms have several advantages over the previously mentioned student models. First, their straightforward updating mechanism enables rapid adjustments to a student’s ability after each task, which is crucial in fast-paced or adaptive environments. Second, the ERS is inherently self-correcting, as it adjusts estimates based on new student-item interactions. This flexibility allows it to adapt to learners who may experience significant fluctuations in performance. Third, the ERS allows for updating the item parameters, eliminating the need for item bank calibration. Despite these benefits, ERS-based algorithms also face challenges, such as not being able to incorporate multiple dimensions of ability, which are areas where other student models, like PFA models, may perform better.
The basic version of the ERS used in educational settings consists of two rules similar to those used in the original chess implementation [14]. Updating ability and difficulty estimates is done as follows:
where \(\theta _t\) and \(\beta _t\) are the person’s ability and item difficulty estimates after the update, \(\theta _{t-1}\) and \(\beta _{t-1}\) are the estimates before the update, \(K\) is the weight assigned to the updated value, \(X\) is the observed outcome (1 if the item is answered correctly or 0 if the item is answered incorrectly), and \(E(X)\) is the expected outcome; subscripts \(i\) and \(j\) denote the \(i\)-th person and the \(j\)-th item, respectively. The expected outcome \(E(X)\) is calculated using the Rasch model [32]:
Demonstrating its effectiveness, the ERS has successfully been implemented in large-scale learning environments [7, 16, 30, 23].
As we mentioned earlier, a notable drawback of the ERS is its underutilization of multidimensionality inherent to educational data. Since the ERS relies on the Rasch model for the calculation of the expected outcome, it can only take one ability into account, unlike other student models that are inherently multidimensional [13, 17]. The possible advantage of incorporating multidimensionality into student models lies in the potential for enhanced diagnostic feedback, better predictive accuracy, and improved adaptive item selection [28]. Tracking multiple abilities can provide additional layers of information about a learner’s knowledge state, which may result in better performance of the algorithm when selecting items that are more closely aligned with a learner’s specific needs. However, taking multidimensionality into account will also result in a more complex student model [29]. Not only does it make the algorithm itself more complicated, but it also requires careful specification of the underlying multidimensional structure. Properly identifying and defining the relevant skill dimensions is a challenging task. Additionally, robustness becomes a key concern: One needs to ensure that the algorithm performs well even when the multidimensional structure is imperfectly specified.
When discussing multidimensionality in data from adaptive learning environments, it is useful to distinguish between within-item and between-item dimensionality. Within-item dimensionality refers to the case where an item requires multiple abilities to be solved. If all these skills are tracked separately, the resulting student model might provide a more accurate estimate of the learner’s probability of answering the item correctly, compared to tracking only a broad, general skill. Furthermore, the finer-grained skill estimation could help diagnose errors if a student makes a mistake. This level of detail allows educators to intervene more effectively, addressing the specific areas where the student is struggling. Without multidimensional tracking, a unidimensional ERS would simply adjust the learner’s general ability rating based on whether they answered correctly or incorrectly, missing the opportunity to provide insight into the underlying causes of the error.
This paper focuses on two multidimensional ERS extensions proposed to address within-item dimensionality, the multidimensional extension of the ERS (MERS) by [24] and the Multi-Concept Multivariate Elo-based Learner model (MELO) introduced by [1]. Both ERS extensions replace the traditional unidimensional Rasch model with a compensatory multidimensional item response theory (MIRT) model to calculate the probability of a correct response. MIRT models are designed to handle multidimensionality by simultaneously estimating multiple abilities that are required to solve a given item [33, 6]. MIRT models can generally be categorized into two types: compensatory and non-compensatory models. The difference between these models lies in how they handle the interaction between multiple skills. In compensatory MIRT models, the skills required to solve an item are assumed to compensate for one another, meaning that a lower proficiency in one skill can be compensated for by strength in another, leading to a higher probability of success on the item. On the other hand, non-compensatory MIRT models assume that all required skills must be present at a sufficient level for successful task completion. In these models, a deficiency in one skill cannot be compensated for by proficiency in another, making it necessary for learners to meet certain thresholds across all relevant dimensions to answer the item correctly. Overall, compensatory models are used more often in educational measurement compared to non-compensatory models because they are more tractable and more similar to confirmatory factor analysis and generalized linear latent variable models in general.
Both MERS and MELO assume that the compensatory MIRT model is the data generating model:
where \(\theta _{im}\) is the ability of person \(i\) on skill \(m\), \(a_{jm}\) is the weight of skill \(m\) for item \(j\), and \(M\) is the number of skills considered. Both multidimensional ERS extensions discussed here are aimed at dynamically estimating the parameters of the same measurement model, but the key distinction between them lies in how the parameter estimates are updated.
The update rule in the MERS [24] follows the same structure as in the unidimensional ERS for both learner and item parameters with a small difference for the learner parameters:
Here, parameters are updated based on the difference between the observed and expected outcome, where the expected outcome is computed based on the assumed data-generating measurement model. However, since the MERS aims to update multiple ability parameters based on the outcome of a single item, a new element is introduced into the equation. As can be seen in Eq.\eqref{E5} the weight \( a_{jm}\) is included which is meant to identify that only those abilities which are involved in solving the item (\(a_{jm}\neq 0\)) will be updated. Item parameters are updated as in Eq.\eqref{E2} but \(E(X)\) is now calculated according to the compensatory MIRT model in Eq.\eqref{E4} instead of the Rasch model.
For the MELO [2] the update of the difficulty rating is done in the same way as for the MERS. For the ability updates, however, the update formula is different. First, the expected outcome no longer relies on the weighted sum of all the skills involved in the item, but only takes into account the skill that is being updated (i.e., the Rasch model in Eq.\eqref{E3} is used to calculate \(E(X)\) instead of the compensatory MIRT model). To make this distinction clear, we refer to the probability of a correct response based on the unidimensional Rasch model for skill \(m\) as \(E(X)_{\theta _m}\). For every skill \(\theta _m\) that is measured by the item, the learner parameter is updated as follows:
where \(a\), is a normalization factor used to obtain a zero-sum for the ability and difficulty parameter updates (similar to the zero-sum principle of the original ERS). In other words, the normalization factor ensures that the total sum of all the update values (both for the item and learner parameters) amounts to zero. The normalization factor is calculated as follows:
In their respective papers, both [24] and [2] assume that the skills involved in the items are equally important, but the exact values of \(a_{jm}\) for the \(M\) skills involved in the item \(j\) of the MIRT model are different. In the MERS a weight of 1 is used for all skills involved, while in the MELO the weights of all the skills involved sum to 1. Despite the apparent differences, this variation primarily represents a case of reparameterization rather than a fundamental difference in the models themselves. In essence, both models share the same theoretical underpinnings regarding multidimensionality and the interaction of multiple skills during the item-solving process. When an item measures two skills (\(\theta _1\) and \(\theta _2\)) we get:
where \(\theta _1^*= 1/2\theta _1\) and \(\theta _2^*= 1/2\theta _2\). By scaling the weights of the ability parameters, we are essentially changing the scale of the latent variables, but the functional relationship between the abilities and the probability of a correct response remains the same. Thus, while the models used in the two ERS extensions look different at first glance, they are actually just different parameterizations of the same underlying MIRT model.
2. AIM OF THE STUDY
Both [24] and [2] provide some information on the performance of their proposed multidimensional ERS extension, yet little attention is paid to the underlying properties of these extensions. This lack of focus on measurement properties is not only a limitation for multidimensional extensions but also for the traditional unidimensional ERS. Recently [5] did a simulation study to investigate the properties of the unidimensional ERS in different scenarios for an (adaptive) learning system. Their study shows that in certain conditions, the ratings generated by the unidimensional ERS fail to converge to the true values, leading to biased estimates of student abilities. A similar study is needed to investigate the properties of multidimensional extension of the ERS.
While the multidimensional ERS extensions provide a potentially more accurate representation of student abilities by accounting for multiple skills, their implementation is complex and computationally demanding. Given these challenges, it is crucial to evaluate whether the increased complexity of a multidimensional student model is justified by significant improvements in performance over the traditional unidimensional ERS. If the unidimensional ERS can exhibit comparable or similar properties to the multidimensional extensions when applied to multidimensional data, it could suggest that the added complexity may not always be necessary for accurate student performance estimation. Therefore, we aim to compare the two proposed algorithms in how well they allow for measuring the multiple ability parameters of the MIRT model.
We investigate the properties of the two very similar multidimensional ERS extensions. The performance of the unidimensional ERS when applied to multidimensional data will be included in our results, but is not the primary focus of this study. Specifically, the unidimensional ERS serves as a baseline to investigate the performance of the two multidimensional extensions to the ERS. To address our research question, we conduct a simulation study that investigates the properties of both multidimensional ERS extensions in terms of bias, variance, prediction accuracy, and speed of convergence under a variety of scenarios. To test the robustness of the algorithms, we will not only look at when the measurement model (which items load on which skills and what the values of these loadings are) used is correct, but also when there are misspecifications. By analyzing the outcomes, we will evaluate the implications for adaptive learning environments. This research aims to provide valuable insights into the utility of multidimensional extensions to the ERS and contribute to the ongoing discussion on the most effective ways to model student abilities in educational contexts.
3. METHOD
The algorithms under investigation extend the traditional ERS by incorporating MIRT models to account for situations where multiple latent skills are required for solving individual items. A key objective of this study is to look at asymptotic behavior: when the abilities are stable and the learners continuously respond to items. In other words, we are particularly interested in whether for each student a stable state is reached around which the rating is fluctuating. We are further interested in whether this stable state is different from the true value, and how much variation is there in the ratings. Finally, given that in real-life applications limited amount of data is available, it is important to know how many updates are needed to reach the stable state. To explore these properties, we will adopt a simulation setup similar to that used in [5], which will allow us to monitor how the distributions of ratings (across replications of the same learning system) evolve over time. This setup will provide insights into the asymptotic behavior of the algorithms.1.
3.1 Scenarios
First, we conducted simulations for both the MERS and the MELO algorithm with correctly specified weights (i.e., the item weights used in the respective ERS algorithms are the same as used for data generation). While this represents a strict assumption, it allows us to assess the performance of both algorithms under optimal conditions. Additionally, we explored how the MERS and MELO algorithms perform in two scenarios where the weights are misspecified. In contrast to the unidimensional ERS, multidimensional ERS extensions require specifying the relationships between multiple skills and items. This process is inherently more challenging because it involves defining how each item taps into the various skills, which often requires the expertise of domain specialists[11, 28]. It can be argued that this not only is a subjective process but also time-consuming. The potential for misspecified weights becomes a significant concern, especially in real-world large-scale applications where domain experts may not always have the resources or time to ensure that all these specifications are accurate. We considered two different ways in which the weights can be misspecified: 1) the structure of the loadings (i.e., which items measure which skills, often referred to as the Q-matrix) is correctly specified, but the exact values of the weights are not; 2) the Q-matrix itself is misspecified. We included both scenarios in our study. This is meant to mimic real-life scenarios where it is hard to correctly specify the weights or the skills involved in an item, and a simplification of the Q-matrix is used in the algorithm. These scenarios allowed us to explore how the algorithms performed when the weights were misspecified, which closely mirrors the types of challenges faced in practical scenarios where domain experts may not have perfect knowledge or resources.
As we were not sure about the usefulness of the normalization factor in the MELO algorithm, we ran the MELO both with and without the normalization factor. Since it did not have much influence on the results, we only report the results from the MELO without normalization factor here. Finally, a unidimensional ERS was applied to the same multidimensional simulated data to examine how effectively the traditional ERS performs when the data is multidimensional. For all algorithms and all scenarios, the simulations were run for different correlations between the skills.
3.2 Ability values
For all scenarios, the true abilities are simulated following the same procedure. For this simulation study, we limited the number of skills dimensions to three (\(\theta _1\), \(\theta _2\) and \(\theta _3\)) to keep the simulation tractable. The true ability values are simulated for 1000 persons from a multivariate normal distribution with a zero mean vector and standard deviations equal to 1. To investigate the effect of the correlations on performance of the algorithms, we considered the following conditions: high correlation (\(\rho =.8\)), moderate correlation (\(\rho = .6\) and \(\rho =.4\)), low correlation (\(\rho =.2\)) and no correlation (\(\rho =0\)). In each condition, the correlations are the same for each pair of skills. Note that to make the simulation more tractable, ability levels are kept stable over time. While this is a limitation of the study, it is necessary to compare the asymptotic properties of the different algorithms and investigate whether the ratings converge to an invariant distribution.
3.3 Item bank
In the scenario without misspecifications, we generated an item bank in which each item in the simulation requires a combination of two skills, resulting in three possible skill combinations and thus three different item types (Type 1 - skills 1 and 2, Type 2 - skills 1 and 3, Type 3 - skills 2 and 3). All non-zero item weights were set to 0.5.
For the misspecification scenarios, within the algorithms we used the weights as described above, but the true weights used to generate data were different. In the scenario with a correct \(Q\)-matrix but incorrect weights, the true values of the weights in one of the involved dimensions were sampled uniformly between 0.2 and 0.8 and the sum of the weights for each item was fixed to 1.
In the scenario with a misspecified Q-matrix we assumed 70% of the items to be correctly specified since we expect that in real-life applications subject-matter experts would be able to specify the majority of the items correctly. For the remaining 30% we implemented 5 different sets of true weights (each with equal occurrence). For items with assumed weights of 1/2 for dimensions 1 and 2, these sets were as follows:
| \(a_{i1}\) | \(a_{i2}\) | \(a_{i3}\) | |
| C1 | 1 | 0 | 0 |
| C2 | 0 | 1 | 0 |
| C3 | 1/2 | 0 | 1/2 |
| C4 | 0 | 1/2 | 1/2 |
| C5 | 1/3 | 1/3 | 1/3 |
with analogous specifications for the items that are assumed to load on other pairs of dimensions. Misspecifications C1 and C2 mean that a dimension that is not needed for the item is included in the assumed Q-matrix. Misspecifications C3 and C4 mean that one of the dimensions is correctly identified, but the other one is not. Finally, misspecification C5 means that one dimension required for the item is missing in the assumed Q-matrix. We did not include specifications in which none of the dimensions are correctly identified, as it is not likely to occur in practice.
We simulated 200 distinct items for each assumed item type, resulting in 600 items overall. Item difficulties were generated from the standard normal distribution \(N(0,1)\) in all scenarios.
3.4 Simulation set up
Given the true values of the student and item parameters, we simulated data of a learning environment consisting of 1000 games where for each game students are given an item of each of the tree item types. The starting values for both item and person parameters were initialized at zero. Item selection was done randomly to keep the design simple and focus on the algorithm comparison. Although adaptive item selection would provide greater ecological validity by tailoring items to individual abilities, we chose random item selection to isolate the performance of the rating algorithms without the influence of external factors like item difficulty targeting. After each item interaction, both the student’s and the item’s ratings were updated according to the respective rating algorithm (MERS, MELO, or the unidimensional ERS).
For each item a person is presented with, the corresponding ERS algorithm is applied to update the ratings. The response outcome (\(X\)) was generated under the compensatory MIRT model \eqref{E4} using the true values of the abilities and difficulties and the true item weights. The actual response was determined by comparing the probability of success computed from the MIRT model with a value sampled from a uniform distribution on [0, 1]. The expected outcome (\(E(X)\)) needed for the ERS algorithms is also calculated using the compensatory MIRT model in Eq.\eqref{E4}, but now using the current values of the ratings rather than the true values. Remember that this is only the case for the MERS and the difficulty parameters in the MELO. The updating rules in the MELO for the ability parameters rely on \(E(X)_{\theta _m}\). For the unidimensional ERS, the data generation is the same as for the multidimensional extensions, but for the algorithm all items were assumed to load on the same single skill and only one person rating is calculated and hence the expected outcome is calculated under the Rasch model.
The simulations were run for a range of \(K\)-values between .1 and .5. This is justified by the fact that \(K\) values higher than .5 will rarely be implemented in practice to ensure stability in rating updates while accommodating the inherent noise in learner responses. The same \(K\)-values were used across all dimensions, algorithms and simulation scenarios. After each game, the rating of one skill was recorded to be able to compute the outcome measures. To obtain robust estimates of the algorithms’ performance, for every combination of the scenario, correlation, and \(K\)-value we ran 500 replications of systems with each of the three algorithms. Each replication used the same set of true ability values for the participants, which helped to control for random variation in ability estimates and ensured consistency across replications. This repetition allowed us to estimate the distribution of the ratings across replications, which can be used to determine the invariant distribution of the ratings and investigate the properties of the multidimensional ERS extensions.
3.5 Outcome measures
Throughout the rest of the paper, we refer to a set of different outcome measures. We briefly explain here how these were calculated.
3.5.1 Invariant distribution and hitting time
As outlined in the previous section, we have 500 replications of the ratings of each person at each point in time. This setup allows us to observe the distribution of ratings (across replications) for each person at different timepoints (i.e., games). From these distributions, we compute both the mean and variance of the ratings (across replications) for each person at each timepoint, which serve as key metrics for evaluating the algorithm’s performance. If these metrics stabilize as the number of games increases, it would indicate that the ratings have reached an invariant distribution, a stable level around which the updates fluctuate. The mean and variance of the invariant distribution were estimated as the mean and variance of the mean ratings of the last 400 games. To determine at what point in time the means of the ratings stabilize, we determine the time point at which the person-specific mean rating first falls within a narrow range (+/- 0.05) from the mean of their invariant distribution for 10 consecutive time points, which we will refer to as the hitting time.
3.5.2 Bias and average absolute bias
Bias of the ratings was calculated as the difference between the mean of the invariant distribution and the true values. An algorithm provides unbiased estimates of the parameters, if the mean of the invariant distribution is equal to the true value. We also computed the average absolute bias to summarize the results across persons. Average absolute bias refers to the average of the absolute differences between the true values and the means of the invariant distributions of the ratings over persons. We looked at average absolute bias because if the bias would have a symmetric structure, just taking the average across persons would not be informative.
3.5.3 Mean squared error of prediction
Mean squared error was used as a metric for prediction accuracy and calculated over the predicted outcome (\(E(X)\)) and the actual outcome (\(X\)) for each item of type 1 for all time points (i.e., 1000 games). At each time point, the squared difference was averaged across all persons and all replications.
3.5.4 Correlation between the true values and the means of the invariant distributions
Bias in itself is not necessarily problematic in a learning system where ability measures are solely used for optimizing item selection, as long as the rank ordering of the student and item parameters is maintained. In these systems, the primary goal is to ensure that learners are presented with items that are appropriately challenging and motivating rather than obtaining perfectly accurate parameter estimation. As long as the relative positioning of the learners is maintained even if the estimates are biased, the adaptive item selection can still function effectively. To assess this, we calculated the correlation between the invariant mean and the true values across all individuals. If the correlation is close to 1, this suggests that the system is maintaining an accurate ranking of the individuals.
4. RESULTS
4.1 Properties of the MERS. and MELO with correctly specified weights
To ensure that the algorithms were comparable for the subsequent analyses, we first ran the ERS algorithms for a range of \(K\)-values and compared them in terms of their hitting time and the variance of their invariant distribution. It is important to take variance and hitting time into account at the same time, because if for a given \(K\)-value one algorithm achieves faster convergence by having more noise (higher variance), then for another algorithm one could speed up convergence by simply increasing \(K\). Therefore, hitting times should be compared for a given level of noise in the system. Figure 1 illustrates that both ERS extensions exhibit similar variance at lower \(K\)-values2. However, as \(K\) increases, the variances of the two algorithms began to diverge. Note that Figure 1 is based on the scenario where the skills are correlated .6. However, the same pattern occured for other correlation values. These differences in variance complicate direct comparisons between the algorithms, making it harder to assess their relative performance across different \(K\)-values. To address this, all analyses from now on were done on data generated for a \(K\)-value of .2 ensuring consistency in all subsequent comparisons. In addition, unless we specifically look at the effect of the correlation between the skills, the reported results concern the .6 correlation scenario.
We find that for all algorithms the ratings reached an invariant distribution, but how fast it happens differed between the multidimensional extensions and also depended on the \(K\)-value. For all algorithms, when the \(K\) value increased, the noise in the ratings increased and the variance went up, but fewer responses were needed to reach the invariant distribution (i.e., lower hitting times). Additionally, Figure 1 revealed an interesting pattern in terms of hitting time. The unidimensional ERS and the MELO algorithm exhibited similar hitting times, suggesting they both stabilize at comparable rates. For a given level of noise (i.e., variance), the MERS required most responses to reach convergence.
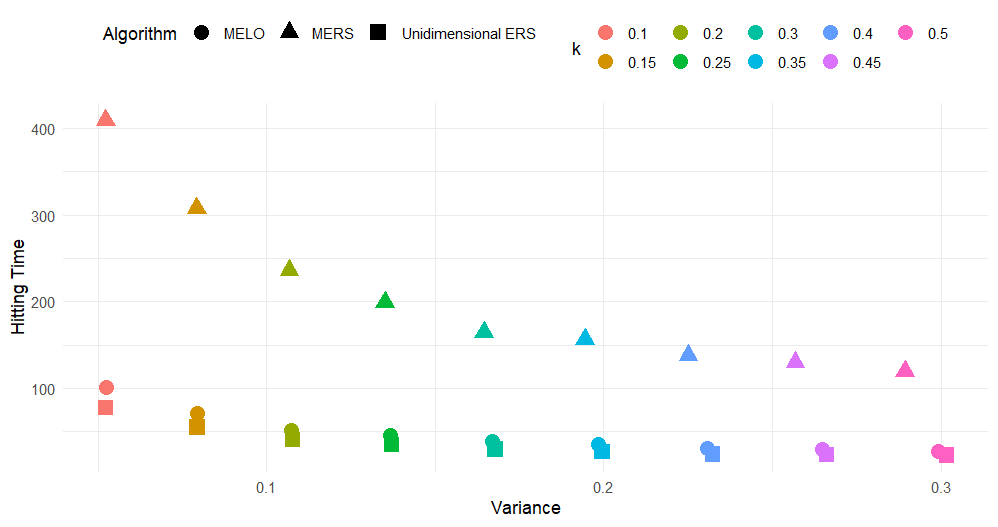
When both multidimensional extensions were run with correctly specified weights, notable differences in their performance emerged. While both algorithms eventually reached an invariant distribution, indicating that the ratings stabilized over time, the MELO, and even the unidimensional ERS, exhibited a notably faster hitting time compared to the MERS (see Figure 1). However, in educational contexts, the stabilization of ratings is not the sole property of interest. Other key measurement properties, such as the unbiasedness of the ratings and their accuracy, also play an important role in evaluating the utility of these algorithms. To further compare the performance of the two multidimensional ERS algorithms, explored these measurement properties in more detail, focusing on how accurately the ratings reflect true abilities and the level of prediction error associated with each algorithm.
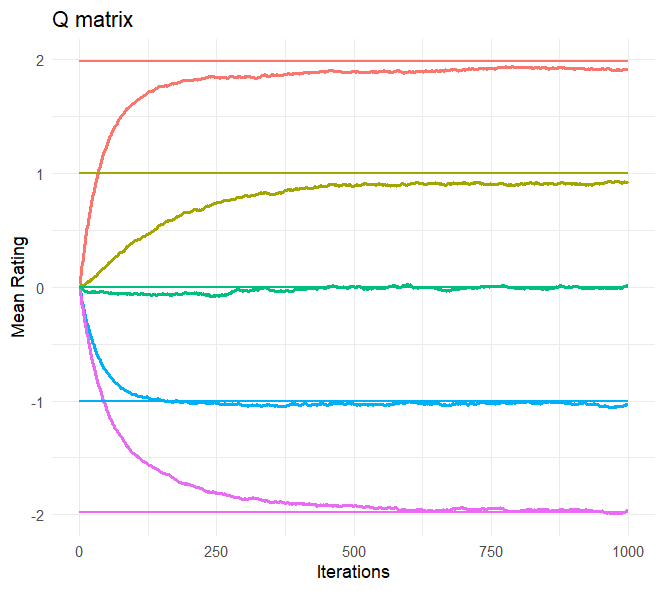
Figure 2 illustrates the development of the mean rating over time for five different individuals (with \(\theta _1\) closest to 0, 1, -1, 2,and -2). This figure clearly illustrates that after moving away from the starting values, the ratings reached an invariant distribution. This figure also confirms our earlier findings with regard to hitting times: While the mean ratings from the MELO stabilized fast, for the MERS it took more games before the means stabilized. However, despite the slower stabilization process for the MERS, it is evident that the mean ratings for the MERS are closer to the true values when compared to the MELO. This suggests that the MERS is less biased in its estimates, as it provides ratings that more accurately reflect the true abilities of the individuals. Note, however, that while the MERS mean ratings are very close to the true values, as expected based on the results on unidimensional ERS from [5] we still see some bias here.
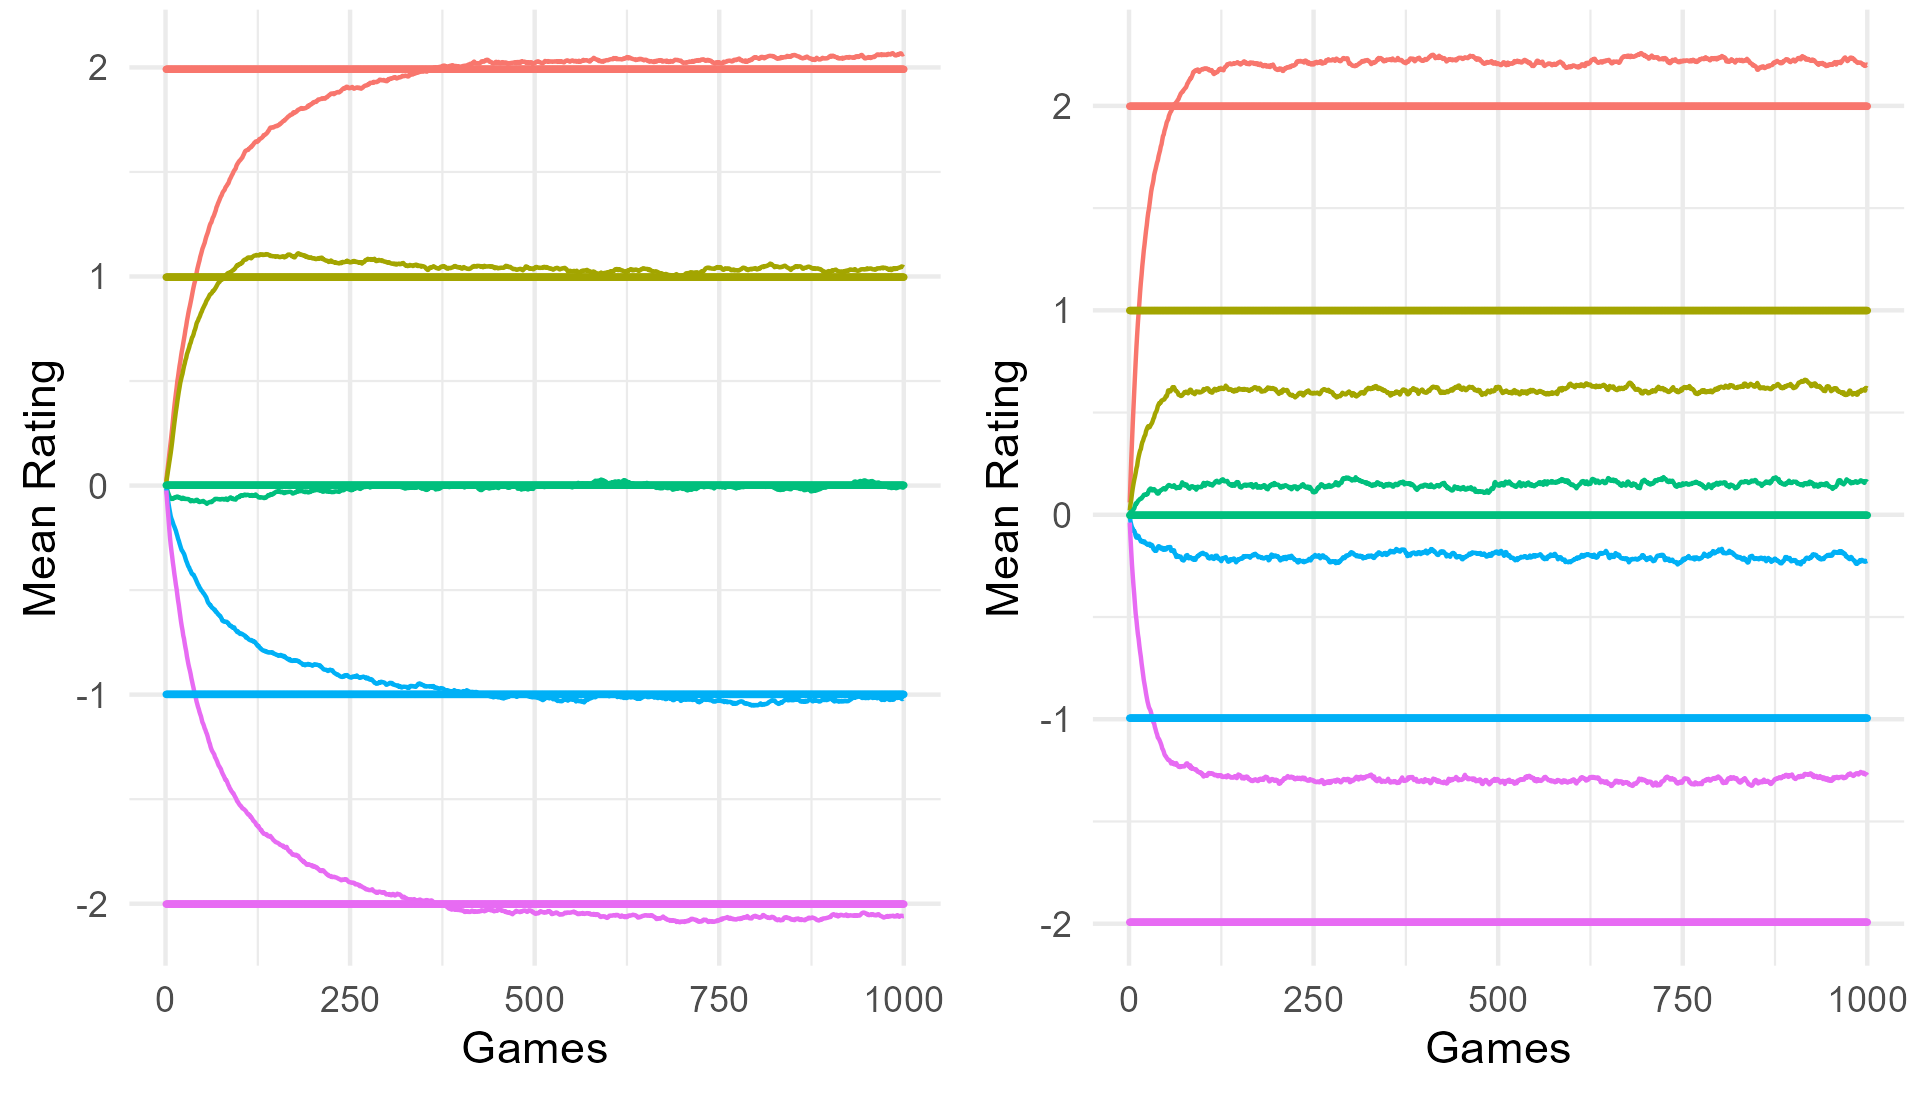
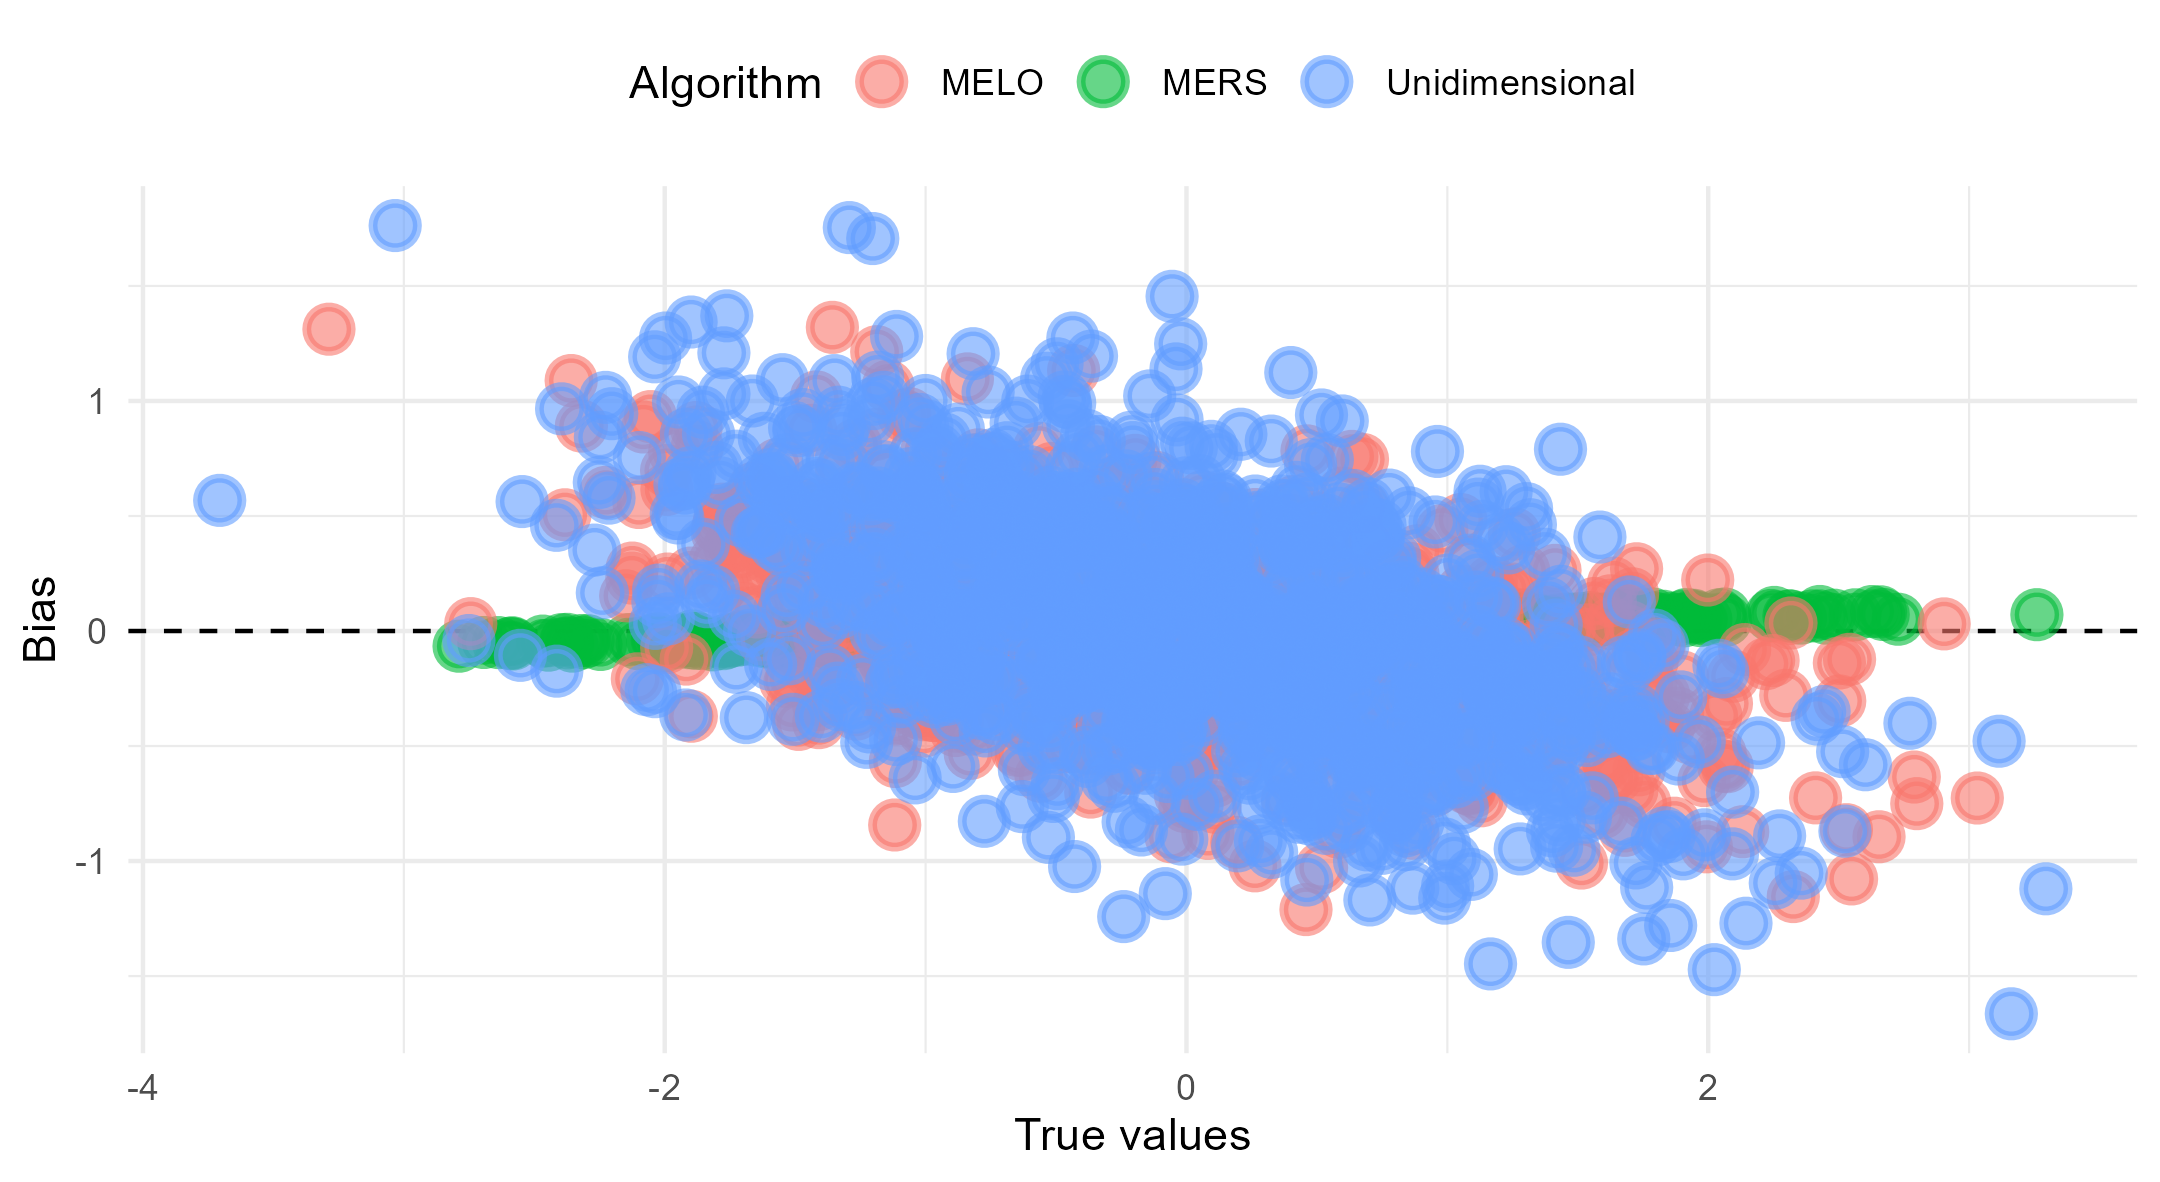
For Figure 3 we calculated the bias for all persons and plotted these values as a function of the true values. From this plot, it is clear that all three algorithms exhibited some form of bias, but the bias in the MERS was minimal when compared to the other algorithms. An interesting pattern emerged from the analysis of bias across different ability levels. For the MERS, a small amount of outward bias was observed, which aligns with findings from the unidimensional ERS in [5]. This means that for individuals with an ability above zero, the MERS tends to slightly overestimate their ability, whereas for individuals with an ability below zero, the MERS slightly underestimates their ability. This outward bias is also clearly visualized in Figure 2.
In contrast, the MELO and the unidimensional ERS exhibited mostly inward bias, which reflects the opposite pattern. In this case, the majority of the individuals with abilities above the average are systematically underestimated by the algorithm, while those below average are overestimated. Additionally, the magnitude of bias for the MELO increased as the absolute true ability values became larger, indicating that the MELO faces increasing difficulty in accurately estimating the abilities of individuals with extreme ability levels. This pattern is clearly visualized in Figure 2, where the mean ratings for the MELO stabilized further away from the true ability values as the true ability increased or decreased. However, this effect is less pronounced for individuals whose true ability values are closer to zero. In other words, the MELO struggles to converge to the true values the further the true ability deviates from zero.
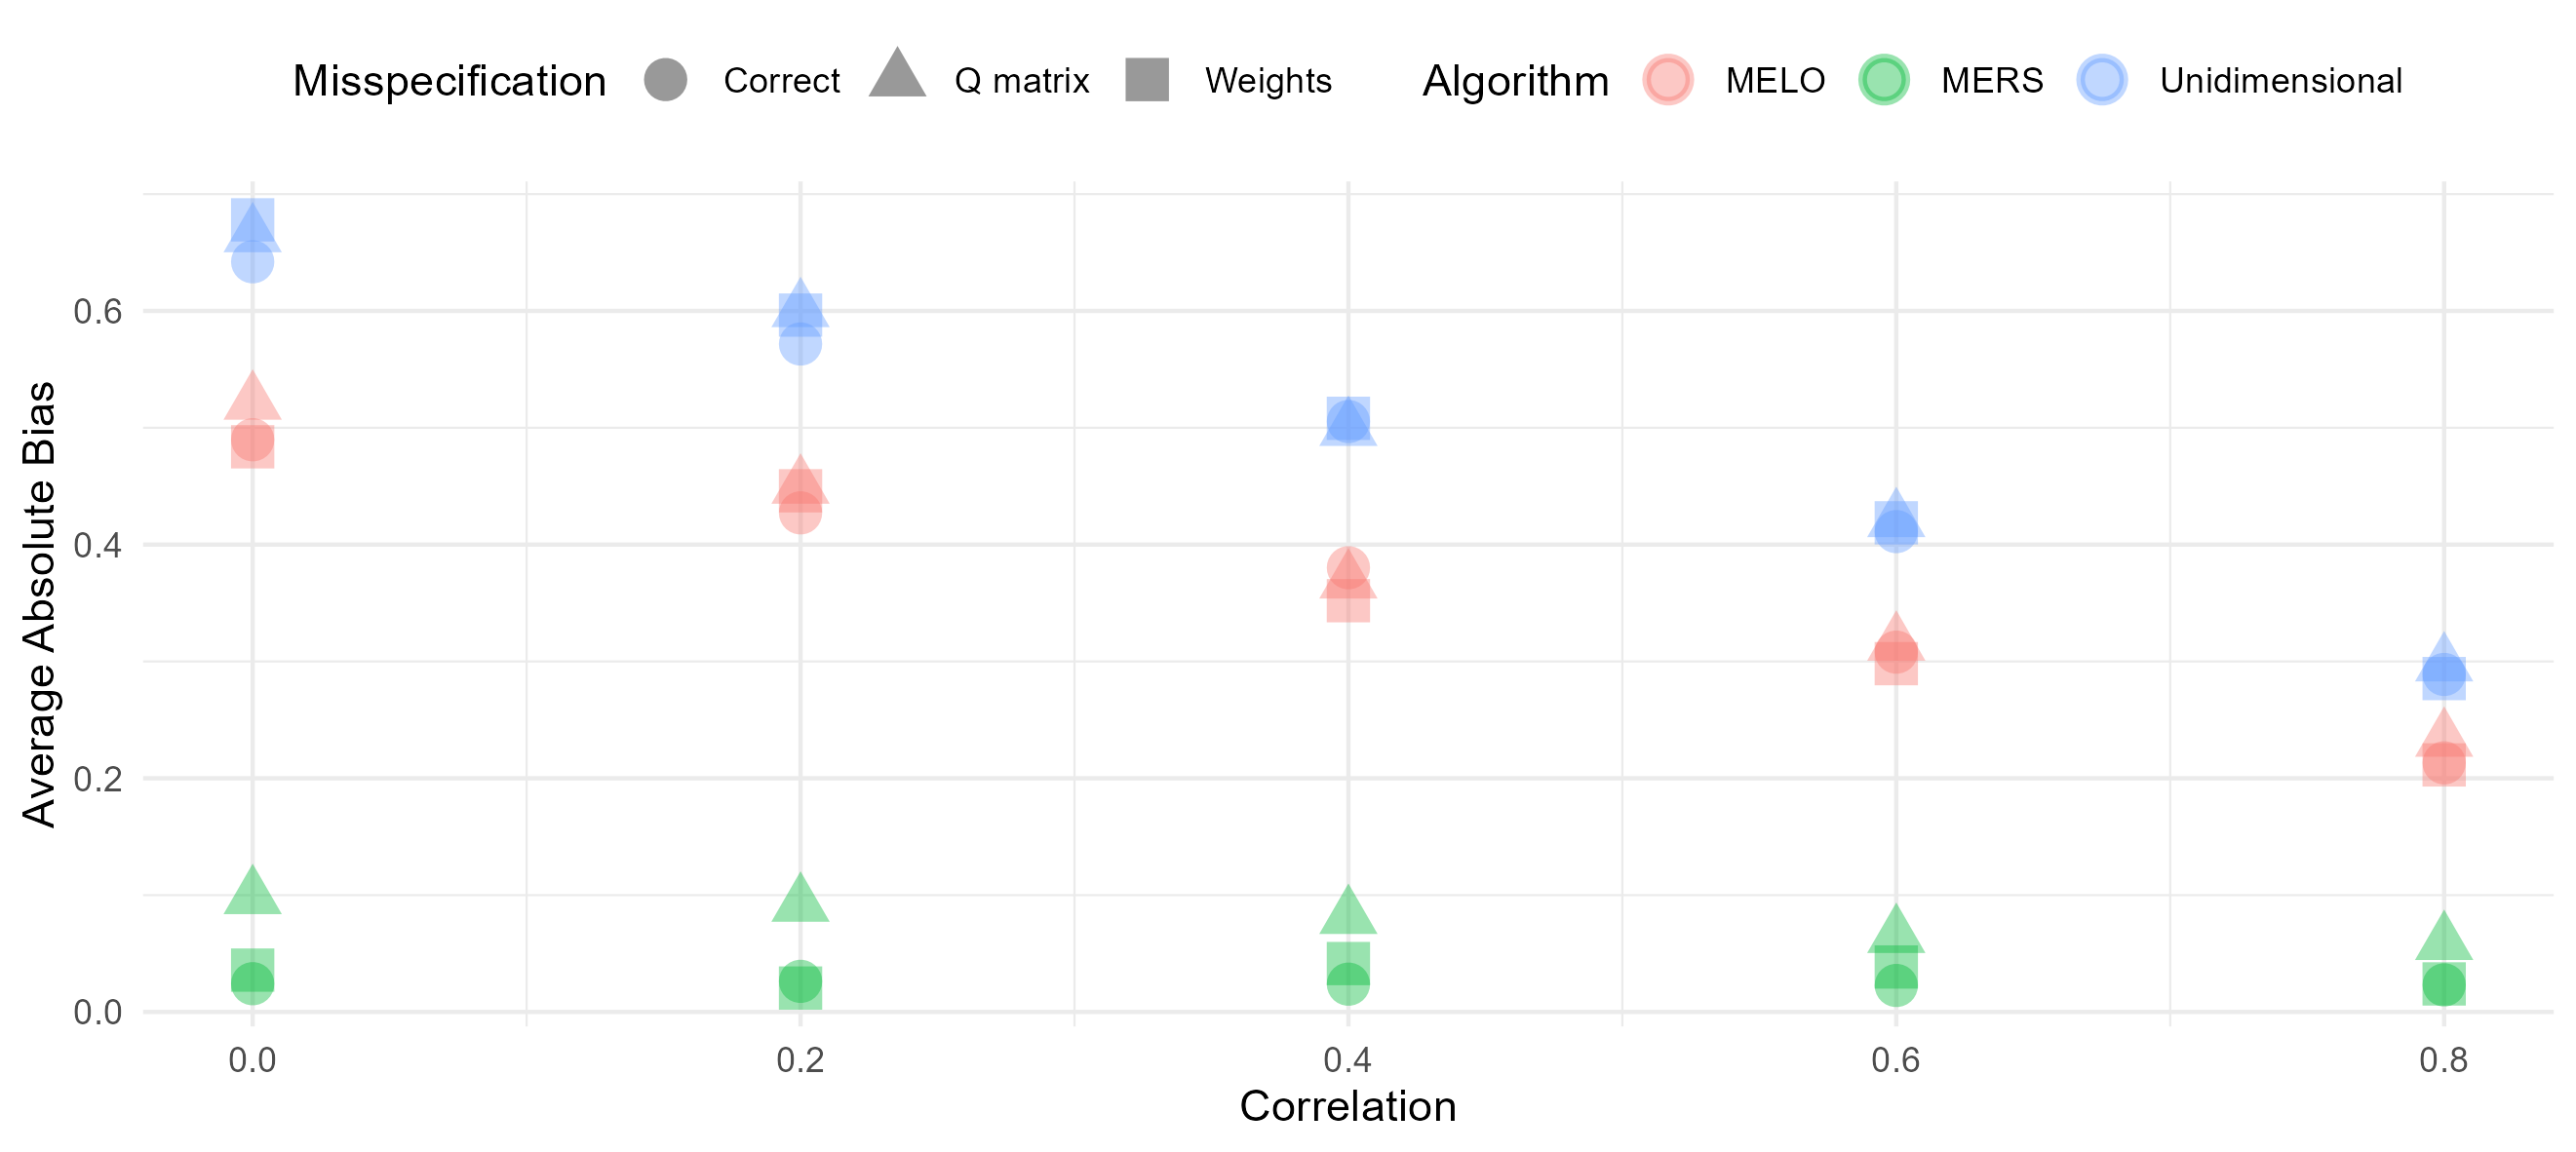
To investigate how the correlation between skills affects bias, we calculated the average absolute bias for each algorithm across different correlation conditions. The results are presented in Figure 4, which shows that the absolute bias for the MERS remains small and does not vary significantly across the different correlation scenarios. In contrast, both the MELO and the unidimensional ERS, showed noticeable bias (more even so for the unidimensional ERS than the MELO). Interestingly, as the correlation between the skills increased, the absolute bias for both of these algorithms decreased. This trend is expected for the unidimensional ERS, where a higher correlation between the skills allows the ERS to better represent the underlying abilities as a single dimension, improving its performance and reducing bias.
The inward bias observed in the MELO and the unidimensional ERS can be problematic since it has been suggested that learners with high skill levels benefit from challenge while learners with lower skill levels benefit more from items more suited for their skill level. If learners skills are not correctly estimated, this might affect the item selection process, which might be especially problematic in the case of inward bias. However, it is possible that while there is some bias the rank ordering is correct. In such a scenario, the system can still perform optimal item selection based on the relative ranking of abilities, which is often the main goal of adaptive learning systems. As long as the rank order is maintained, even if the exact numerical values of the ratings are slightly biased, the system can still make effective decisions regarding which items to present to each student. For an optimal ERS algorithm, we need thus look at both the ordinal and numerical properties of the ratings. Note that bias becomes a much bigger obstacle in high-stakes situations where the ratings might be used to take educational decisions.
To see whether the algorithms obtain correct rank ordering of the abilities, we calculated the correlations between the true values and the means of the invariant distributions. Figure 5 shows that the MERS reached an almost perfect correlation, regardless of the correlation between the true values. The correlations for the MELO on the other hand were much lower, especially when the skills were not strongly correlated. Only when the correlation between the abilities is .8, a correlation higher than .95 is reached. These results indicate that beside a higher bias for the MELO compared to the MERS, the MELO also does not provide accurate measurement on ordinal level.
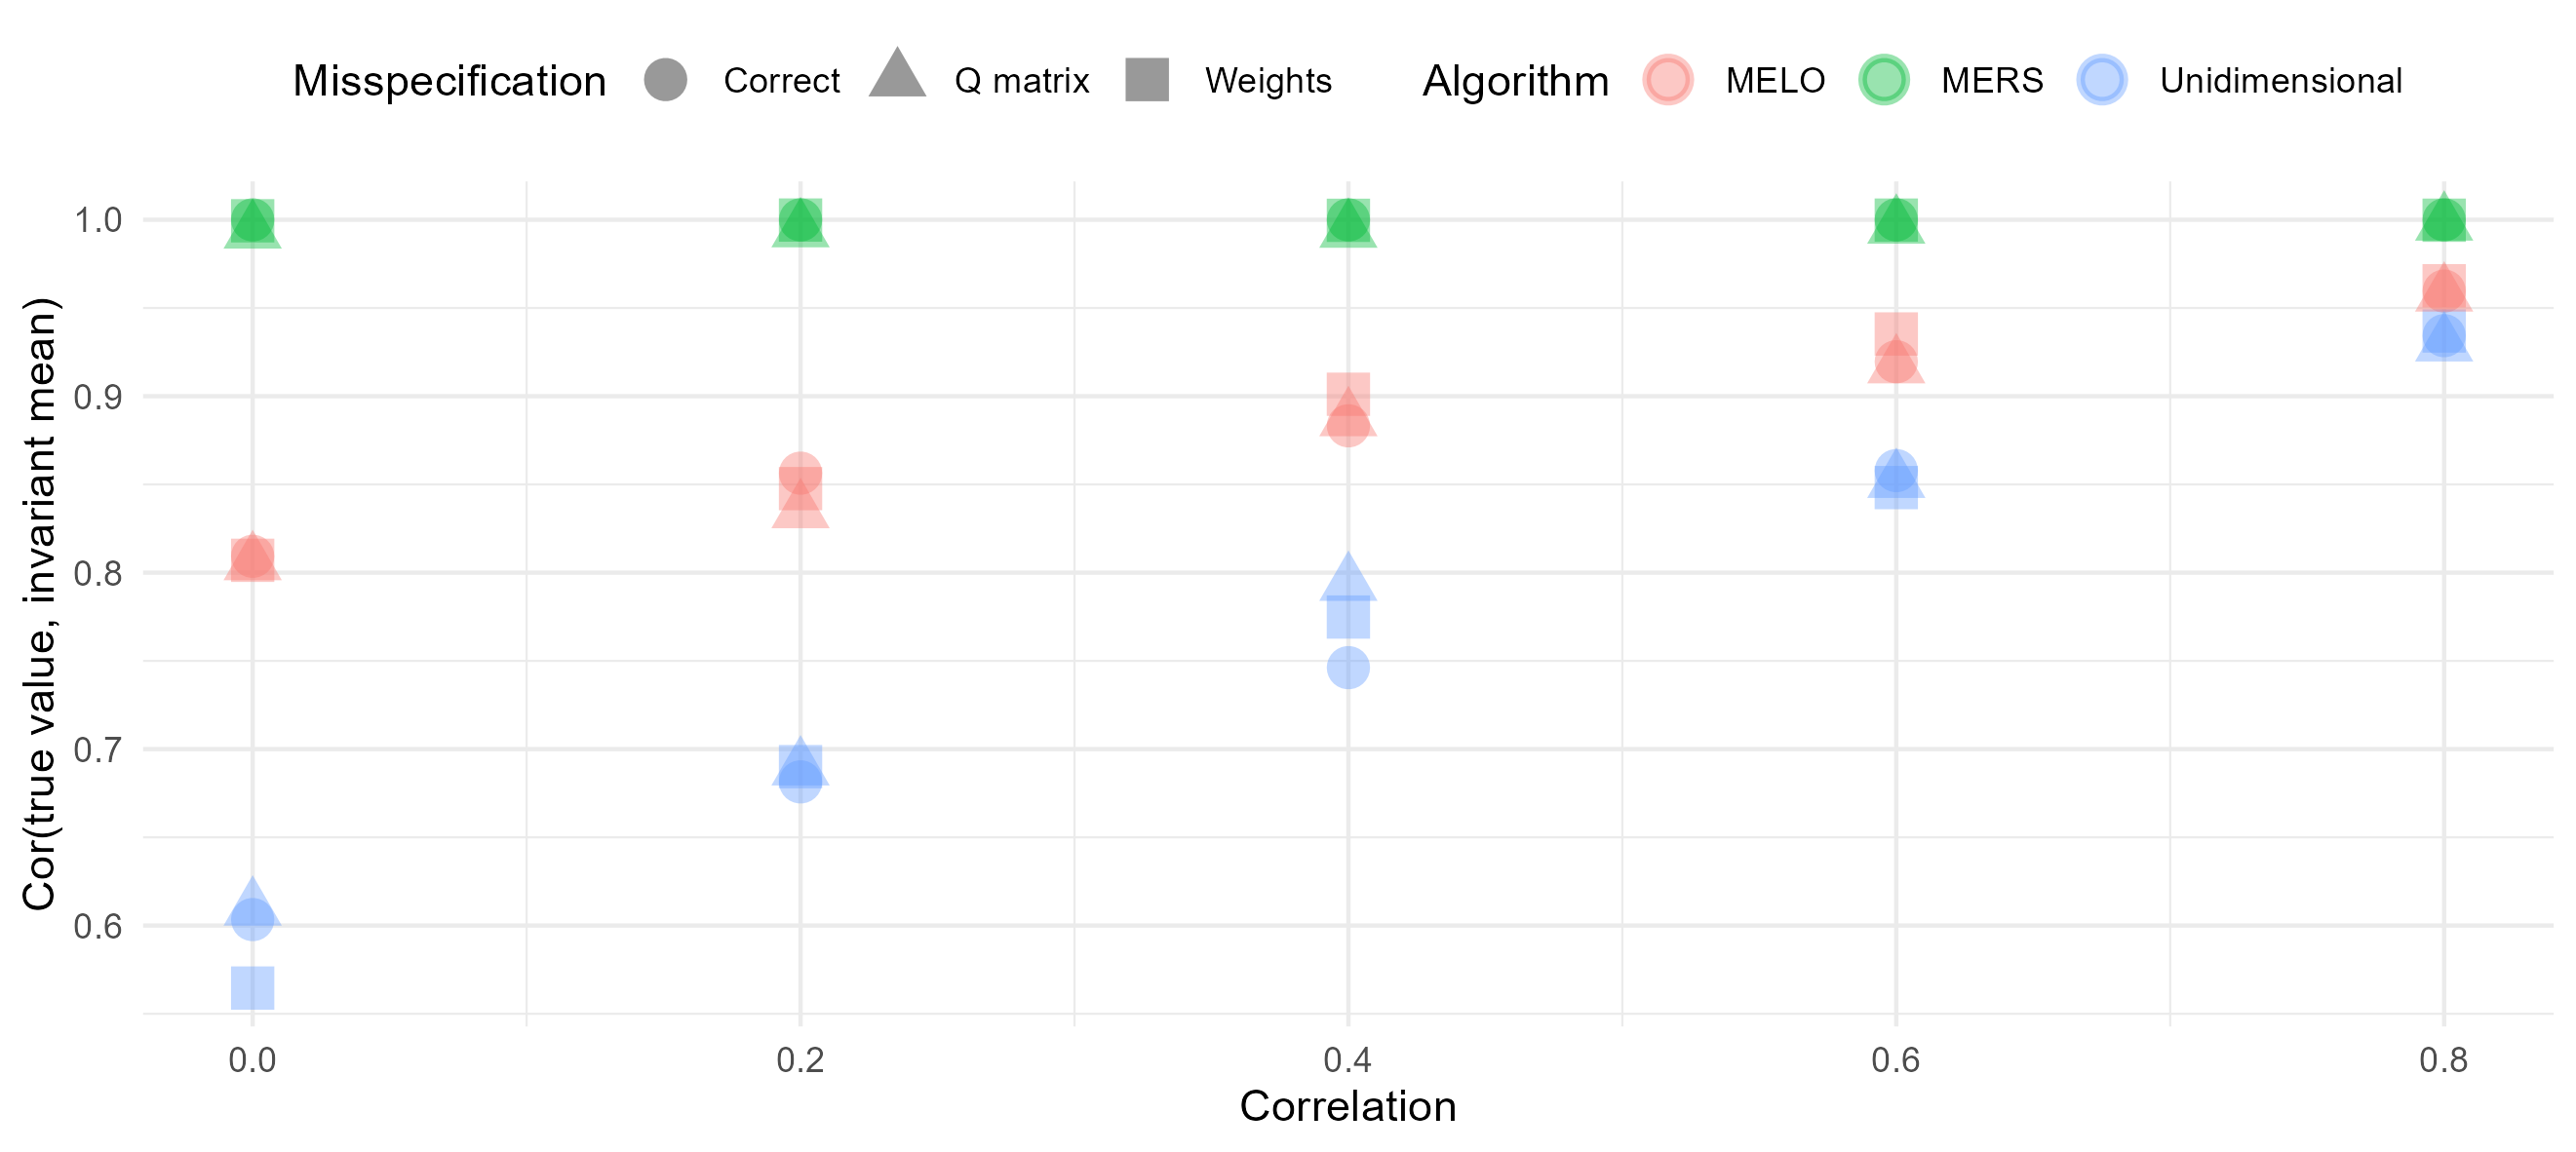
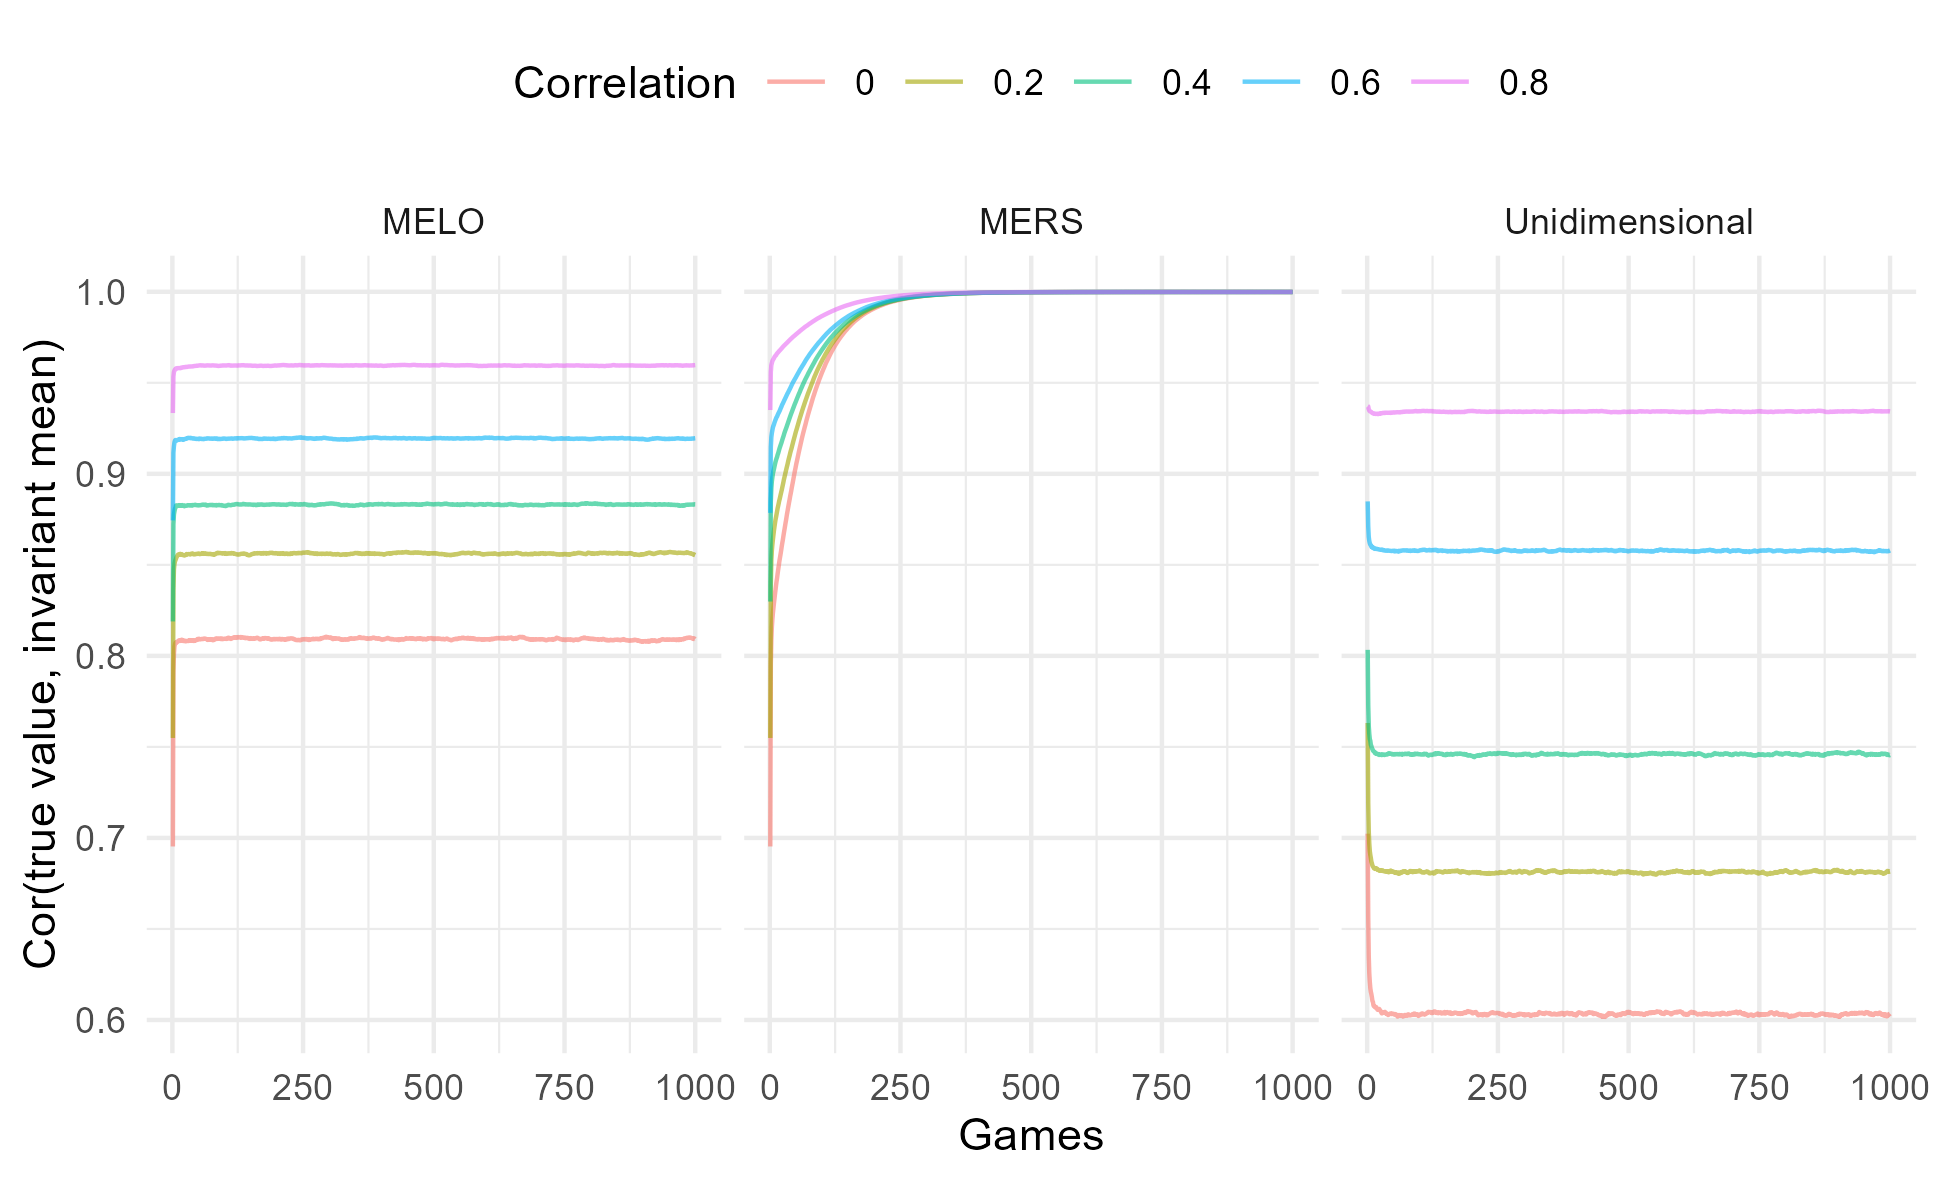
In addition, we looked at how the mean ratings (over replications) correlate with the true values at different time points. This provides insight into how well the algorithms’ ratings align with the true ability values as the simulation progresses. As expected, the MERS showed a slow but steady increase, eventually reaching an almost perfect correlation for all correlation conditions. In contrast, the MELO demonstrated a plateau effect, where the correlation with the true values reached a maximum but never exceeded 0.96, regardless of the correlation condition. Interestingly, the unidimensional ERS exhibited an even more peculiar pattern. The correlation between the mean ratings and the true values slightly decreased over time, with this process being more pronounced for the lower correlation conditions. This could be due to the unidimensional model’s inability to accurately capture the multidimensional nature of the skills involved, leading to a deterioration of the correlation as the learning environment unfolds.
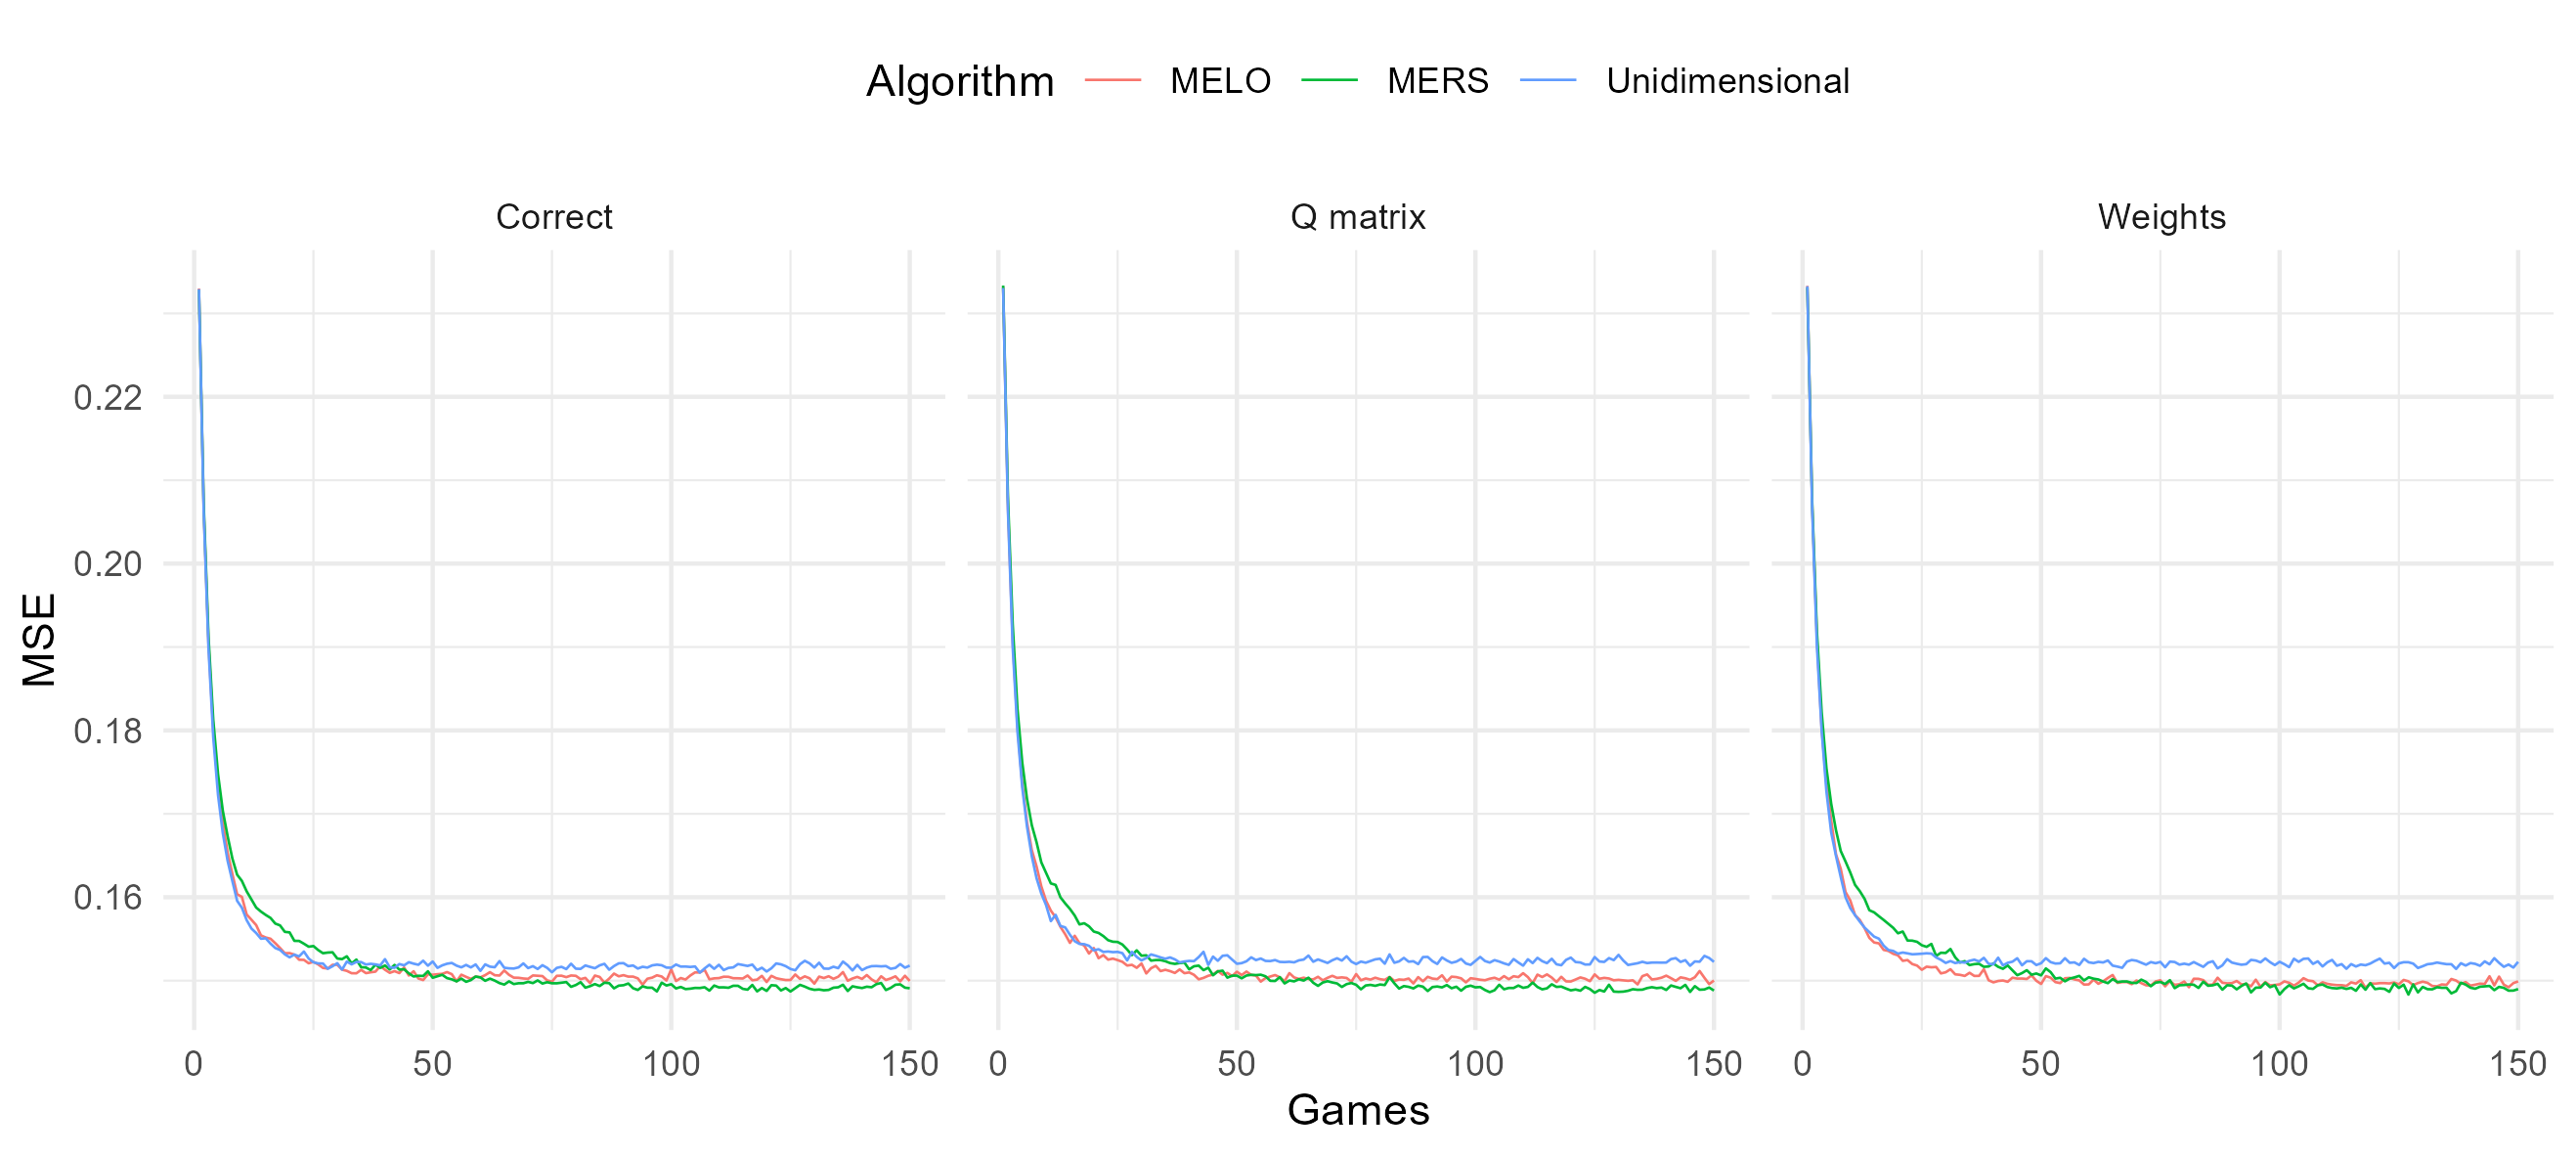
While hitting time, unbiasedness, and measurement precision are all important properties of a student model used in a learning environment, one of the most important things to consider is the prediction accuracy. The ERS is often implemented in adaptive learning environments, where we aim to select items given a certain success rate. If ratings are far off from their true values, this might influence the item selection process. To assess the prediction accuracy of the models, we calculated the MSE of prediction for each game averaged over persons and replications. The MSE is a common metric for evaluating student model performance, where a larger MSE indicates a higher discrepancy between the predicted and actual outcomes. In our simulation, starting ratings were initialized at zero, which means that the ratings began far from the true values, as such we expected high initial MSE values. Figure 7 shows the MSE over time for the different algorithms for the condition with a .6 correlation between the skills. The results align with our hypothesis: initially, the MSE values were high, but they decreased rapidly as the algorithms updated their ratings. When the algorithms had correctly specified weights, the MELO exhibited a faster reduction in MSE at the beginning, however, after approximately 45-50 games, the MERS catched up and ultimately achieved a lower MSE compared to the MELO, maintaining this advantage for the remainder of the games. This pattern suggests that while the MELO is initially more responsive to changes, the MERS outperforms it over time, providing more accurate predictions in the long run. 3
Interestingly, the unidimensional ERS shows a similar trend. At the start, it had a slightly lower MSE than the MERS, indicating better prediction accuracy early on. However, as the simulation progressed, the advantage of the unidimensional ERS disappeared. This suggests that, although the unidimensional ERS may be slightly better at the start, it struggles to further improve prediction accuracy as it does not capture the full multidimensional nature of the data as effectively as the MERS.
4.2 MERS with misspecified weights
For the previous analyses, we assumed an ideal condition where the weights used in the algorithms were correctly specified. From Figure 4 and Figure 5 it is clear that both misspecification scenarios do not drastically impact the bias and rank ordering of the algorithms. However, if we take a closer look, it is clear that the MERS suffers more from a misspecified Q-matrix structure than from incorrectly specified weights. A stronger bias emerged, and bias in the ratings was no longer independent of the correlation conditions. Interestingly, this bias was no longer linear, as can be seen in 8. In contrast to the outward bias previously observed with correctly specified weights, here we see that bias mostly affected higher-skilled individuals who will be systematically underestimated, while for lower-skilled individuals the bias is less pronounced. This nonlinearity in the bias can also be observed if we look at the traceplot of the mean ratings in 9. While for lower-skilled individuals the ratings stabilized close to the true ratings (showing a similar pattern as we observed for the MERS when there is no misspecification), some of the lower skilled individuals had ratings that stabilize around a value lower than their true skill level.
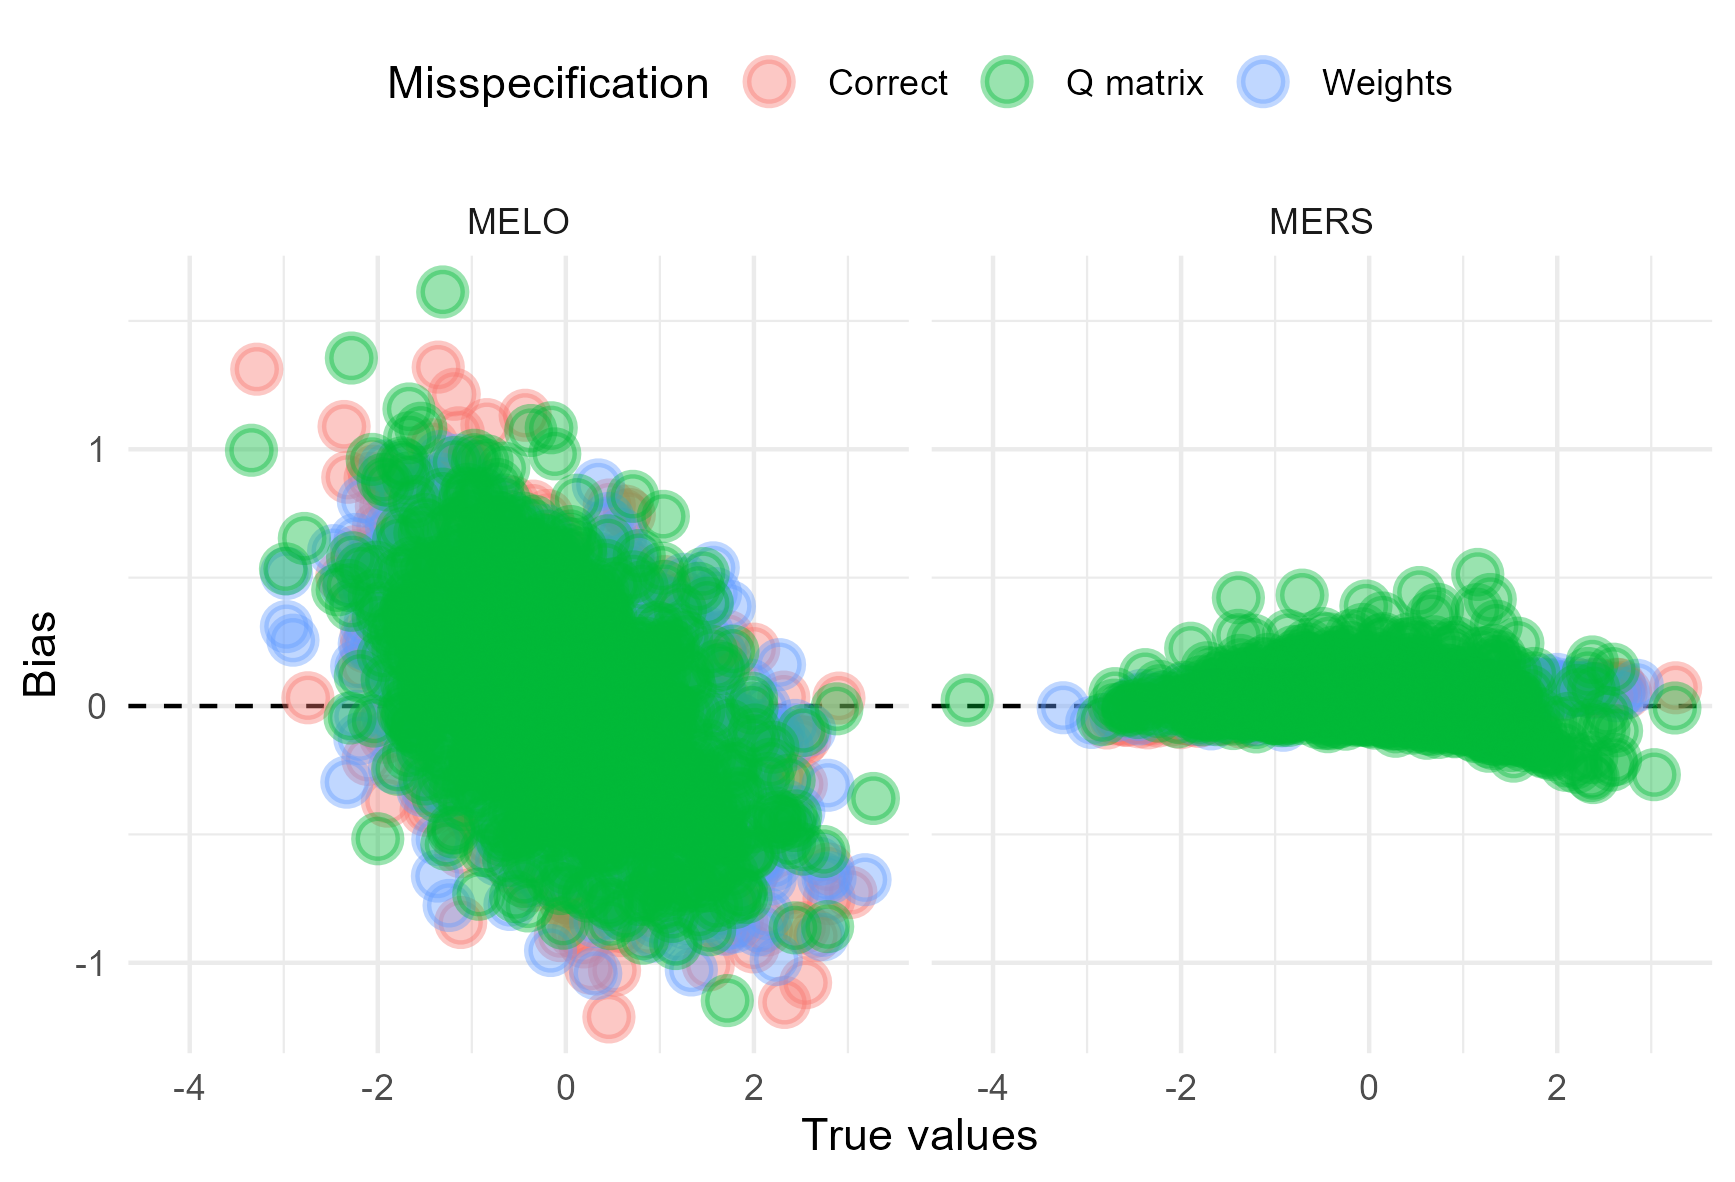
In contrast, misspecification of the weights or the Q-matrix did not seem to influence the bias of the MELO algorithm as much. A possible explanation can be found in the structure of the updating rules used by the MELO. In the MELO algorithm, the weights are not involved in the updating rules for the persons’ ratings. This means that the algorithm is less sensitive to the accuracy of the weight specifications, and therefore, the misspecification of weights has a minimal effect on its ratings. Another explanation is that even when the MELO algorithm uses a correct Q-matrix, its performance in terms of bias is already suboptimal. The algorithm tends to exhibit a high level of bias compared to MERS, and misspecifying the Q-matrix or weights simply does not exacerbate this issue that much.
Another interesting finding is that when the weights were misspecified the MERS and MELO did not differ that much in predictive accuracy as demonstrated in Figure 7. A possible explanation for this is that while the MERS is affected by misspecified weights, the weights are not used in the updating rule for the learner abilities in the MELO. Still, the prediction accuracy of the MERS remains slightly better than that of the other two algorithms. Overall, these observations highlight the robustness of the MERS to specification errors in terms of weights and Q matrix structure.
5. DISCUSSION
In this study we performed a simulation to compare the measurement properties of two multidimensional ERS algorithms, in terms of their ability to handle multidimensional data using key performance metrics, including prediction accuracy, speed of convergence, bias, and variance of the ratings. In addition, we included the unidimensional ERS as baseline to the analyses. This allowed us to make conclusions about the necessity of multidimensional extensions to the ERS when confronted with multidimensional data. Our findings revealed that while the MELO resulted in faster hitting times compared to the MERS, it exhibited significantly more bias, had worse prediction accuracy and performed worse in terms of maintaining the rank ordering of the persons. Nevertheless, despite its worse performance compared to MERS, the MELO is a superior alternative to the unidimensional ERS.
In addition, we found that even given misspecifications of the weights or the structure of the Q-matrix, the MERS still outperforms both the MELO and the unidimensional ERS on all metrics except speed of convergence. Our findings show that when the skills involved in the item are correctly identified, assuming a weight of 1/2 on both skills even though the true weights deviate from 1/2 and the skills are not equally important does not drastically impact the performance of the algorithm. This robustness is particularly valuable because determining the correct loadings for items is challenging, as it typically requires extensive item calibration, a process that can be time-consuming and resource-intensive, especially when large item banks are involved. The resilience of the MERS against misspecifications in the Q-matrix eliminates the complex task of constructing a perfect Q-matrix, streamlining the process of skill measurement in educational environments. A simplified Q-matrix can be adopted without sacrificing much in terms of prediction accuracy and rank order maintenance.
While the MERS produces more accurate ratings and demonstrates robustness against misspecification, a disadvantage is that it takes a considerable amount of games to converge to the invariant distribution. In addition, MSE values show that the MELO has a better prediction accuracy for the first 45–50 trials, indicating that it is initially better suited for adaptive item selection. However, as mentioned earlier, although the MELO stabilizes faster, it does so around values far from the true ratings, leading to lower prediction accuracy on average. Similarly, the unidimensional ERS also exhibits better prediction accuracy early on in the estimation process. This initial slower decrease in MSE is a disadvantage of the MERS, especially in learning environments. Lower prediction accuracy can affect item selection, potentially leading to disengagement and increased dropout rates. Therefore, future studies are needed to explore performance of the MERS in combination with extensions aimed at faster escaping this cold start, such as an adaptive K function [39, 40] or obtaining more accurate start ratings from historical data (i.e., a ‘hot’ start). Another avenue is to explore the possibility of combining both algorithms. Specifically, the MELO could be used at the start of the estimation process to take advantage of its initial better prediction accuracy, after which we transition to the MERS which would result in less bias and obtaining correct rank order. This hybrid method would allow taking advantage of the strengths of both algorithms throughout the learning process.
The results of our study are promising, particularly in showing that the multidimensional extensions outperform the unidimensional ERS when data is multidimensional. However, it is important to recognize that our findings are based on specific conditions and assumptions. For instance, in all simulations we implemented a fixed \(K\)-value. Further research is needed to explore the effect of a dynamic \(K\) function, particularly in combination with a multidimensional ERS extension, as this could potentially lead to more efficient convergence towards the true values and more accurate estimates across a wider range of conditions.
Additionally, our simulations assumed that ability levels remain constant throughout the study, which was done to evaluate the asymptotic behavior of the ratings. In a real learning environment, however, student abilities are expected to change and evolve over time. To better mirror the dynamic nature of the learning process, future studies should investigate the impact of fluctuating ability levels. Given its slow initial convergence it is to be expected that the MERS will also struggle to adapt to sudden changes in ability levels, something an adaptive \(K\)-function might be able to solve as it would allow the MERS to dynamically adjust the \(K\)-value based on what happens with the ratings which would improve its responsiveness. Furthermore, to keep the simulation design simple, we only looked at random item selection. In most adaptive learning environments, however, items are selected with a certain success rate (e.g., aiming for .75% probability correct). Expanding the scope of the simulations to include these factors will enhance the applicability of the findings to real-world applications.
Despite its limitations, our study highlights the importance of thoroughly investigating the measurement properties of any ERS extension in the literature before its implementation in real world settings. Although the MERS and the MELO may appear quite similar at first glance (both being build on the compensatory MIRT model), our findings reveal substantial differences in their performance with each their strengths. These distinctions highlight the need for careful considerations of the algorithms in different contexts in order to be able to make informed decisions. While our results suggest superiority of the multidimensional ERS extensions over the unidimensional approach when confronted with multidimensional data, implementing these algorithms in learning environments is not straightforward. Practical challenges include a higher complexity as implentation might require the system to keep track of more skills and update more ratings at the same time. The operational demands of developing and maintaining a multidimensional ERS extension are directly linked to the complexity of the skill structure involved in the items. Defining the Q-matrix, especially in learning environments with vast item banks, can become time consuming and expensive. In addition the algorithm might be less intuitive for parents and teachers who are important stakeholders in adaptive learning environments. The motivational impact of the algorithm is another important factor. Our results showed that the MERS in its initial stages has worse prediction accuracy than the MELO which might result in the selection of items that are too difficult or too easy, contributing to disengagement and drop-out. This reinforces the importance of considering a hybrid algorithm that initally relies on the MELO and transitions to the MERS as prediction accuracy reaches desirable values.
References
- S. Abdi, H. Khosravi, S. Sadiq, and D. Gasevic. A multivariate elo-based learner model for adaptive educational systems. In C. F. Lynch, A. Merceron, M. Desmarais, and R. Nkambou, editors, Proceedings of The 12th International Conference on Educational Data Mining (EDM 2019), pages 228–233, 2019.
- S. Abdi, H. Khosravi, S. Sadiq, and D. Gasevic. A multivariate elo-based learner model for adaptive educational systems. arXiv preprint arXiv:1910.12581, 2019.
- J. E. Beck and B. P. Woolf. High-level student modeling with machine learning. In International Conference on Intelligent Tutoring Systems, pages 584–593. Springer, 2000.
- M. L. Bernacki, M. J. Greene, and N. G. Lobczowski. A systematic review of research on personalized learning: Personalized by whom, to what, how, and for what purpose (s)? Educational Psychology Review, 33(4):1675–1715, 2021.
- M. Bolsinova, B. Gergely, and M. Brinkhuis. Keeping elo alive: Evaluating and improving measurement properties of learning systems based on elo ratings. preprint, 2024.
- W. Bonifay. Multidimensional item response theory. Sage Publications, 2019.
- M. J. Brinkhuis, A. O. Savi, A. D. Hofman, F. Coomans, H. L. van Der Maas, and G. Maris. Learning as it happens: A decade of analyzing and shaping a large-scale online learning system. Journal of Learning Analytics, 5(2):29–46, 2018.
- K. Chrysafiadi and M. Virvou. Student modeling approaches: A literature review for the last decade. Expert Systems with Applications, 40(11):4715–4729, 2013.
- A. T. Corbett and J. R. Anderson. Knowledge tracing: Modeling the acquisition of procedural knowledge. User modeling and user-adapted interaction, 4:253–278, 1994.
- M. Csikszentmihalyi. Flow: The psychology of happiness. Random House, 2013.
- J. de la Torre and C.-Y. Chiu. A general method of empirical q-matrix validation. Psychometrika, 81:253–273, 2016.
- E. L. Deci and R. M. Ryan. Handbook of self-determination research. University Rochester Press, 2004.
- B. Deonovic, P. Chopade, M. Yudelson, J. de la Torre, and A. A. von Davier. Application of cognitive diagnostic models to learning and assessment systems. In M. von Davier and Y.-S. Lee, editors, Handbook of Diagnostic Classification Models: Models and Model Extensions, Applications, Software Packages, pages 437–460. Springer, 2019.
- A. E. Elo. The rating of chessplayers, past and present. Arco Pub., 1978.
- L. M. Hvattum and H. Arntzen. Using elo ratings for match result prediction in association football. International Journal of forecasting, 26(3):460–470, 2010.
- S. Klinkenberg, M. Straatemeier, and H. L. van der Maas. Computer adaptive practice of maths ability using a new item response model for on the fly ability and difficulty estimation. Computers & Education, 57(2):1813–1824, 2011.
- Y. Long, K. Holstein, and V. Aleven. What exactly do students learn when they practice equation solving? refining knowledge components with the additive factors model. In Proceedings of the 8th International Conference on Learning Analytics and Knowledge, pages 399–408, 2018.
- F. Martin, Y. Chen, R. L. Moore, and C. D. Westine. Systematic review of adaptive learning research designs, context, strategies, and technologies from 2009 to 2018. Educational Technology Research and Development, 68:1903–1929, 2020.
- C. Neumann, J. Duboscq, C. Dubuc, A. Ginting, A. M. Irwan, M. Agil, A. Widdig, and A. Engelhardt. Assessing dominance hierarchies: validation and advantages of progressive evaluation with elo-rating. Animal Behaviour, 82(4):911–921, 2011.
- J. Nižnan, R. Pelánek, and J. Rihák. Student models for prior knowledge estimation. International Educational Data Mining Society, 2015.
- F. Ofori, E. Maina, and R. Gitonga. Using machine learning algorithms to predict students’ performance and improve learning outcome: A literature based review. Journal of Information and Technology, 4(1):33–55, 2020.
- F. Olmeda. Towards a statistical physics of dating apps. Journal of Statistical Mechanics: Theory and Experiment, 2022(11):113501, 2022.
- J. Ooge, J. De Braekeleer, and K. Verbert. Nudging adolescents towards recommended maths exercises with gameful rewards. In International Conference on Artificial Intelligence in Education, pages 328–335. Springer, 2024.
- J. Y. Park, F. Cornillie, H. L. Van der Maas, and W. Van Den Noortgate. A multidimensional irt approach for dynamically monitoring ability growth in computerized practice environments. Frontiers in psychology, 10:620, 2019.
- P. I. Pavlik Jr, H. Cen, and K. R. Koedinger. Performance factors analysis–a new alternative to knowledge tracing. Online Submission, 200:531–538, 2009.
- R. Pelánek. Applications of the elo rating system in adaptive educational systems. Computers & Education, 98:169–179, 2016.
- R. Pelánek. Bayesian knowledge tracing, logistic models, and beyond: an overview of learner modeling techniques. User Modeling and User-Adapted Interaction, 27:313–350, 2017.
- R. Pelánek. Managing items and knowledge components: domain modeling in practice. Educational Technology Research and Development, 68(1):529–550, 2020.
- R. Pelánek. Adaptive learning is hard: Challenges, nuances, and trade-offs in modeling. International Journal of Artificial Intelligence in Education, 35:304—-329, 2025.
- R. Pelánek, J. Papoušek, J. Řihák, V. Stanislav, and J. Nižnan. Elo-based learner modeling for the adaptive practice of facts. User Modeling and User-Adapted Interaction, 27:89–118, 2017.
- K. Pliakos, S.-H. Joo, J. Y. Park, F. Cornillie, C. Vens, and W. Van den Noortgate. Integrating machine learning into item response theory for addressing the cold start problem in adaptive learning systems. Computers & Education, 137:91–103, 2019.
- G. Rasch. Studies in mathematical psychology: I. Probabilistic models for some intelligence and attainment tests. Nielsen & Lydiche, 1960.
- M. D. Reckase. The past and future of multidimensional item response theory. Applied Psychological Measurement, 21(1):25–36, 1997.
- C. P. Rosé, E. A. McLaughlin, R. Liu, and K. R. Koedinger. Explanatory learner models: Why machine learning (alone) is not the answer. British Journal of Educational Technology, 50(6):2943–2958, 2019.
- S. Tasharrofi and J. Barnes. Optimizing community supervision practices with the elo-rating system: A proof-of-concept. Justice Evaluation Journal, 5(2):288–306, 2022.
- R. Van Schoors, J. Elen, A. Raes, and F. Depaepe. An overview of 25 years of research on digital personalised learning in primary and secondary education: A systematic review of conceptual and methodological trends. British Journal of Educational Technology, 52(5):1798–1822, 2021.
- S. Vanbecelaere, K. Van den Berghe, F. Cornillie, D. Sasanguie, B. Reynvoet, and F. Depaepe. The effectiveness of adaptive versus non-adaptive learning with digital educational games. Journal of Computer Assisted Learning, 36(4):502–513, 2020.
- H. Vermeiren, A. Hofman, M. Bolsinova, W. Van Den Noortgate, and H. van der Maas. Computerized adaptive literacy learning, 2024. Preprint.
- H. Vermeiren, A. D. Hofman, M. Bolsinova, H. L. van der Maas, and W. Van Den Noortgate. Balancing stability and flexibility: Investigating a dynamic k value approach for the elo rating system in adaptive learning environments. 2024.
- H. Vermeiren, J. Kruis, M. Bolsinova, H. L. van der Maas, and A. D. Hofman. Psychometrics of an elo-based large-scale online learning system. Computers and Education: Artificial Intelligence, 8:100376, 2025.
- L. S. Vygotsky and M. Cole. Mind in society: Development of higher psychological processes. Harvard university press, 1978.
- K. Wauters, P. Desmet, and W. Van den Noortgate. Adaptive item-based learning environments based on the item response theory: Possibilities and challenges. Journal of Computer Assisted Learning, 26(6):549–562, 2010.
- H. Xie, H.-C. Chu, G.-J. Hwang, and C.-C. Wang. Trends and development in technology-enhanced adaptive/personalized learning: A systematic review of journal publications from 2007 to 2017. Computers & Education, 140, 2019.
- L. Yang, S. Dimitrov, and B. Mantin. Forecasting sales of new virtual goods with the elo rating system. Journal of Revenue and Pricing Management, 13:457–469, 2014.
1All data and analyses scripts are available on
OSF:https://osf.io/rqjb9/?view_only=bec5c19004c94aeb921f57dfb359dcdc
2Because for lower \(K\)-values not all persons’ ratings converged to the invariant distribution within 1000 time points, for the \(K\)-values .1-.3, the simulation was rerun with 1500 games instead of 1000 and hitting time was recalculated for this plot.
3To assess the performance stability of each algorithm, we computed the mean MSE over the final 800 games under correctly specified conditions, along with the corresponding 95% confidence intervals. MERS achieved the lowest mean MSE of 0.148856[0.148834,0.148877], indicating both high accuracy and low variability. MELO followed with a mean MSE of 0.150366 [0.150346,0.150387], while the unidimensional model reported a slightly higher error at 0.151623[0.151602,0.151644]. Although the absolute differences between algorithms are small, the narrow and non-overlapping confidence intervals suggest that the performance distinctions are statistically meaningful.
© 2025 Copyright is held by the author(s). This work is distributed under the Creative Commons Attribution-NonCommercial-NoDerivatives 4.0 International (CC BY-NC-ND 4.0) license.