ABSTRACT
Missing data presents a significant challenge in Educational Data Mining (EDM). Imputation techniques aim to reconstruct missing data while preserving critical information in datasets for more accurate analysis. Although imputation techniques have gained attention in various fields in recent years, their use for addressing missing data in education remains limited. This study contributes to filling the research gap by evaluating state-of-the-art deep generative models: Tabular Variational Autoencoder (TVAE), Conditional Tabular Generative Adversarial Networks (CTGAN), and Tabular Denoising Diffusion Probabilistic Models (TabDDPM) for imputing missing values using the Open University Learning Analytics Dataset (OULAD) with varying levels of missing data. These deep generative models identify relationships among demographic, behavioral, and partial assessment data to impute absent numerical assessment scores. TabDDPM showed the best imputation performance and maintained closer alignment with the original data, as demonstrated by the KL divergence and KDE plots. To further enhance predictive modeling performance with imputed data, this study proposes TabDDPM-SMOTE, which combines TabDDPM with the Synthetic Minority Over-sampling Technique (SMOTE) to tackle the class imbalance often encountered in educational datasets. Our TabDDPM-SMOTE model consistently achieves the highest F1-score when using the imputed data in XGBoost classification tasks, showcasing its strong efficiency and potential to enhance predictive effectiveness modeling.
Keywords
INTRODUCTION
Missing data is typically a challenge to data mining. It may occur due to errors in data collection [38], incomplete survey responses [34], equipment failures [44], privacy preservation [42], or incomplete attendance records [22]. For instance, missing exam scores can occur when students drop out.
Imputation techniques aim to reconstruct the missing values and preserve critical information in the datasets for more accurate analysis [1]. These techniques have gained attention in recent years in several fields, such as healthcare [31], image restoration [15], and industrial research [20]. For example, imputation techniques have been applied to fill in missing values in patient records in the healthcare industry [31]. In image restoration, Generative Diffusion Prior (GDP) [15] has been used to recover missing regions in occluded images, achieving high-fidelity reconstruction while preserving structural details. However, their application for addressing missing data in education remains limited.
Educational data is often presented in tabular formats [6], including numerical data such as scores and attendance. However, the effectiveness of data imputation techniques in handling missing data in structured tabular datasets presents unique complexities due to heterogeneous relationships [6].
In educational data mining (EDM) research, historical data is crucial in predicting or correlating student performance [10] [11]. However, missing data can present challenges when building accurate predictive models.
Deep generative models, including Tabular Variational Autoencoders (TVAE) [45], Conditional Tabular Generative Adversarial Networks (CTGAN) [45], and Tabular Denoising Diffusion Probabilistic Models (TabDDPM) [28], provide innovative solutions for imputing missing values while preserving statistical fidelity and feature relationships.
Furthermore, educational datasets often exhibit a class imbalance [19] in the target variable that the models aim to predict, where some target classes (e.g., student performance levels) have significantly fewer samples than others. This imbalance can bias predictive models toward the majority class, leading to suboptimal performance in predicting the minority class [13].
To address the class imbalance problem, our study introduced TabDDPM-SMOTE, which combines TabDDPM with the Synthetic Minority Over-sampling Technique (SMOTE) [16] to improve machine learning efficiency.
Despite these advances, deep learning use for data imputation has not been widely explored in education [41]. This study aimed to fill this gap by investigating the potential of these models in managing missing numerical data and improving the predictive capabilities of educational datasets. We proposed two research questions.
(1) How do different deep generative models perform at imputing missing values in educational tabular datasets?
(2) How do different deep generative models perform regarding machine learning efficiency when their imputed data is used for classification tasks?
Our findings showed that TabDDPM consistently produced imputed data that better preserved the original distribution. This was evidenced by lower KL divergence and KDE plots that closely matched the original data, even at high missing data levels.
Additionally, TabDDPM-SMOTE could address the class imbalance in the educational dataset and enhance machine learning performance, achieving the highest F1 scores compared to other deep generative models. These results demonstrated its effectiveness in reconstructing missing values and preserving essential feature relationships, enhancing subsequent predictive analyses' overall reliability in EDM.
The rest of the paper is organized as follows: Section 2 reviews related work, Section 3 explains the methodology, Section 4 presents results, Section 5 discusses findings, and Section 6 concludes with a summary.
Related Work
Missing data poses a significant challenge in data analysis, stemming from various sources such as human error, equipment failure, and incomplete responses during data collection [32]. The presence of missing data can severely bias analytical results and affect the performance of predictive models [14].
To better understand the causes of missing data and select appropriate imputation methods to recover them, researchers relied on Rubin’s categorization of missing data mechanisms [36]: Missing Completely at Random (MCAR), Missing at Random (MAR), and Not Missing at Random (NMAR). MCAR assumes that the missingness occurs randomly, MAR depends on observed variables, and NMAR is determined by unobserved variables, including the missing data.
Nijman et al. [33] reviewed 152 papers on clinical prediction models developed using machine learning methods from 2018 to 2019. They found that 36.8% of papers did not adequately report how they handled missing data, limiting reproducibility. Despite known limitations, 42.7% of the papers used deletion to handle the missing data, which introduces bias and overlooks potential data relationships. Only 5% of the papers employed multiple imputations for missing data handling.
Over time, researchers have developed a wide range of imputation methods, which can be divided into three groups [40]: conventional statistical techniques, machine learning approaches, and advanced deep learning methods.
Statistical methods, such as regression imputation and MICE (Multiple Imputation by Chained Equations) [43], were commonly used. Machine learning approaches, such as K-nearest neighbors (KNN) [4] and MissForest [39], have shown flexibility in adapting to different datasets [40].
Recent progress in deep learning has introduced models like Variational Autoencoder (VAE) [24] and Generative Adversarial Network (GAN) [17]. These methods utilize neural networks to model complex data distributions and impute missing values more precisely [40] [3].
Recent developments, such as Denoising Diffusion Probabilistic Models (DDPM) [18], have expanded the landscape of deep learning methods for data imputation. DDPM showed promise in imputing complex datasets while preserving the statistical relationships among variables.
However, despite these advances, the use of deep learning for data imputation remains relatively limited. A systematic review [41] examined 117 papers from 2010 to 2020 and found that only 6% of missing data imputation research used deep learning methods, suggesting a limited adoption rate in this field.
This gap is even more pronounced in educational research. Another review [3] examined papers on imputation research published between 2017 and 2024 and found that only two addressed imputation in education. Specifically, Khanani and Lawson [23] employed Predictive Mean Matching (PMM) [26] for educational data, while Omar et al. [21] used traditional machine learning methods like decision trees [35] and random forests [5]. None of these papers explored deep learning models, highlighting a significant opportunity to apply deep learning imputation approaches in education.
Given the constraints of current studies, a thorough comparison of state-of-the-art deep generative imputation models is needed. By exploring these models, our study fills the research gap in applying deep learning models to educational missing data imputation, leading to more accurate and reliable analyses in the field.
Methodology
Original Dataset
Our study utilized the Open University Learning Analytics Dataset (OULAD) [30] related to STEM online courses. We randomly selected a course labeled CCC, which comprises 1,936 records. The dataset includes 22 features categorized into demographic, behavioral, and assessment data, as summarized in Table 1.
The demographic data (features 1–6) provides information that describes the students. Feature 1 is gender, with 0 indicating male and 1 indicating female. Feature 2 represents the highest level of education, with values normalized to [0, 0.25, 0.5, 0.75, 1] corresponding to no qualification, below A-levels, A-levels, higher education, and postgraduate, respectively. Feature 3, age, is divided into three categories: 0 for 0–35 years, 0.5 for 35–55 years, and 1 for 55 years or older. Feature 4 reflects studied credits, scaled from 0 to 1. Feature 5 indicates disability status, where 0 means no and 1 means yes. Feature 6 counts the number of previous attempts at the course, providing insight into each student’s academic history.
The behavioral data (features 7–14) capture interaction information from the online course. Specifically, these features record the normalized number of clicks during eight assessments, measuring student engagement across various components of the course.
The assessment data (features 15–22) contain the normalized scores from eight assessments. The original scores, which range from 0 to 100, have been scaled to values between 0 and 1 to facilitate direct comparisons.
The target variable represents the final course outcome, with 1 signifying a passing grade and 0 indicating a failing grade. This binary variable was mainly used to evaluate machine learning performance in assessing the quality of imputed data for classification tasks.
ID | Type | Features | Value | Description |
|---|---|---|---|---|
1 | Demographic Data | Gender | [0, 1] | 0: Male 1: Female |
2 | Highest education level | [0, 0.25, 0.5, 0.75, 1] | 0: No qualification 0.25: Below A-levels 0.5: A-levels 0.75: Higher education 1: Postgraduate | |
3 | Age | [0, 0.5, 1] | 0: 0-35 years 0.5: 35-55 years 1: 55 years or above | |
4 | Studied credits | [0, 1] | Normalized from credits to [0, 1] | |
5 | Disability | [0, 1] | 0: No 1: Yes | |
6 | Number of times the student has attempted this course | [0 – 1] | Normalized from original number 0 to N to [0 – 1] | |
7–14 | Behavioral Data | Clicks across eight assessments | [0 – 1] | Normalized from original count 0 to N to [0 – 1] |
15–22 | Assessment Data | Scores across eight assessments | [0 – 1] | Normalized from original scores of 0-100 to [0 – 1] |
23 | Target | Final grade in the course | [0, 1] | 0: Fail 1: Pass |
Data Normalization
Since the original value ranges of features 6–22 are various, this study applied the Min-max scaler, a technique frequently adopted in EDM, to normalize the data to the continuous value ranging from 0 to 1.
The scaling process was performed using Equation 1, where and denote the maximum and minimum values of a given feature. represents a continuous value ranging from 0 to 1.
(1)
This normalization step ensures that all numerical features remain within a comparable scale and prevents features with larger ranges from disproportionately influencing model training.
Datasets with Missing Data
We generated four datasets with varying levels of missing data. Subsequently, we utilized them to create tabular numerical imputation data using various deep generative models.
First, we used a chi-square test [47] to identify the four most significant features (assessment scores 5–8). These features were selected to introduce missing data due to their high predictive importance to the final grade in the OULAD dataset.
We randomly deleted 20%, 40%, 60%, and 80% of the data in the assessment scores 5–8 to create four datasets with increasing levels of missing data. The missing data was limited to these selected features (assessment scores 5–8), while all other features (demographic, behavioral, and assessment scores 1–4) and the target variable (final grade) remained unchanged.
This controlled design allows for a systematic comparison of imputation techniques across varying levels of missing data while preserving the consistency of the dataset for reliable analysis.
Missingness Mechanism
Missing values were introduced by randomly deleting entries from selected important features (assessment scores 5–8). This setup approximated a MAR [36] mechanism, where random missingness depended on observed feature selection rather than completely random across all features.
Deep Generative Models
This study imputed the missing data using state-of-the-art deep generative models, TVAE [45], CTGAN [45], and TabDDPM [28]. These methods were selected because they are tailored to handle tabular data and have limited educational research applications [41]. We also propose TabDDPM-SMOTE to enhance machine learning efficiency.
TVAE
The TVAE [45] is a probabilistic model that extends the VAE framework [24] to capture the tabular data distribution. It consists of an encoder network that maps input data 𝑥 into a latent space representation 𝑧 and a decoder network that reconstructs the original input from this latent representation. By leveraging this structure, the TVAE captured the dependencies in tabular datasets.
In deep generative models, the loss function quantifies how well the model learns to generate data similar to the original [37]. A lower loss indicates better reconstruction and a more accurate learned distribution. The TVAE loss function was defined as Equation 2.
(2)
where represents the approximate posterior distribution of the latent variable 𝑧 given the observed data 𝑥, which the encoder network learns. The term denotes the probability of reconstructing 𝑥 given the latent representation 𝑧, as modeled by the decoder.
The first term, , represents the reconstructed data's expected negative log-probability, quantifying the reconstruction error. The second term, , measures the Kullback-Leibler (KL) divergence between the approximate posterior and the prior distribution , which is assumed to follow a standard normal distribution. The parameter is a regularization coefficient that balances the trade-off between reconstruction accuracy and the constraint on the latent space.
CTGAN
The CTGAN [45] is a generative model for synthesizing tabular data with mixed numerical and categorical features. It extends the conditional GAN-based model [17] framework by incorporating conditional information into the generator and discriminator, ensuring the preservation of feature dependencies and consistency across heterogeneous data types.
Let 𝐺 denote the generator, 𝐷 the discriminator, 𝑧 the input noise vector sampled from a prior distribution, and 𝑥 the original data. CTGAN introduces a conditional vector 𝑐, which encapsulates contextual information to guide the generator and discriminator.
The loss functions for the generator and discriminator are defined as Equations 3 and 4.
(3)
(4)
where represents the probability the discriminator assigns to an imputed sample and denotes the probability assigned to an original sample, both conditioned on the conditional vector 𝑐.
In Equation 3, the generator loss is formulated as , which represents the expected log-probability output by the discriminator when evaluating imputed samples. The generator is trained to maximize this expectation, making the imputed data as indistinguishable as possible from the original data. Formally, denotes the imputed data produced by the generator, conditioned on 𝑐, ensuring that the imputed data follows the statistical dependencies of the original dataset.
Equation 4 defines the discriminator loss , which consists of two components. The first term, , represents the expected log-probability assigned by the discriminator to an original data, reinforcing its ability to classify real data correctly. The second term, , accounts for the expected log-probability assigned to the imputed data, enhancing the discriminator’s ability to distinguish synthetic from original data.
The novelty of CTGAN is its conditioning of both the generator and discriminator on additional context to address intra-table dependencies. The generator loss is defined to maximize the discriminator’s output for generated samples, while the discriminator loss aims to accurately distinguish real from fake data. This approach allows CTGAN to handle the heterogeneity of tabular data.
TabDDPM
TabDDPM [28] is a diffusion-based model that applies the DDPM framework [18] to tabular data. It effectively handles mixed data types using Gaussian diffusion for continuous features and multinomial diffusion for categorical features.
This model operates in two stages: forward noising and reverse denoising processes. In the forward process, noise is gradually added to the original data over timesteps, transforming it into a fully noisy representation . The reverse process then iteratively removes noise, generating imputed samples that follow the statistical distribution of the original data.
Additionally, it optimizes noise scheduling specific to each feature type, contributing to its efficacy in high-dimensional and heterogeneous tabular datasets.
The total loss of TabDDPM is a combination of Gaussian diffusion loss for continuous features and averaged multinomial diffusion losses across categorical features, as shown in Equation 5.
(5)
where 𝐶 represents the number of categorical features. The first term, , accounts for the loss associated with continuous features, while the second term, , handles categorical features by averaging losses across all categorical variables.
(6)
The Gaussian diffusion loss function is shown in Equation 6, where represents the noisy data sample at timestep 𝑡, and is the predicted noise at that timestep, learned by a neural network parameterized by 𝜃. The term denotes the true noise added during the forward process, and the loss is computed as , corresponding to the Mean Squared Error (MSE) between the predicted and actual noise. This formulation ensures a smooth and stable training process.
TabDDPM uses a multilayer perceptron (MLP) with two hidden layers of size 128, a dropout rate of 0.1, and a time embedding dimension of 128 to parameterize the reverse process.
The training process involves optimizing the MLP using the Adam optimizer [25] with a learning rate of 10-3. The dataset is split into training and test sets with an 80:20 ratio. The model is trained for up to 300 epochs using a batch size of 128.
During training, the model processes mini-batches of data at each epoch. The loss computed as MSE between predicted and actual target values is used to update parameters. Early stopping is applied based on test loss, terminating training if no improvement is seen after 15 epochs, or if both training and test losses are sufficiently small and close. This setup helps ensure stable training and avoids overfitting.
TabDDPM-SMOTE
Our study introduced TabDDPM-SMOTE, an extension of TabDDPM that includes SMOTE [16]. SMOTE can address the class imbalance in educational datasets [12] [9]. This extension further enhances predictive modeling performance with imputed data.
Educational datasets are often imbalanced data. For example, in a dataset of student graduation grades, the Excellent category might include only below 10% of the data, while the Average category makes up 40% [2]. A significant class imbalance can bias the model toward predicting the majority class when using machine learning to predict student grades [13].
In our used OULAD dataset, the target variable (final grade) distribution is 663:1273 (pass-fail), which is imbalanced and may bias model performance toward the majority group.
Specifically, TabDDPM-SMOTE first imputes missing values using TabDDPM, then applies SMOTE to generate additional samples for minority classes and balance the class distribution. The imputed samples are generated based on the k-nearest neighbors of each minority class instance. Given a feature vector and one of its 𝑘-nearest neighbors , a new imputed instance is computed as Equation 7.
(7)
where gap is a random number drawn between 0 and 1, ensuring that the imputed sample is positioned on the linear interpolation between the original sample and its selected nearest neighbor.
SMOTE continuously generates synthetic samples for the minority class by interpolating between an original instance and a randomly chosen neighbor from its 𝑘-nearest neighbors. This process repeats until the required number of synthetic samples is created.
Moreover, we employed hyperparameter optimization [46] to determine optimal model settings. By combining TabDDPM’s generative capability with SMOTE’s ability to handle imbalanced data, TabDDPM-SMOTE provided an innovative approach that retains TabDDPM’s generative capability while enhancing its balance on minority class patterns in educational data.
Datasets with Imputed Data
Our study utilized the educational data in the OULAD dataset to impute missing numerical scores for assessments 5-8 (ranging from 0 to 1). We applied the deep generative models to four datasets containing 20%, 40%, 60%, and 80% missing data in these assessment scores.
Specifically, deep generative models were trained to capture relationships between three types of features: demographic information (gender, education level, age, credits, disability status, previous attempts), behavioral data (click counts across assessments), and available assessment scores (completed assessments 1-4 scores and partial original for assessments 5-8 scores).
This facilitated the imputation of the missing assessment 5-8 scores. Finally, each model produced four imputed datasets.
Model Training Configurations
The deep learning models were implemented using Python with PyTorch. Each model was trained for 300 epochs with a batch size of 128.
Moreover, an early stopping criterion was implemented to mitigate overfitting, monitor validation loss, and terminate training when no substantial improvement was observed over consecutive epochs.
Evaluation Measure
We utilized KL divergence [29] and Kernel Density Estimation (KDE) plots [8] to evaluate the imputation performance of TVAE, CTGAN, and TabDDPM. Afterward, we assessed machine learning efficiency on all models, including our proposed TabDDPM-SMOTE.
KL Divergence
This study used the KL divergence to quantitatively measure how the imputed probability distribution generated by the deep generative model deviates from the original distribution. It is defined as Equation 8.
(8)
where and represent the discretized densities of the original and imputed data, respectively. Lower KL divergence indicates that the imputed data is closer to the original distribution, reflecting better imputation quality.
KDE Plots
KDE plots visually represent the probability density for continuous variables, making them an effective tool for comparing the distributions of imputed and original data.
This study used KDE plots to assess how well the imputed values from TVAE, CTGAN, and TabDDPM align with the original data distribution. A more significant overlap between the KDE plots of the original and imputed data signifies better imputation performance, demonstrating the models' ability to capture the underlying data structure.
Machine Learning Efficiency
Machine learning efficiency was evaluated through the performance of imputed data in classification tasks [45]. Each deep generative model’s imputed datasets were used to train an XGBoost (XGB) classifier [7] to predict student pass/fail outcomes.
To maintain consistent conditions, 80% of the data was used for training, and 20% for testing. Additionally, 10-fold cross-validation [27] was applied within the training set to enhance the robustness of the model evaluation.
Predictive performance was measured using the F1-score, which is widely used for evaluating classification tasks [10]. The formula of the F1-score is defined as Equation 9.
(9)
where represents the proportion of correctly predicted positive instances among all predicted positives, while quantifies the proportion of actual positives correctly identified by the model. The F1-score combines both, providing a reliable measure of classification performance.
Higher F1 scores indicate that the imputed data retains the meaningful relationships present in the original data, reflecting its quality and utility for machine-learning tasks.
Results
KL Divergence Comparison
This study used KL divergence to evaluate how closely TVAE, CTGAN, and TabDDPM generated the imputed data.
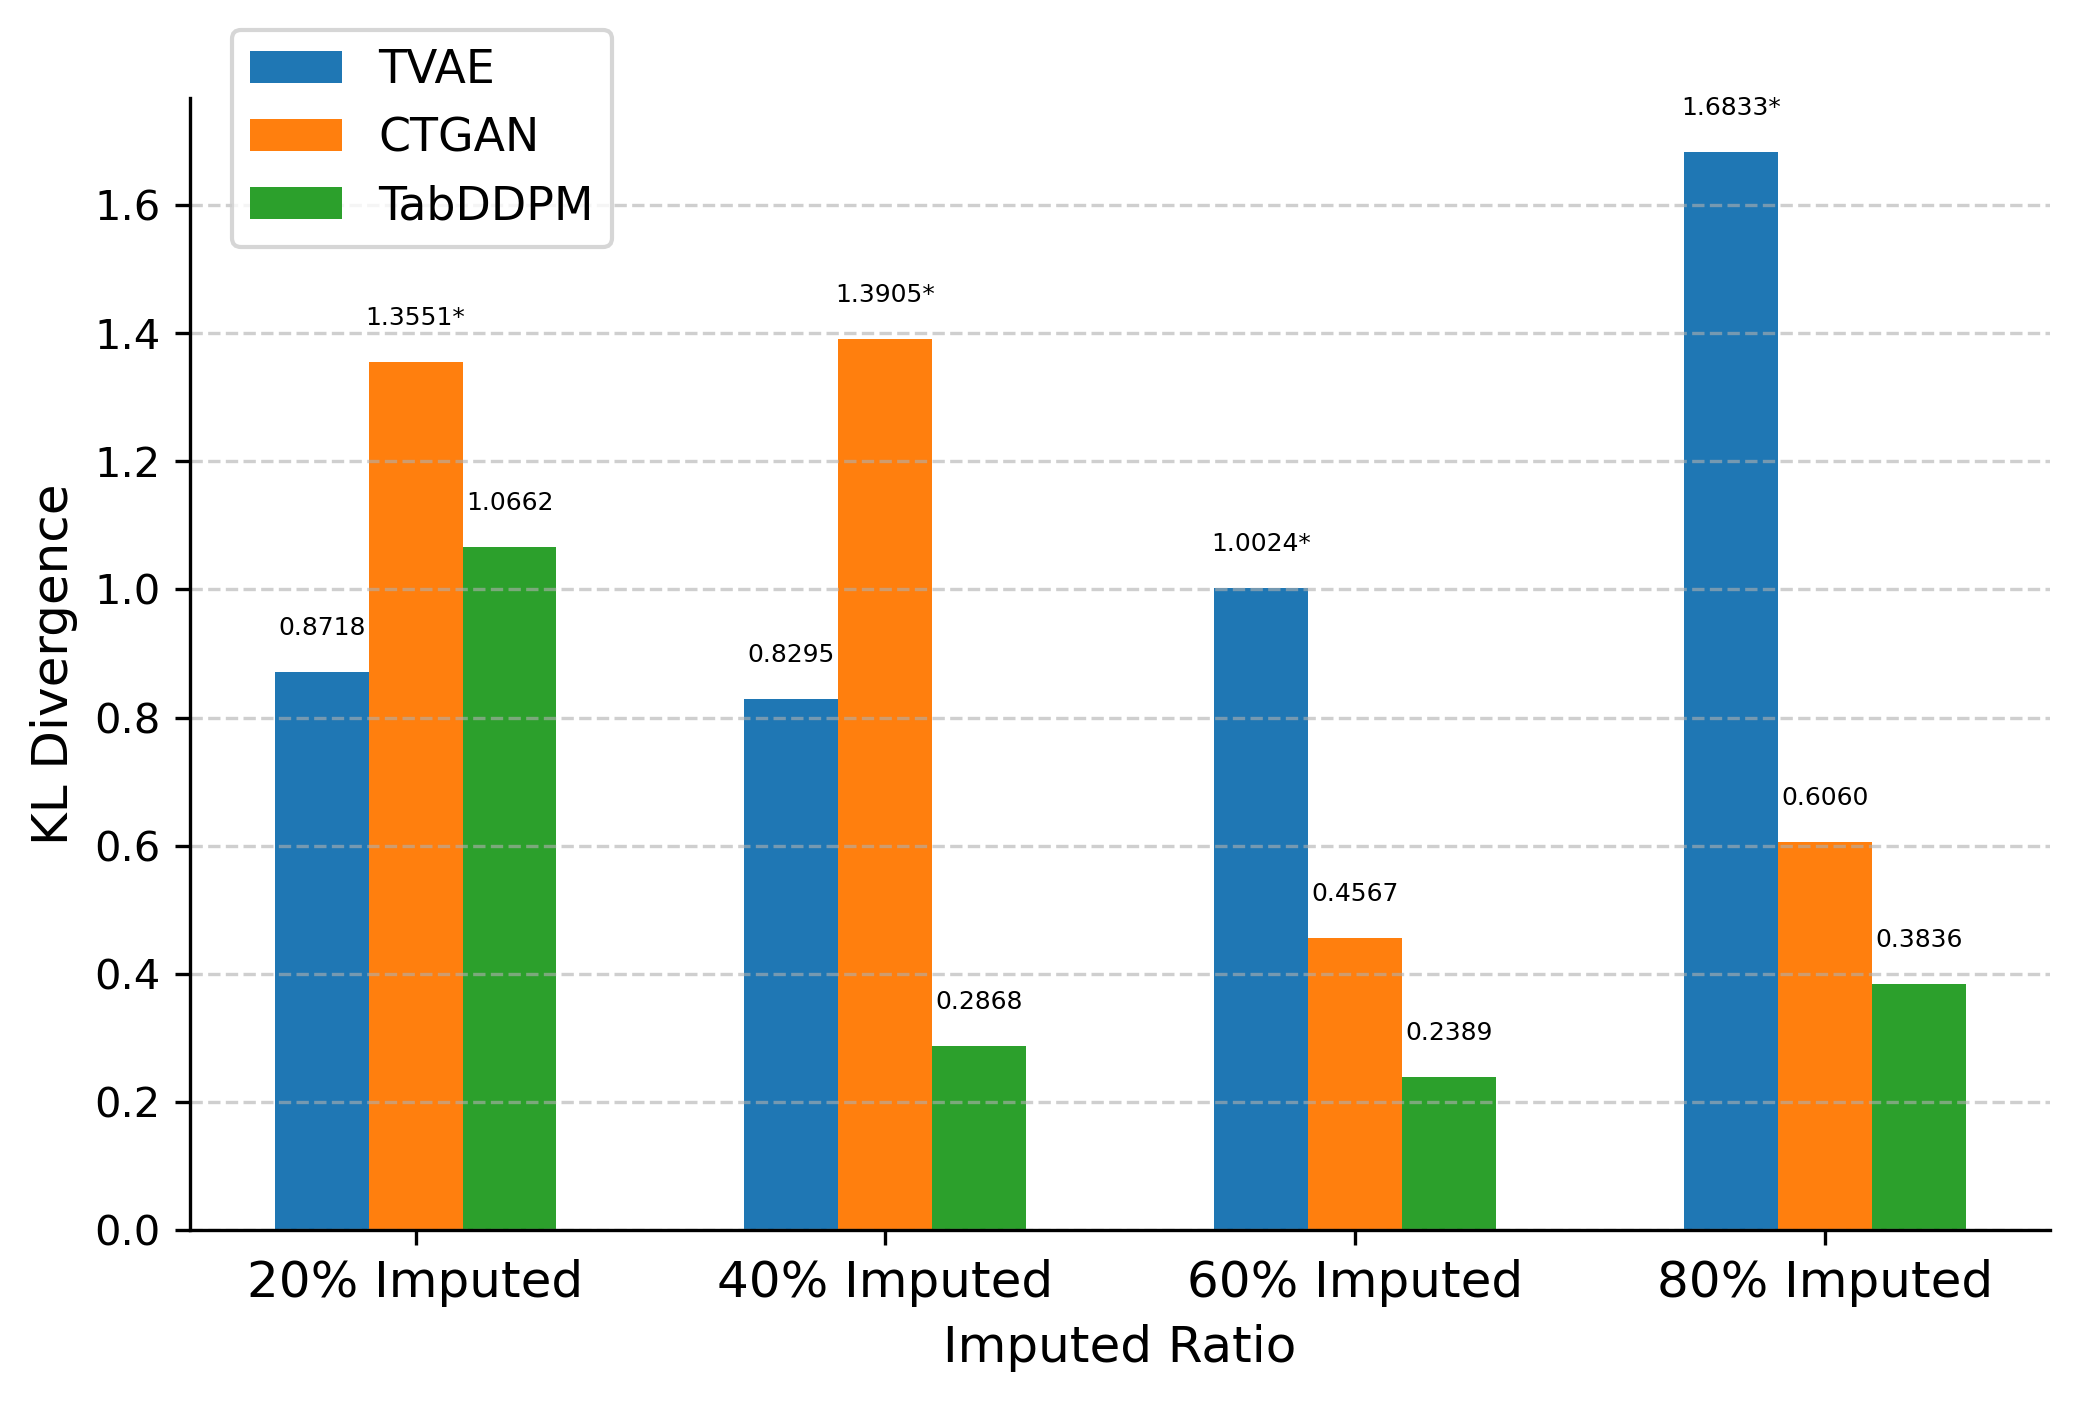
Table 2 and Figure 1 present the KL divergence results for assessment 8's score data. Similar imputation performance trends were observed in the imputed data of assessments 5–7, reinforcing the consistency of the models' behavior.
In the dataset with 80% original and 20% imputed data, TVAE achieved the lowest KL divergence (0.8718), demonstrating strong alignment. However, as the proportion of generated data increased, TabDDPM consistently outperformed the other models.
In the 40% imputed dataset, TabDDPM's KL divergence was significantly lower (0.2868) than TVAE (0.8295) and CTGAN (1.3905). This trend continued in the 60% imputed dataset, with TabDDPM maintaining a lower KL divergence (0.2389).
In the most challenging scenario, with the 80% imputed dataset, TabDDPM still exhibited the best performance (0.3836). TVAE (1.6833) and CTGAN (0.6060) showed considerable increases in KL divergence, indicating a decline in imputation quality as the proportion of generated data increased.
These results highlight TabDDPM's robustness in handling varying levels of missing data while preserving the underlying data distribution.
TVAE was competitive in scenarios with lower missing data (20% imputed dataset) but faced challenges as the proportion of imputed data increased. CTGAN consistently showed higher divergence, suggesting less effective imputation capabilities than the other models.
Model | 80% Original +20% Imputed | 60% Original +40% Imputed | 40% Original +60% Imputed | 20% Original +80% Imputed |
|---|---|---|---|---|
TVAE |
|
|
|
|
CTGAN |
|
|
|
|
TabDDPM |
|
|
|
|
*Asterisks indicate the best values in each imputed dataset
KDE Plots Comparison
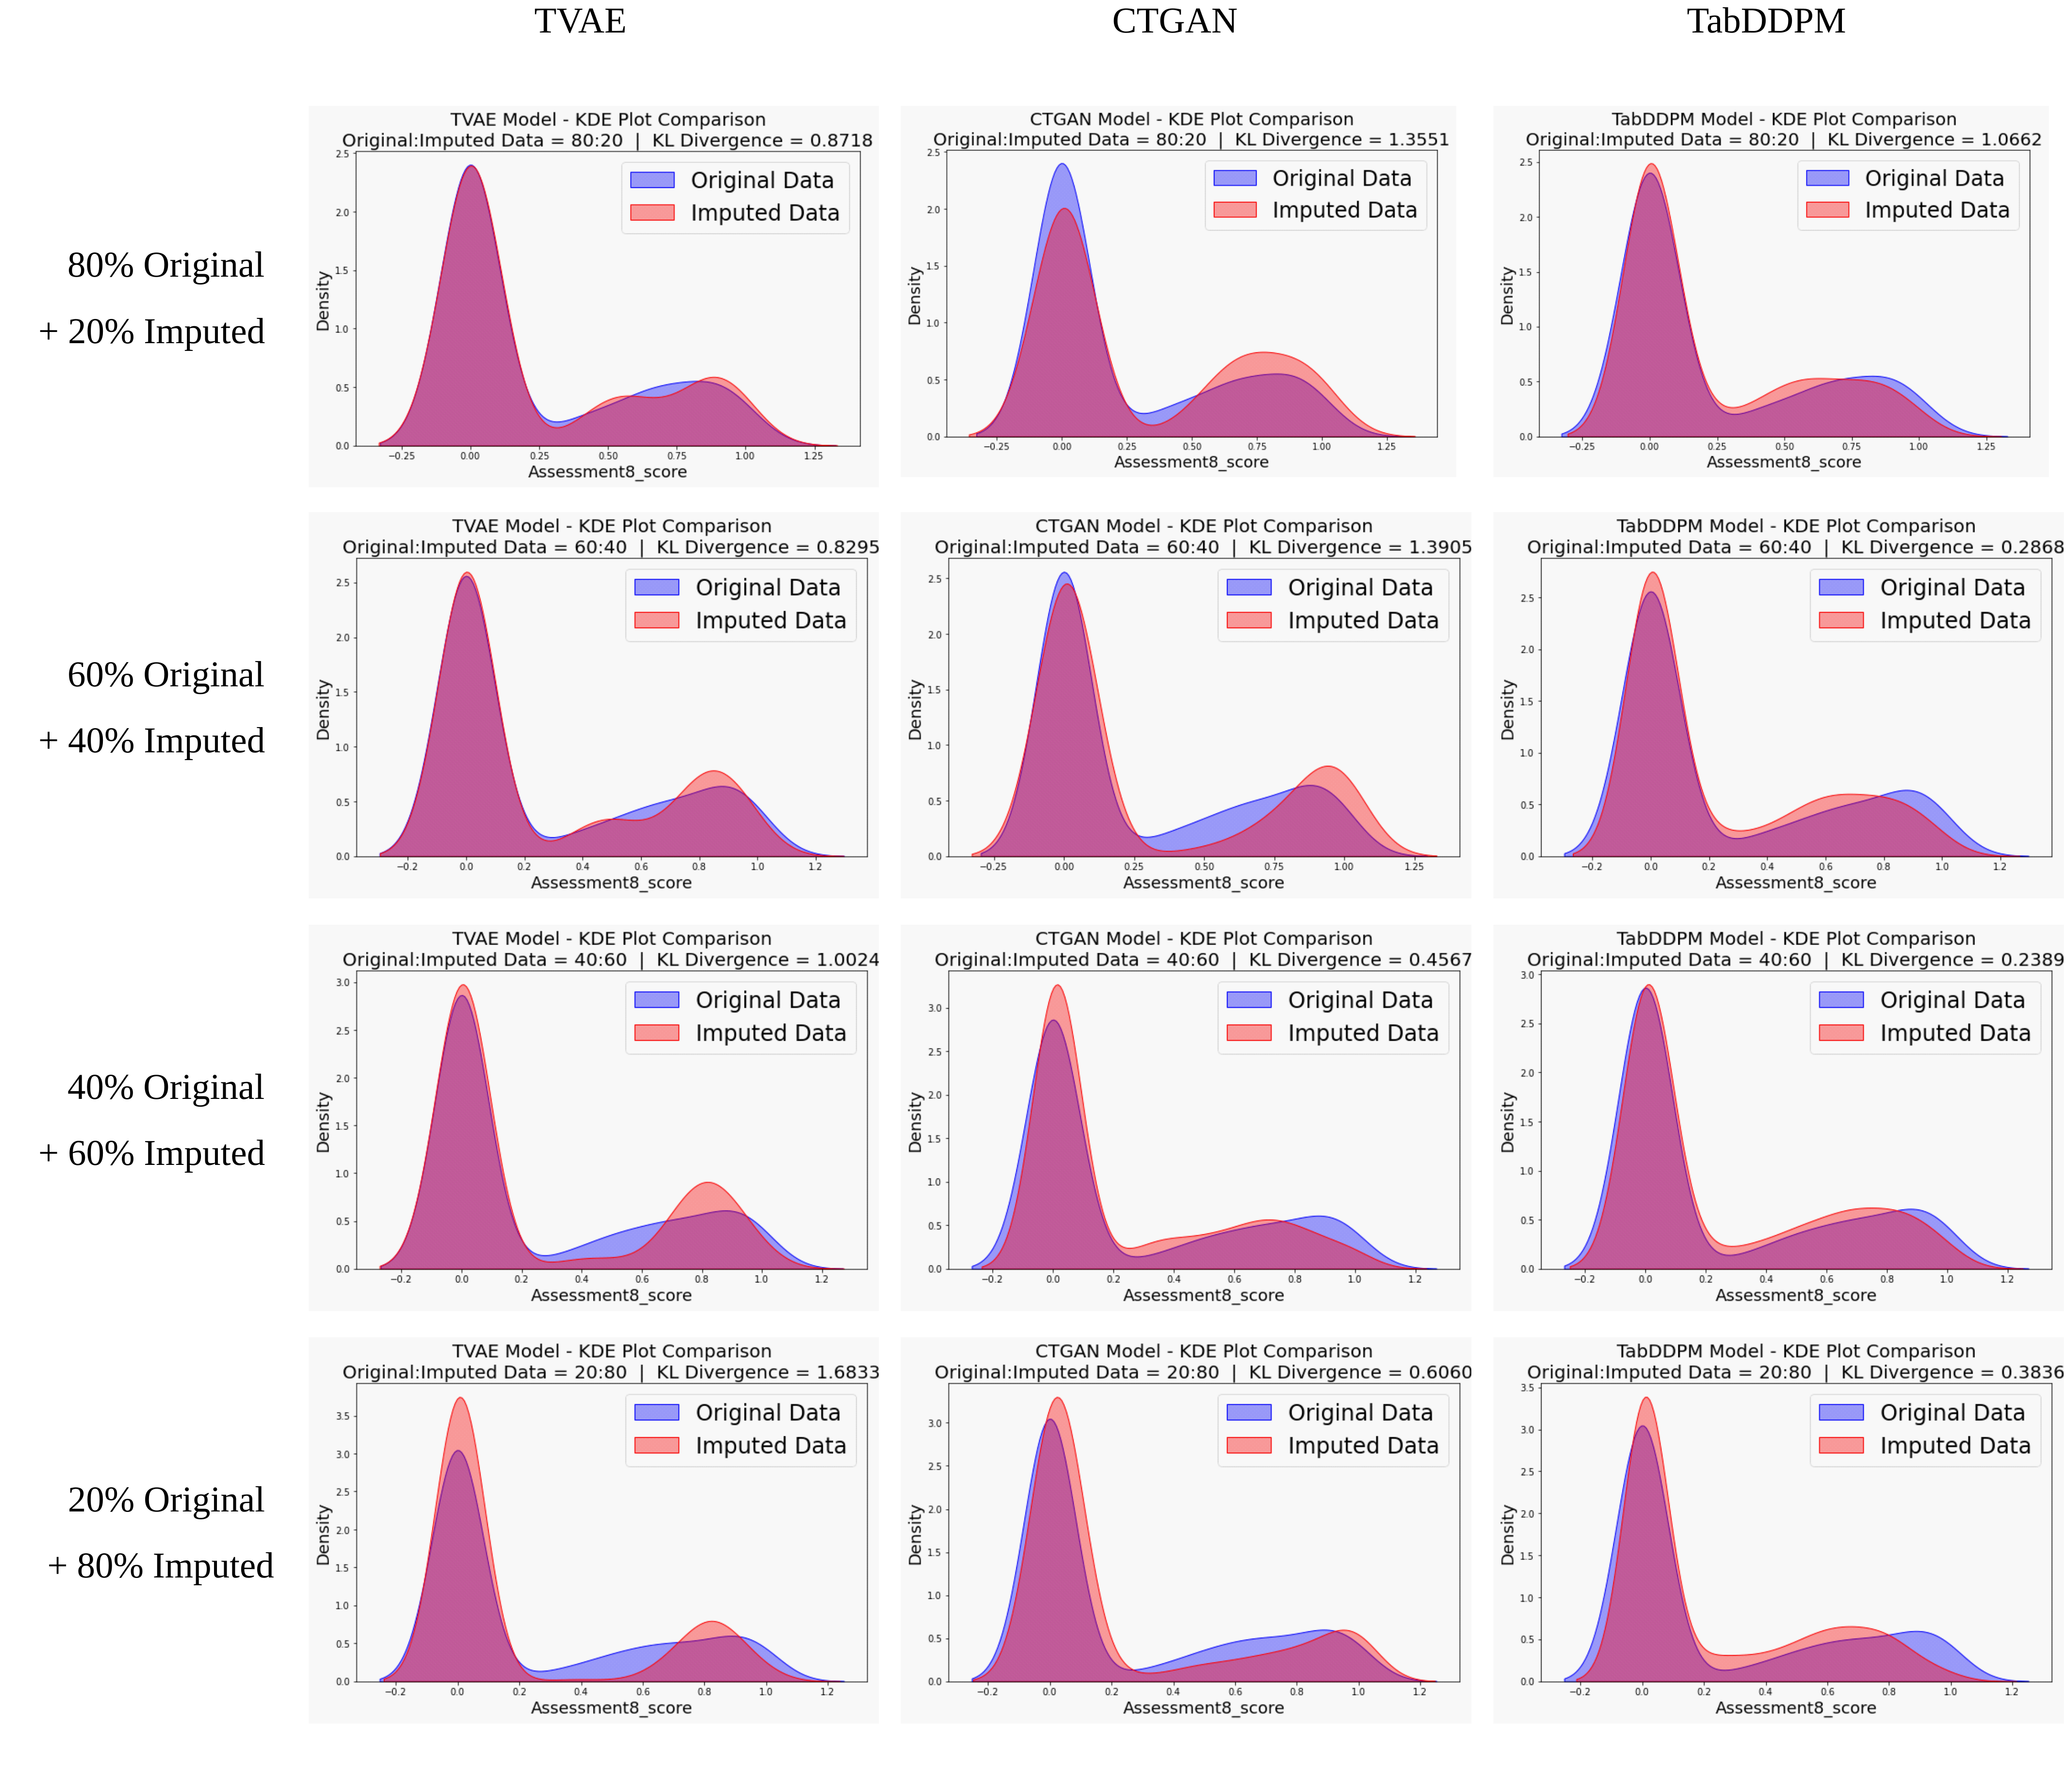
KDE plots visually compared the probability density for the score data of assessment 8 between the original (blue area) and imputed data (magenta area). Figure 2 illustrates how closely the imputed data from TVAE, CTGAN, and TabDDPM aligned with the original data distribution as the proportion of imputed data increased.
TVAE showed strong alignment at 80% original and 20% imputed dataset. However, its ability to capture the full distribution declined as the proportion of original data decreased, with noticeable deviations in the tail regions in the 80% imputed dataset.
CTGAN faced challenges consistently aligning with the original data, with discrepancies around the peaks and tails even at lower missing data levels (20% and 40% imputed datasets). Despite slight intermediate-level improvement, CTGAN's performance deteriorated as the proportion of imputed data increased, revealing instability in capturing the underlying distribution.
TabDDPM exhibited the best performance across most scenarios. At 40% and 60% of imputed datasets, TabDDPM's KDE plots significantly overlapped with the original data, effectively capturing both peaks and tails. Even at an 80% imputed dataset, TabDDPM maintained better alignment than TVAE and CTGAN, preserving the original data's underlying structure despite increasing missing data.
The KDE plots confirmed the trends observed in the KL divergence analysis. These results highlighted TabDDPM's strength in accurately imputing missing values while preserving the overall data distribution.
Machine Learning Efficiency Comparison
To verify the quality of the four datasets containing different proportions of imputed data, we applied an XGB model to evaluate a binary classification problem.
We used demographic, behavioral, and assessment scores (including imputed data from assessments 5–8) as the input features to predict the target variable (final grade).
The F1-score of the entirely original dataset was 0.9320, which was used as the comparison baseline.
Model | 80% Original +20% Imputed | 60% Original +40% Imputed | 40% Original +60% Imputed | 20% Original +80% Imputed |
|---|---|---|---|---|
TVAE |
|
|
|
|
CTGAN |
|
|
|
|
TabDDPM |
|
|
|
|
TabDDPM-SMOTE |
|
|
|
|
*Asterisks indicate the highest values in each imputed dataset
Table 3 presents the results of machine learning efficiency. When using 80% original data and 20% imputed data, TabDDPM maintained a high F1 Score (0.9310), only slightly below the performance of the entirely original dataset (0.9320). This reflects its ability to preserve data quality with a small proportion of imputed data. TabDDPM-SMOTE further improved (0.9324) upon this, surpassing the original dataset. In contrast, TVAE (0.9147) and CTGAN (0.9110) achieved lower F1 Scores.
At the 40% imputed dataset, TVAE (0.9178) and CTGAN (0.9122) showed improved F1-scores, while TabDDPM (0.9252) and TabDDPM-SMOTE (0.9257) experienced a slight decline. However, TabDDPM-SMOTE remained the best-performing model, effectively handling class imbalance.
In the scenario with 60% imputed data, TVAE showed a slight drop (0.9078), whereas CTGAN improved further (0.9164). TabDDPM also increased (0.9278), reaffirming its stability in handling higher proportions of generated data. Again, TabDDPM-SMOTE outperformed all other models, achieving the best F1-score (0.9333).
In the most challenging case, with 80% imputed data, all three deep generative models achieved their highest F1 Scores. TVAE reached 0.9226, and CTGAN peaked at 0.9338. TabDDPM outperformed the others with an F1 Score of 0.9428, highlighting its ability to generate high-quality data even with a high level of missing data. TabDDPM-SMOTE further improved TabDDPM's performance, achieving the highest F1 Score of 0.9435, demonstrating the effectiveness of combining TabDDPM with SMOTE for handling class imbalance in educational datasets.
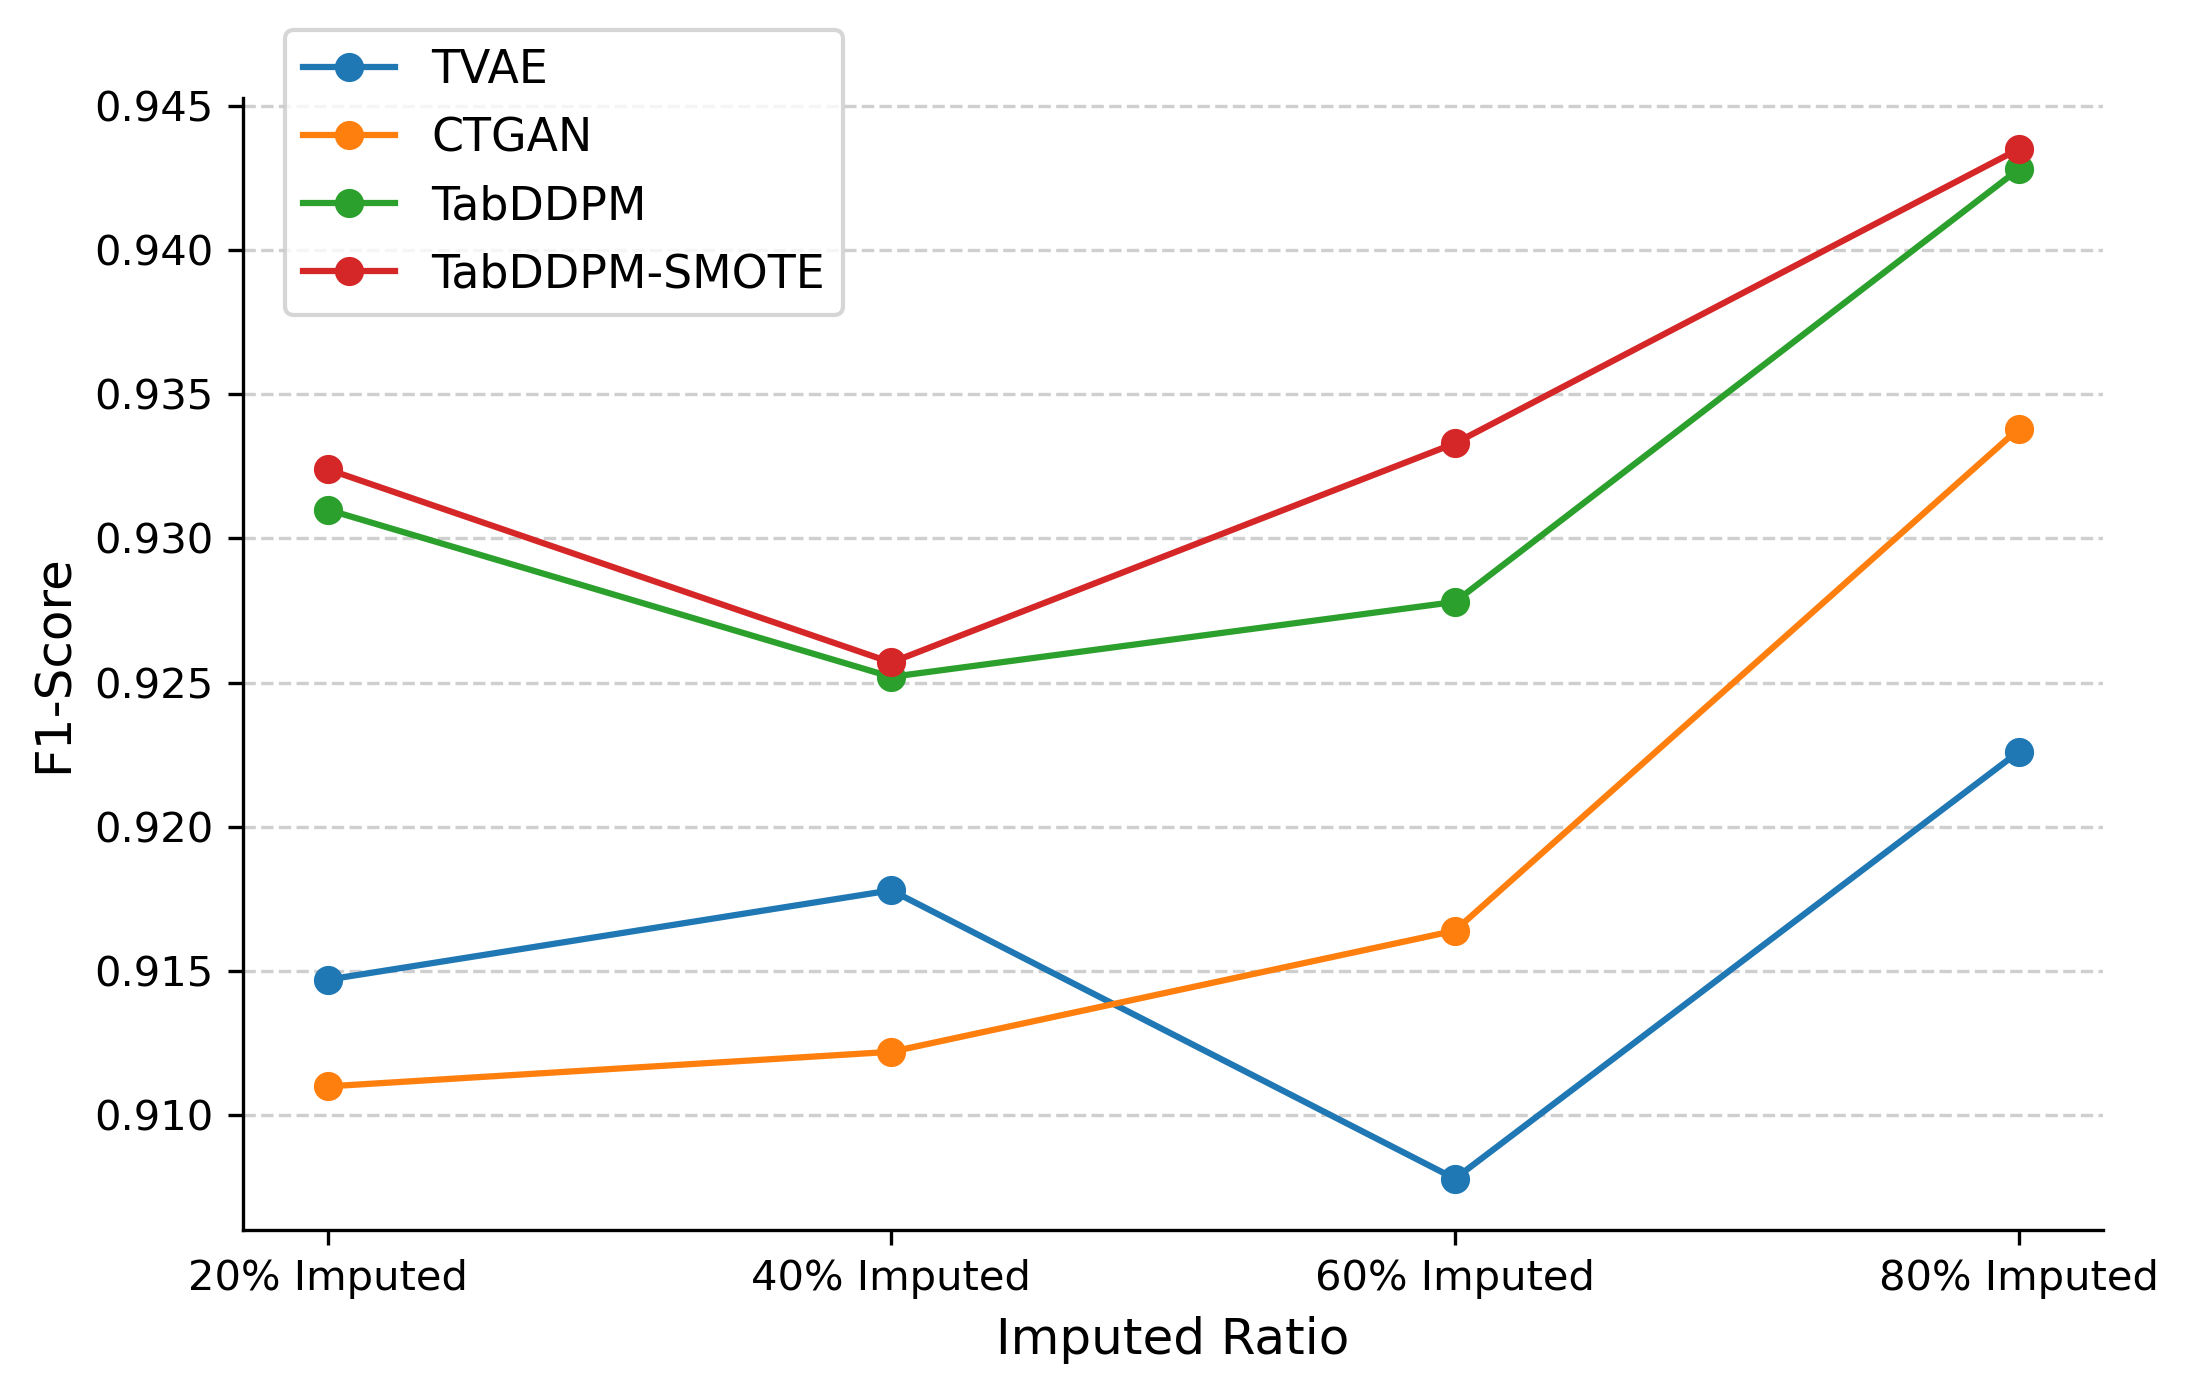
Figure 3 further supports these results, showing the trends in performance across different imputed ratios. TabDDPM and TabDDPM-SMOTE demonstrate a more stable performance, with clear improvements as the proportion of imputed data increases. The upward trend of TabDDPM-SMOTE across all imputation levels suggests that it not only preserves but enhances data utility, particularly when dealing with a high percentage of missing values.
Overall, while TVAE and CTGAN showed fluctuations in performance, TabDDPM consistently delivered strong results. Our proposed TabDDPM-SMOTE model exhibited the best performance across all scenarios of different missing data levels, showcasing its ability to address class imbalance in EDM.
Results
RQ1: How do different deep generative models perform at imputing missing values in educational tabular datasets?
The experimental results demonstrated that the three deep generative models, TVAE, CTGAN, and TabDDPM, performed differently in imputing tabular numerical missing data in the OULAD educational dataset.
Using the score data of assessment 8 as an illustrative example, the KL divergence comparison and KDE plots provided valuable insights into the models' abilities to capture the original data distribution and generate imputed values.
Regarding KL divergence, TabDDPM consistently outperformed TVAE and CTGAN significantly as the proportion of missing data increased. While TVAE showed strong alignment with the original data at lower missing data levels, its performance declined as the imputed data proportion grew. On the other hand, CTGAN encountered challenges in aligning with the original data distribution across all missing data levels, as evidenced by its higher KL divergence values.
The KDE plots further supported these findings, visually illustrating the models' capabilities in capturing the probability density. TabDDPM maintained strong alignment with the original data distribution, effectively capturing the peaks and tails even at high levels of missing data. TVAE performed well at lower missing data levels but faced the challenge of maintaining this alignment as the generated data proportion increased. CTGAN faced difficulty consistently reproducing the original distribution.
The consistent results from KL divergence and KDE plots confirmed their ability to effectively evaluate the imputation performance of deep generative models on educational data. Combining these complementary measures allows for a comprehensive understanding of the models' capabilities in capturing data characteristics and distributions.
These results highlighted TabDDPM's effectiveness in imputing educational missing data. Its strong performance can be attributed to its diffusion-based modeling approach, which effectively incorporates Gaussian diffusion for continuous features and multinomial diffusion for categorical features.
This approach enables TabDDPM to handle the mixed data types prevalent in educational datasets, capturing the complex relationships and dependencies within the data.
RQ2: How do different deep generative models perform regarding machine learning efficiency when their imputed data is used for classification tasks?
Our experimental results demonstrated the remarkable potential of deep generative models in enhancing machine learning efficiency for classification tasks in educational datasets.
Among the TVAE, CTGAN, TabDDPM, and TabDDPM-SMOTE models, TabDDPM-SMOTE consistently exhibited the best F1-scores across all scenarios and even achieved the highest F1-score compared to the original dataset.
This outstanding performance can be attributed to TabDDPM's diffusion-based modeling approach and the incorporation of SMOTE, which showcased its ability to generate high-quality data efficiently utilized by XGB for classification tasks and effectively addresses the class imbalance prevalent in educational datasets.
Interestingly, the models achieved higher F1-scores when using datasets with more imputed data. For example, the F1-scores of most models were higher when using the dataset with 80% imputed data compared to the 20% imputed data. Moreover, CTGAN (0.9338), TabDDPM (0.9428), and TabDDPM-SMOTE (0.9435) achieved even better F1-scores with the 80% imputed dataset than the entirely original dataset (0.9320). This result may be attributed to the deep learning models' ability to generate data that reduces the presence of outliers in educational datasets, thereby improving data quality. However, further investigation is needed to understand these underlying mechanisms better.
This result indicated that the deep generative models could successfully capture relationships between demographic, behavioral, and partial assessment data and effectively impute the missing assessment scores.
Conclusion
This study provided a comprehensive comparison of deep generative models, including VAE-based (TVAE), GAN-based (CTGAN), and diffusion-based (TabDDPM, TabDDPM-SMOTE) for imputing numerical missing data in an educational dataset.
The findings showed that TabDDPM generally excelled in capturing the original data distribution while preserving essential features, especially under high missing data levels. Moreover, the KL divergence and KDE plots indicated that TabDDPM maintained closer alignment with the original data.
Notably, our proposed TabDDPM-SMOTE model consistently demonstrated the best machine learning efficiency across all scenarios, achieving the highest F1 Score and even outperforming the entirely original dataset.
In the educational context, these models successfully captured the underlying data distribution of student performance by learning the complex relationships between different educational features. This enabled them to generate realistic imputations for missing assessment scores.
This study filled the research gap in applying deep learning to educational data imputation by examining the performance of advanced generative methods on educational data. It presents the potential to improve subsequent analyses, particularly the strong performance of our proposed TabDDPM-SMOTE model.
Future research could extend this work by evaluating these deep generative models, especially TabDDPM-SMOTE, across different educational datasets, including larger datasets or educational contexts such as K-12 education.
Such broader applications would help establish more generalizable findings about the effectiveness of these imputation approaches in EDM.
ACKNOWLEDGMENTS
This work is partially financed through national funds by FCT - Fundação para a Ciência e a Tecnologia, I.P., in the framework of the Project UIDB/00326/2025 and UIDP/00326/2025.
REFERENCES
- Mustafa Alabadla, Fatimah Sidi, Iskandar Ishak, Hamidah Ibrahim, Lilly Suriani Affendey, Zafienas Che Ani, Marzanah A Jabar, Umar Ali Bukar, Navin Kumar Devaraj, Ahmad Sobri Muda, and others. 2022. Systematic review of using machine learning in imputing missing values. IEEE Access 10, (2022), 44483–44502.
- AHMED Al-Ashoor and SHUBAIR Abdullah. 2022. Examining techniques to solving imbalanced datasets in educational data mining systems. Int. J. Comput 21, 2 (2022), 205–213.
- Majed Alwateer, El-Sayed Atlam, Mahmoud Mohammed Abd El-Raouf, Osama A Ghoneim, and Ibrahim Gad. 2024. Missing Data Imputation: A Comprehensive Review. Journal of Computer and Communications 12, 11 (2024), 53–75.
- Gustavo EAPA Batista, Maria Carolina Monard, and others. 2002. A study of K-nearest neighbour as an imputation method. His 87, 251–260 (2002), 48.
- Leo Breiman. 2001. Random forests. Machine learning 45, (2001), 5–32.
- Renato Bruni, Cinzia Daraio, and Davide Aureli. 2021. Imputation techniques for the reconstruction of missing interconnected data from higher educational institutions. Knowledge-Based Systems 212, (2021), 106512.
- Tianqi Chen and Carlos Guestrin. 2016. Xgboost: A scalable tree boosting system. In Proceedings of the 22nd acm sigkdd international conference on knowledge discovery and data mining, 2016. 785–794.
- Yen-Chi Chen. 2017. A tutorial on kernel density estimation and recent advances. Biostatistics & Epidemiology 1, 1 (2017), 161–187.
- Wan Chong Choi, Chan-Tong Lam, and António José Mendes. 2024. Analyzing the Interpretability of Machine Learning Prediction on Student Performance Using SHapley Additive exPlanations. In 2024 IEEE International Conference on Teaching, Assessment and Learning for Engineering (TALE), 2024. IEEE, 1–8.
- Wan-Chong Choi, Chan-Tong Lam, and António José Mendes. 2023. A Systematic Literature Review on Performance Prediction in Learning Programming Using Educational Data Mining. In 2023 IEEE Frontiers in Education Conference (FIE), 2023. IEEE, 1–9.
- Wan-Chong Choi, Chan-Tong Lam, and António José Mendes. 2024. How Various Educational Features Influence Programming Performance in Primary School Education. In 2024 IEEE Global Engineering Education Conference (EDUCON), 2024. IEEE, 1–8.
- Wan-Chong Choi, Chan-Tong Lam, and António José Mendes. 2024. Enhance Learning Performance Predictions with Explainable Machine Learning. In 2024 IEEE Frontiers in Education Conference (FIE), 2024. IEEE, 1–9.
- Ricardo Costa-Mendes, Frederico Cruz-Jesus, Tiago Oliveira, and Mauro Castelli. 2021. Machine learning bias in predicting high school grades: A knowledge perspective. Emerging Science Journal 5, 5 (2021), 576–597.
- Tlamelo Emmanuel, Thabiso Maupong, Dimane Mpoeleng, Thabo Semong, Banyatsang Mphago, and Oteng Tabona. 2021. A survey on missing data in machine learning. Journal of Big data 8, (2021), 1–37.
- Ben Fei, Zhaoyang Lyu, Liang Pan, Junzhe Zhang, Weidong Yang, Tianyue Luo, Bo Zhang, and Bo Dai. 2023. Generative diffusion prior for unified image restoration and enhancement. In Proceedings of the IEEE/CVF Conference on Computer Vision and Pattern Recognition, 2023. 9935–9946.
- Alberto Fernández, Salvador Garcia, Francisco Herrera, and Nitesh V. Chawla. 2018. SMOTE for learning from imbalanced data: progress and challenges, marking the 15-year anniversary. Journal of artificial intelligence research 61, (2018), 863–905.
- Ian Goodfellow, Jean Pouget-Abadie, Mehdi Mirza, Bing Xu, David Warde-Farley, Sherjil Ozair, Aaron Courville, and Yoshua Bengio. 2020. Generative adversarial networks. Communications of the ACM 63, 11 (2020), 139–144.
- Jonathan Ho, Ajay Jain, and Pieter Abbeel. 2020. Denoising diffusion probabilistic models. In Proceedings of the 34th International Conference on Neural Information Processing Systems (NIPS ’20), 2020. Curran Associates Inc., Red Hook, NY, USA.
- Nathalie Japkowicz and Shaju Stephen. 2002. The class imbalance problem: A systematic study. Intelligent data analysis 6, 5 (2002), 429–449.
- Soohwan Jeong, Chonghyo Joo, Jongkoo Lim, Hyungtae Cho, Sungsu Lim, and Junghwan Kim. 2023. A novel graph-based missing values imputation method for industrial lubricant data. Computers in Industry 150, (2023), 103937.
- Omar Jiménez, Ashley Jesús, and Lenis Wong. 2023. Model for the Prediction of Dropout in Higher Education in Peru applying Machine Learning Algorithms: Random Forest, Decision Tree, Neural Network and Support Vector Machine. In 2023 33rd Conference of Open Innovations Association (FRUCT), 2023. IEEE, 116–124.
- Esteban Jove, Patricia Blanco-Rodríguez, José-Luis Casteleiro-Roca, Héctor Quintián, Francisco Javier Moreno Arboleda, José Antonio LóPez-Vázquez, Benigno Antonio Rodríguez-Gómez, María Del Carmen Meizoso-López, Andrés Piñón-Pazos, Francisco Javier De Cos Juez, and others. 2020. Missing data imputation over academic records of electrical engineering students. Logic Journal of the IGPL 28, 4 (2020), 487–501.
- Noman Khanani and Jordan Lawson. 2021. Addressing Missing Data in Educational Evaluation: Predictive Mean Matching Imputation for Test Score Data. In Proceedings of the 2021 AERA Annual Meeting, 2021. . https://doi.org/10.3102/1687298
- Diederik P Kingma. 2013. Auto-encoding variational bayes. arXiv preprint arXiv:1312.6114 (2013).
- Diederik P Kingma and Jimmy Ba. 2014. Adam: A method for stochastic optimization. arXiv preprint arXiv:1412.6980 (2014).
- Kristian Kleinke. 2017. Multiple imputation under violated distributional assumptions: A systematic evaluation of the assumed robustness of predictive mean matching. Journal of Educational and Behavioral Statistics 42, 4 (2017), 371–404.
- Ron Kohavi and others. 1995. A study of cross-validation and bootstrap for accuracy estimation and model selection. In International Joint Conferences on Artificial Intelligence (IJCAI), 1995. Montreal, Canada, 1137–1145.
- Akim Kotelnikov, Dmitry Baranchuk, Ivan Rubachev, and Artem Babenko. 2023. Tabddpm: Modelling tabular data with diffusion models. In International Conference on Machine Learning, 2023. PMLR, 17564–17579.
- Solomon Kullback and Richard A Leibler. 1951. On information and sufficiency. The annals of mathematical statistics 22, 1 (1951), 79–86.
- Jakub Kuzilek, Martin Hlosta, and Zdenek Zdrahal. 2017. Open university learning analytics dataset. Scientific data 4, 1 (2017), 1–8.
- Mingxuan Liu, Siqi Li, Han Yuan, Marcus Eng Hock Ong, Yilin Ning, Feng Xie, Seyed Ehsan Saffari, Yuqing Shang, Victor Volovici, Bibhas Chakraborty, and others. 2023. Handling missing values in healthcare data: A systematic review of deep learning-based imputation techniques. Artificial intelligence in medicine 142, (2023), 102587.
- Xiaoye Miao, Yangyang Wu, Lu Chen, Yunjun Gao, and Jianwei Yin. 2022. An experimental survey of missing data imputation algorithms. IEEE Transactions on Knowledge and Data Engineering 35, 7 (2022), 6630–6650.
- SWJ Nijman, AM Leeuwenberg, I Beekers, I Verkouter, JJL Jacobs, ML Bots, FW Asselbergs, KGM Moons, and TPA Debray. 2022. Missing data is poorly handled and reported in prediction model studies using machine learning: a literature review. Journal of clinical epidemiology 142, (2022), 218–229.
- Abdulhakim A Qahtan, Ahmed Elmagarmid, Raul Castro Fernandez, Mourad Ouzzani, and Nan Tang. 2018. FAHES: A robust disguised missing values detector. In Proceedings of the 24th ACM SIGKDD International Conference on Knowledge Discovery & Data Mining, 2018. 2100–2109.
- J. Ross Quinlan. 1986. Induction of decision trees. Machine learning 1, (1986), 81–106.
- Donald B Rubin. 1976. Inference and missing data. Biometrika 63, 3 (1976), 581–592.
- Ruslan Salakhutdinov. 2015. Learning deep generative models. Annual Review of Statistics and Its Application 2, 1 (2015), 361–385.
- Hayeong Song and Danielle Albers Szafir. 2018. Where’s my data? evaluating visualizations with missing data. IEEE transactions on visualization and computer graphics 25, 1 (2018), 914–924.
- Daniel J Stekhoven and Peter Bühlmann. 2012. MissForest—non-parametric missing value imputation for mixed-type data. Bioinformatics 28, 1 (2012), 112–118.
- Yige Sun, Jing Li, Yifan Xu, Tingting Zhang, and Xiaofeng Wang. 2023. Deep learning versus conventional methods for missing data imputation: A review and comparative study. Expert Systems with Applications 227, (2023), 120201.
- Tressy Thomas and Enayat Rajabi. 2021. A systematic review of machine learning-based missing value imputation techniques. Data Technologies and Applications 55, 4 (2021), 558–585.
- Yan Tian, Kaili Zhang, Jianyuan Li, Xianxuan Lin, and Bailin Yang. 2018. LSTM-based traffic flow prediction with missing data. Neurocomputing 318, (2018), 297–305.
- Stef Van Buuren and Catharina GM Oudshoorn. 2000. Multivariate imputation by chained equations.
- Ziheng Wei and Sebastian Link. 2021. Embedded functional dependencies and data-completeness tailored database design. ACM Transactions on Database Systems (TODS) 46, 2 (2021), 1–46.
- Lei Xu, Maria Skoularidou, Alfredo Cuesta-Infante, and Kalyan Veeramachaneni. 2019. Modeling tabular data using conditional GAN. In Proceedings of the 33rd International Conference on Neural Information Processing Systems. Red Hook, NY, USA, 7335–7345.
- Li Yang and Abdallah Shami. 2020. On hyperparameter optimization of machine learning algorithms: Theory and practice. Neurocomputing 415, (2020), 295–316.
- Yujia Zhai, Wei Song, Xianjun Liu, Lizhen Liu, and Xinlei Zhao. 2018. A chi-square statistics based feature selection method in text classification. In 2018 IEEE 9th International conference on software engineering and service science (ICSESS), 2018. IEEE, 160–163.
© 2025 Copyright is held by the author(s). This work is distributed under the Creative Commons Attribution-NonCommercial-NoDerivatives 4.0 International (CC BY-NC-ND 4.0) license.