ABSTRACT
Knowledge tracing (KT) models predict how students will perform on future interactions, given a sequence of prior responses. Modern approaches to KT leverage deep learning techniques to produce more accurate predictions, potentially making personalized learning paths more efficacious for learners. Many papers on the topic of KT focus primarily on model performance and do not discuss the practical challenges of implementation. However, understanding the practical aspects of how these models behave is just as important as their predictive performance. Using data from over 500,000 students and over 100 million interactions, we evaluated two deep KT models, a long short-term memory (LSTM) and a self-attentive knowledge tracing (SAKT) model. While global performance metrics for both LSTM and SAKT models are impressive, they also hide important practical flaws. We found significant limitations in their ability to predict responses for new students (i.e., cold start), detect incorrect responses, and maintain sensible predictions independent of question order. Further refinement of the models is needed in these areas in order to enhance their ability to guide a real student’s learning path.
Keywords
1. INTRODUCTION
Knowledge tracing (KT) models are designed to track the progression of students’ predicted performance as they respond to questions on digital learning platforms[4]. These models have the potential to improve the efficacy of personalized learning by providing real-time insights into what a student knows and doesn’t know. In recent years, a new approach to KT has emerged that makes use of neural network architectures – known as deep knowledge tracing (DKT). DKT models are capable of learning complex, non-linear patterns that contribute to student performance. Their key advantage is their flexibility for implementation – once trained, a DKT model can take a sequence of student responses and immediately make predictions without any additional retraining or updating.
The majority of research into DKT centers around predictive performance, measured by area under the receiver operator curve (AUC) [1, 7]. However, over-emphasis on aggregate predictive performance carries the risk of overlooking practical, real-world issues that are equally important to consider. For example, if a student needs to submit a large number of responses before the model can provide them with accurate predictions, then the model has lower practical utility than its aggregate performance metrics might suggest. In another example, previous research has demonstrated that LSTMs can be detrimentally “impacted by the relative ordering of skills presented”, but posed the suggestion that attention based models might “better capture long range skill dependencies”[5]. Thus, having a better understanding of how a model behaves under different practical conditions makes it easier to decide when it is appropriate to use such a model. The purpose of this study is to conduct a practical evaluation of DKT models when they are applied in learning platforms at scale.
We specifically examine two DKT models – long short term memory (LSTM) and self-attentive knowledge tracing (SAKT). LSTM is based on recurrent neural networks [9], while SAKT uses the attention mechanism of transformer networks [7]. The attention mechanism computes a set of similarity (attention) weights between tokens in the input sequence [10]. A notable difference between SAKT and LSTM is that the whole sequence of questions and responses is available to the transformer, rather than a hidden state being iterated with each new token. This may give SAKT a better ability to uncover features which give it more predictive power.
Our paper is structured as follows. We start in section 2 by comparing standard performance metrics of LSTM and SAKT, and benchmark them against a widely used item response theory (IRT) model. We then move on to our practical evaluations. In section 3.1 we investigate the ability of LSTM and SAKT to predict incorrect responses and the reasons that they struggle with this task. In section 3.2 we investigate how many student responses a model needs to receive before it can generate useful predictions. In section 3.3 we show how sensitive the models are to input noise at different points in the student sequence, such as a student mistakenly clicking on the wrong button. Finally, in section 3.4 we show the impact of changing the order of the questions asked of a student.
2. OVERALL PERFORMANCE
We conducted two evaluations of overall predictive performance. Evaluation 1 compared LSTM and SAKT models on a validation set held back during training. Evaluation 2 compared the performance of LSTM and SAKT to a 1-parameter IRT model[3]. Briefly, IRT models the probability of a correct response as the difference between a global students ability parameter and the difficulty of an individual question. The IRT models, unlike KT models, do not account for a progression in the student’s knowledge as the answer sequence continues. Instead they assume that the student’s ability is described by a single static parameter. This makes them more appropriate for evaluating a student at a single point in time rather than ongoing progress during learning. Previous work has made comparisons between IRT and DKT models [1, 9]. We chose to use IRT instead of other KT models, such as Bayesian Knowledge Tracing (BKT), due to the difficulty in adapting BKT to this evaluation. In particular, BKT learns a students ability on each skill separately, meaning we could not use student responses on one skill to predict performance on another without adding advanced architecture. A simple one-dimensional IRT can easily make predictions for all possible questions, because it only estimates a global student ability, instead of on a skill-by-skill basis. Extensions to the basic one-dimensional IRT model, such as multi-dimensional IRT (MIRT) would face similar constraints as the BKT model.
In training both DKT models, we used a binary cross entropy loss function. Models were trained using an Adam optimisation routine on up to 50 epochs, with an early stopping criteria if the test-set loss increased for 3 iterations.
The data used to train and test the models came from real student response data to a 6th-grade math course on a large education technology platform in the US. Due to privacy reasons, the data is not publicly available. The data took the form of a chronologically ordered sequences of responses to practice questions given by each student. Responses were coded as 1 for correct and 0 for incorrect, and question indicators were coded as categorical values. In order to ensure the data were representative of typical student usage on the platform, we filtered the data to students who: 1) responded to more than 16 questions, 2) worked on more than 4 skills, 3) had less than 90% correct on all questions, 4) responded to at least 75% of the questions in the order they are presented in the course, and 5) did not respond to a single question more than 20 times or for more than 10% of their responses. Our primary focus is to help students’ learning during the course. For this reason, we exclude the atypical students who get over 90% correct. Whilst this may introduce some bias into the model, we prefer this to better focus the model on students who are more typical of the stakeholders we are most interested in. Moreover, we removed any response that took less than 2 or more than 2000 seconds.
| Training | Validation | |
|---|---|---|
| N Students | 563,954 | 140,989 |
| N Interactions | 114,412,371 | 28,797,499 |
| Prop. Correct | 0.71 | 0.71 |
| Avg. Seq. Length | 203 | 204 |
| Avg. items per student | 162 | 163 |
| Avg. skills per student | 22 | 22 |
| Med. Sec. per attempt | 21 | 21 |
For Evaluation 1, we split the data such that a random 80% of the students were included in the training set, and the remaining 20% were included in a validation set. A summary of the training and validation data are provided in Table 1.
The model performance on the validation set for SAKT and LSTM are shown on Table 2. The metrics are calculated from all item predictions for students in the validation set. Specificity and recall are calculated as defined in [6]. The AUC, which is equivalent to the Wilcoxon test of ranks, was calculated from these data using the sci-kit learn implementation [8]. As seen in the table, the two models performed almost identically, suggesting that the alternative architecture in the SAKT model did not produce substantial differences in predictive performance in this context. Both models performed at comparable levels of AUC as other reports [1], though slightly smaller than the .85 initially reported for LSTM [9].
| Model | AUC | Recall | Specificity |
|---|---|---|---|
| SAKT | 0.81 | 0.89 | 0.49 |
| LSTM | 0.81 | 0.90 | 0.48 |
We now turn to Evaluation 2, which used a modified approach to accommodate comparison of SAKT and LSTM to the IRT model. In general, IRT models must first estimate the ability parameter for each student before they can be used to make predictions. Thus, the training/validation split used in Evaluation 1 would not work, because the IRT model needs to see some of the data for students in the test set in order to estimate their student ability parameter. To handle this constraint of IRT, we first randomly selected 75% of the students to use as a training set, and the remaining 25% were used as a validation set. However, rather than evaluate performance on the entire sequence in the validation set, we only used the last 25% of observations. We trained the IRT model on the training set and the first 75% of observations in the validation set, allowing the IRT model to estimate ability parameters for the students in the validation set. Conversely, the SAKT and LSTM models were trained on the training set and predicted the entire validation sequence as before, but we only considered the last 25% of observations for computing validation performance metrics to be compared to those of the IRT model.
In addition to the procedural differences described above, we used a subsample of the data set used in Evaluation 1. We first filtered to include only students with sequences that were at least 200 attempts long. This was done to ensure there was sufficient training data for each student in the validation split. From that subset of students, we then subsampled down to 10% of students. This step was performed for pragmatic reasons, as we found training of the IRT model to be time consuming and resource intensive. A summary of the subsample used in this evaluation is shown on Table 3.
| Training | Validation | |
|---|---|---|
| N Students | 14,713 | 4,881 |
| N Interactions | 7,485,983 | 2,453,380 |
| Avg. Seq. Length | 509 | 503 |
| Proportion Correct
| ||
| Overall | 0.71 | 0.71 |
| First 75% | 0.70 | 0.70 |
| Last 25% | 0.74 | 0.74 |
| Model | AUC | Recall | Specificity |
|---|---|---|---|
| SAKT | .77 | .92 | .36 |
| LSTM | .79 | .92 | .39 |
| IRT | .74 | .90 | .34 |
Table 4 shows the model performance metrics for Evaluation 2. As seen on the table, SAKT and LSTM performed better than IRT on all three metrics. Having established that the two DKT models have a good performance relative to the widely used IRT benchmark and achieve similar values of AUC to those reported in other studies [9], we now turn to the evaluation of the aspects of these models that are relevant to real-world implementation.
3. PRACTICAL EVALUATIONS FOR IMPLEMENTATION
Here and in the rest of this paper we use a test dataset of students that were not part of the previous training or validation datasets. The students in this test set used the platform in a similar way to the students in the training data, but were part of U.S. school districts that paid for a license to use the platform. A summary of this test dataset is shown on Table 5.
| N Students | 2,773 |
|---|---|
| N Interactions | 474,496 |
| Prop. Correct | 0.72 |
| Avg. Seq. Length | 171 |
| Avg. items per student | 132 |
| Avg. skills per student | 18 |
| Med. Sec. per attempt | 21 |
3.1 Can the models identify incorrect responses?
A notable shortcoming of SAKT and LSTM is their low specificity (see Table 2 & Table 4). Low specificity is problematic because the model is inappropriately predicting a large number of questions that would be answered correctly when they were in fact answered incorrectly. In practice, this would mean that student learning gaps would go undetected by the model. Of course, the specificity of these models can be improved by raising the classification threshold of 0.5 applied to the predicted probability correct. However, this comes at the expense of recall performance, and is therefore a trade-off that must be considered. Thus, we sought to understand what factors contribute to the underlying inability to identify incorrect responses.
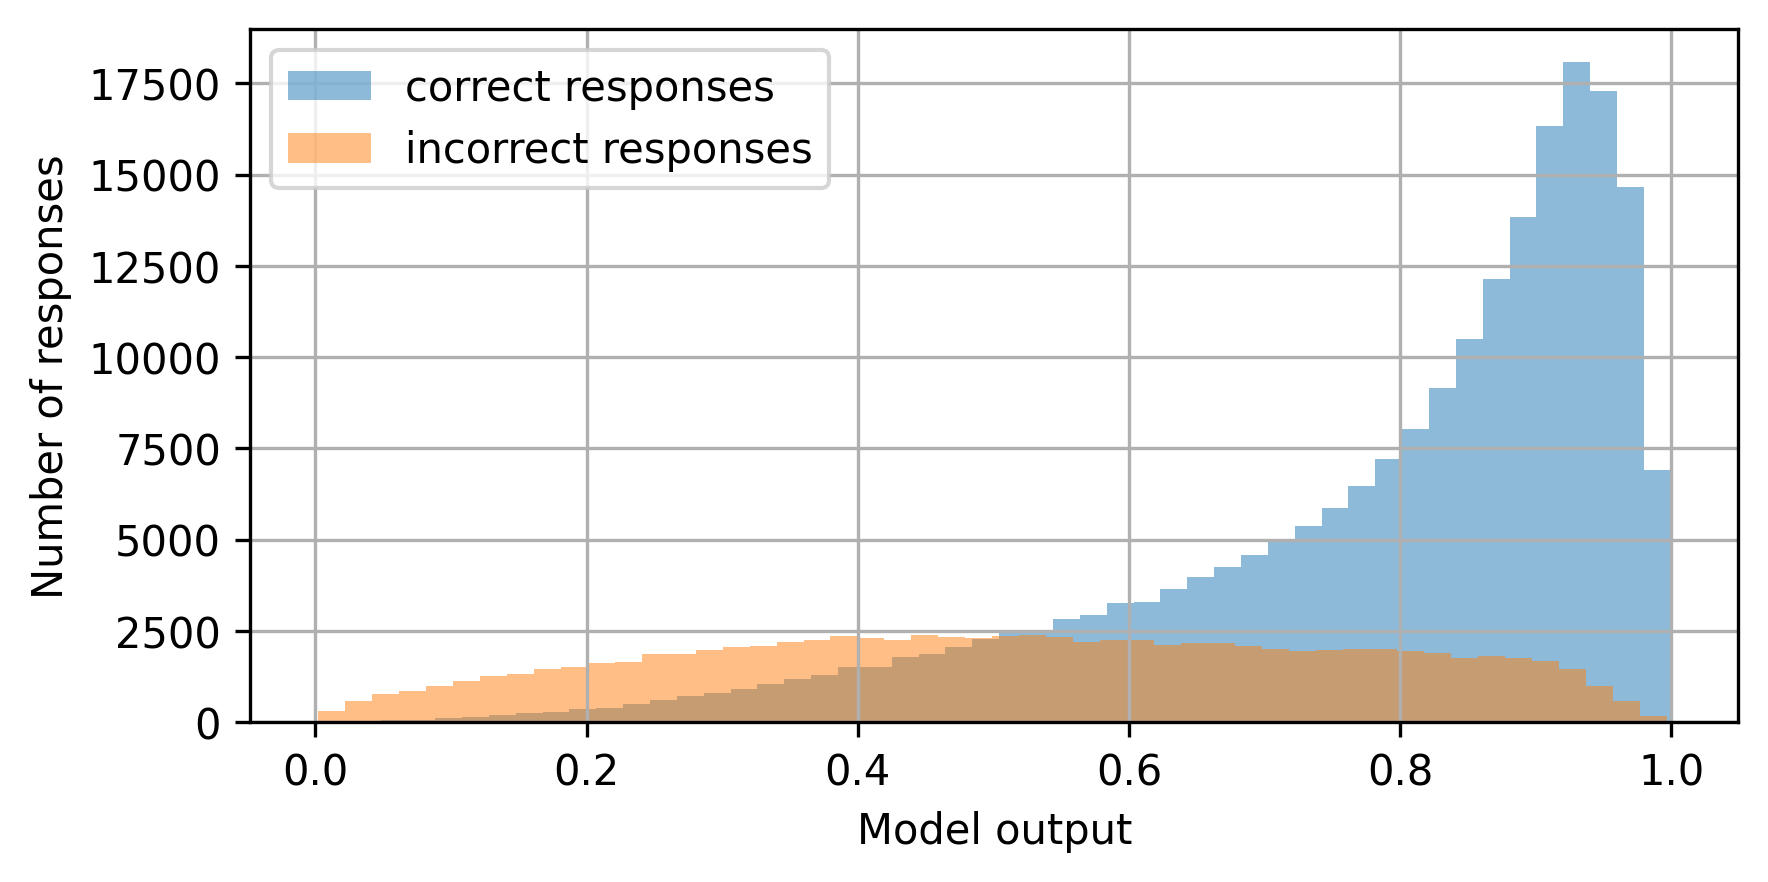
We first examined the distribution of SAKT model predictions for correct and incorrect responses in Figure 1. Very similar distributions were also produced by the LSTM model. For correct responses, the distribution is skewed towards 1 with a mean greater than 0.5 – indicating that the model is able to identify these relatively well. In contrast for incorrect responses, the distribution is nearly uniform with a mean near to 0.5 – indicating that the model struggles to identify incorrect responses.
To check whether this difference in predictions of correct and incorrect responses was caused by the imbalanced classes in the training data, we retrained the model on a training set with correct answers downsampled such that the proportion correct reduced from 71% to 50%. The difference between the predictions for correct and incorrect answers persisted similar to that in Figure 1, showing that the difference was not caused by the data imbalance.
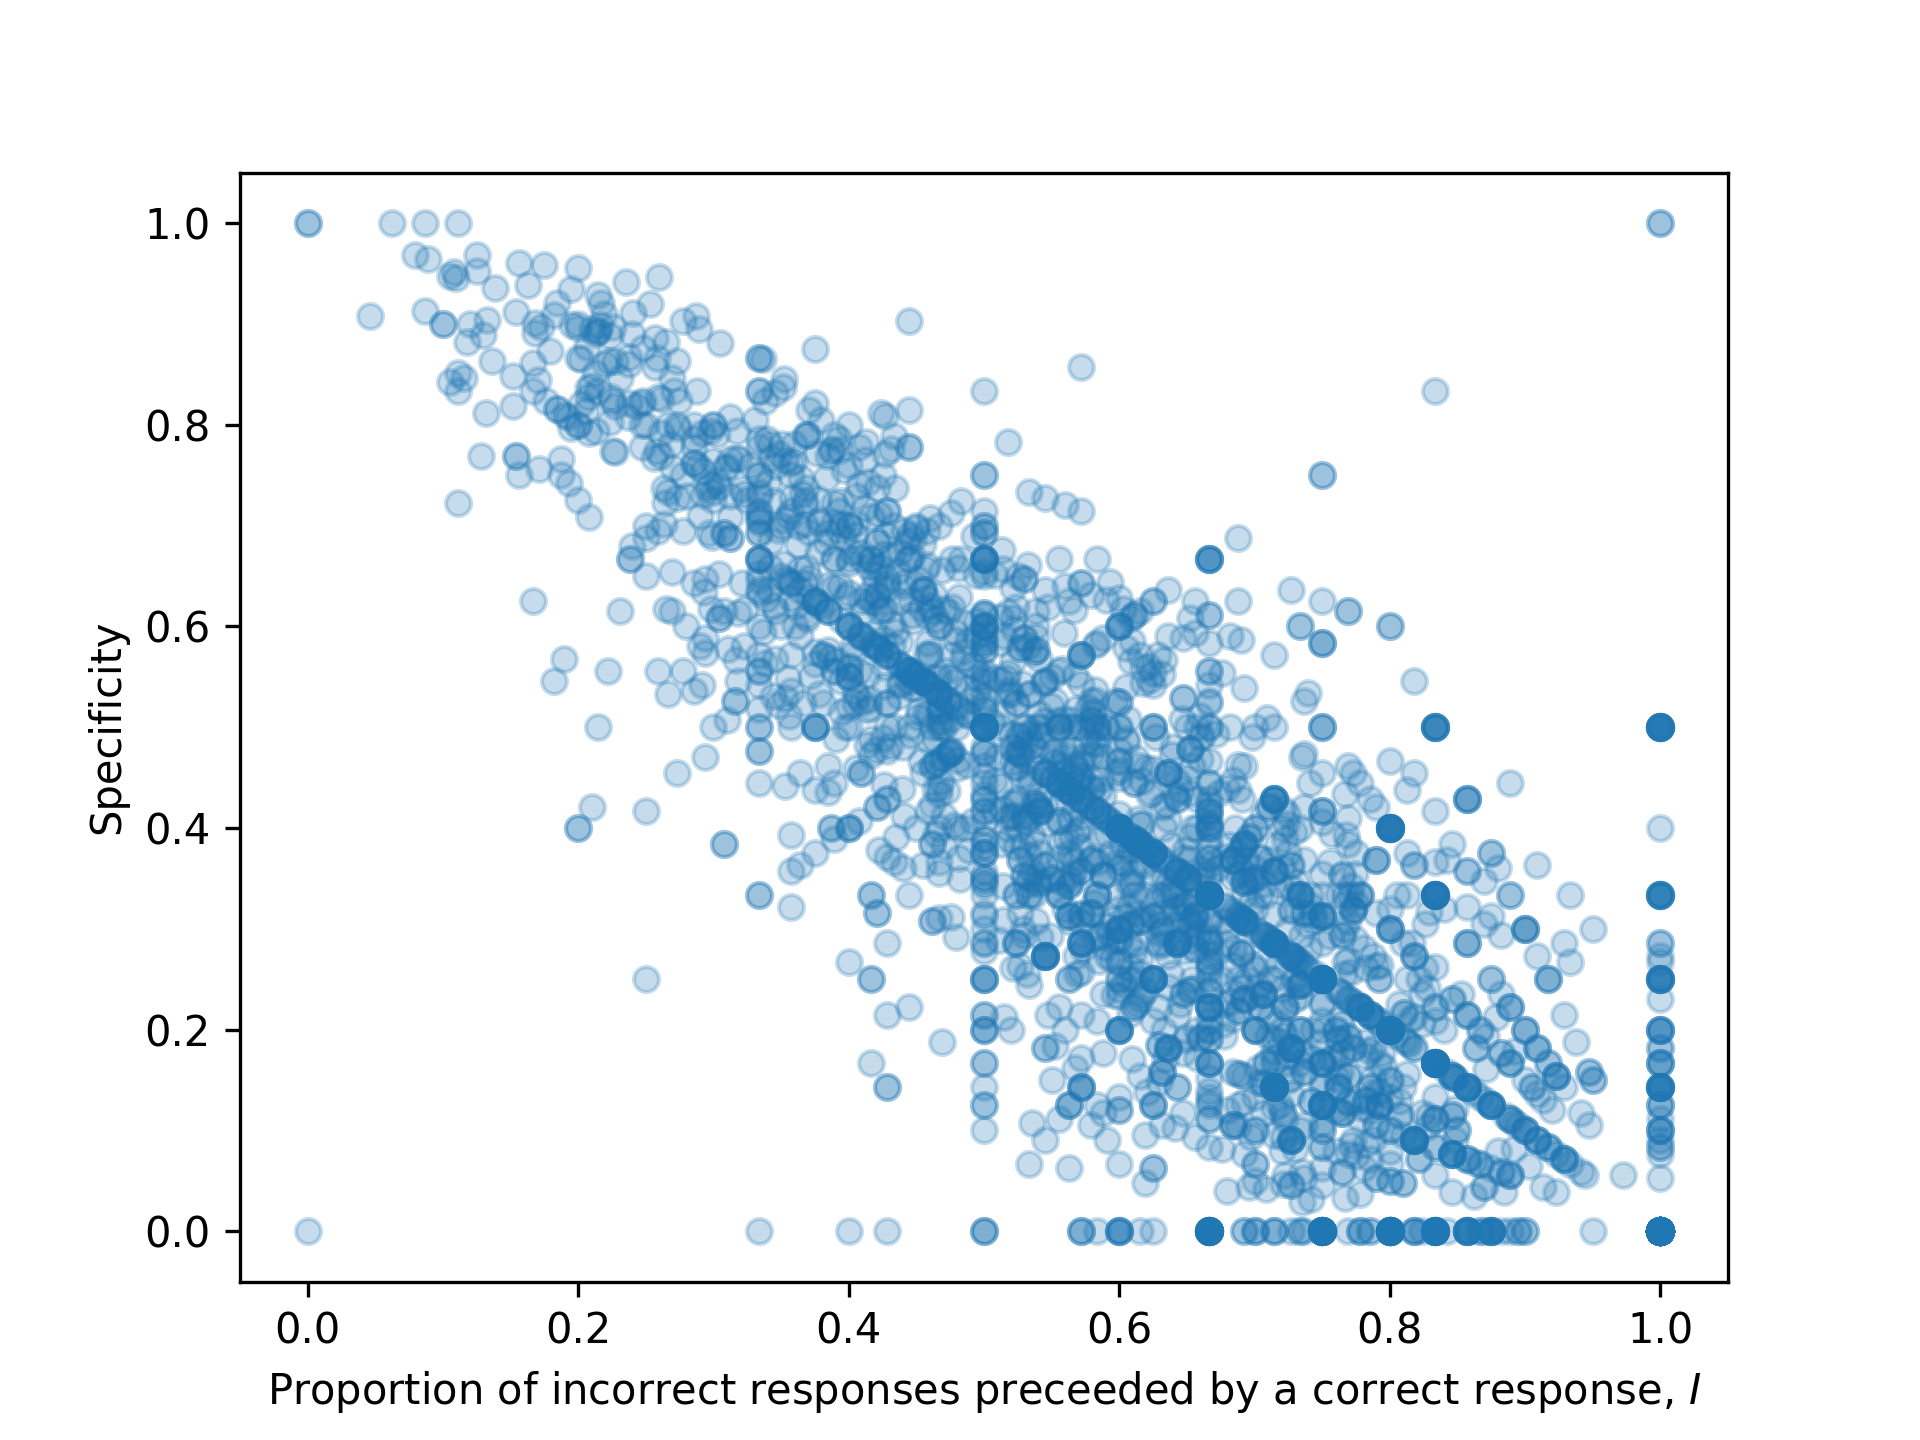
Next, we attempted to determine the features of incorrect responses that make them harder to identify. One hypothesized feature was that isolated incorrect responses were harder to identify than incorrect responses that occurred together in a streak. To examine this, we created a simple metric \(I\), which captures the degree to which incorrect responses tended to occur in streaks or in isolation for a student’s sequence. \(I\) was defined as the proportion of incorrect responses that were preceded by a correct response. To illustrate, a sequence [1,0,1,0] has an \(I\) value of 1 and a sequence [1,1,0,0] has an \(I\) value of 0.5. Thus, sequences where incorrect responses tend to occur in isolation had a higher \(I\) value. Figure 2 shows that there was a strong inverse relationship between \(I\) and specificity calculated over a single student’s response sequence (\(r\) = -0.78). Note that the reported results are for LSTM, but similar results were found for SAKT. This finding indicates that the DKT models had more trouble predicting incorrect responses produced in isolation compared to those that occurred in streaks. We also found that relationship was not simply an artifact of overall correct rates, as the relationship was observed even when stratifying the students by proportion correct.
It is possible that using higher capacity models or adding other input features to the model would uncover some features that make these incorrect responses more predictable. To this end, we experimented with various approaches, such as increasing the number of layers in the models, or adding new features such as question text embeddings. None of these achieved the goal of improving prediction on incorrect responses.
A possibility worth considering is that isolated incorrect responses are primarily the result of randomly occurring momentary slips or distractions from an otherwise capable student. Such incorrect responses would be inherently unpredictable. If so, then it may be the case that these models simply cannot be improved beyond their current state.
3.2 How many responses does a student need to make to initialize a model?
Another important issue to consider is the quality of predictions for students who are new to the platform or who have a short history of responses – commonly known as a ’cold start’ problem [2]. To illustrate, IRT can technically make predictions for students with no prior data by setting their ability parameter to 0. However, these predictions would simply reflect overall average student performance, and would not take into account any new responses until the model is retrained. In contrast, an advantage of DKT models is that they do not have an ability parameter, and can update its predictions for a student with each additional observation without retraining. However, it is important to evaluate the quality of the predictions when the history is short, and the number of responses needed before the models achieve top predictive performance.
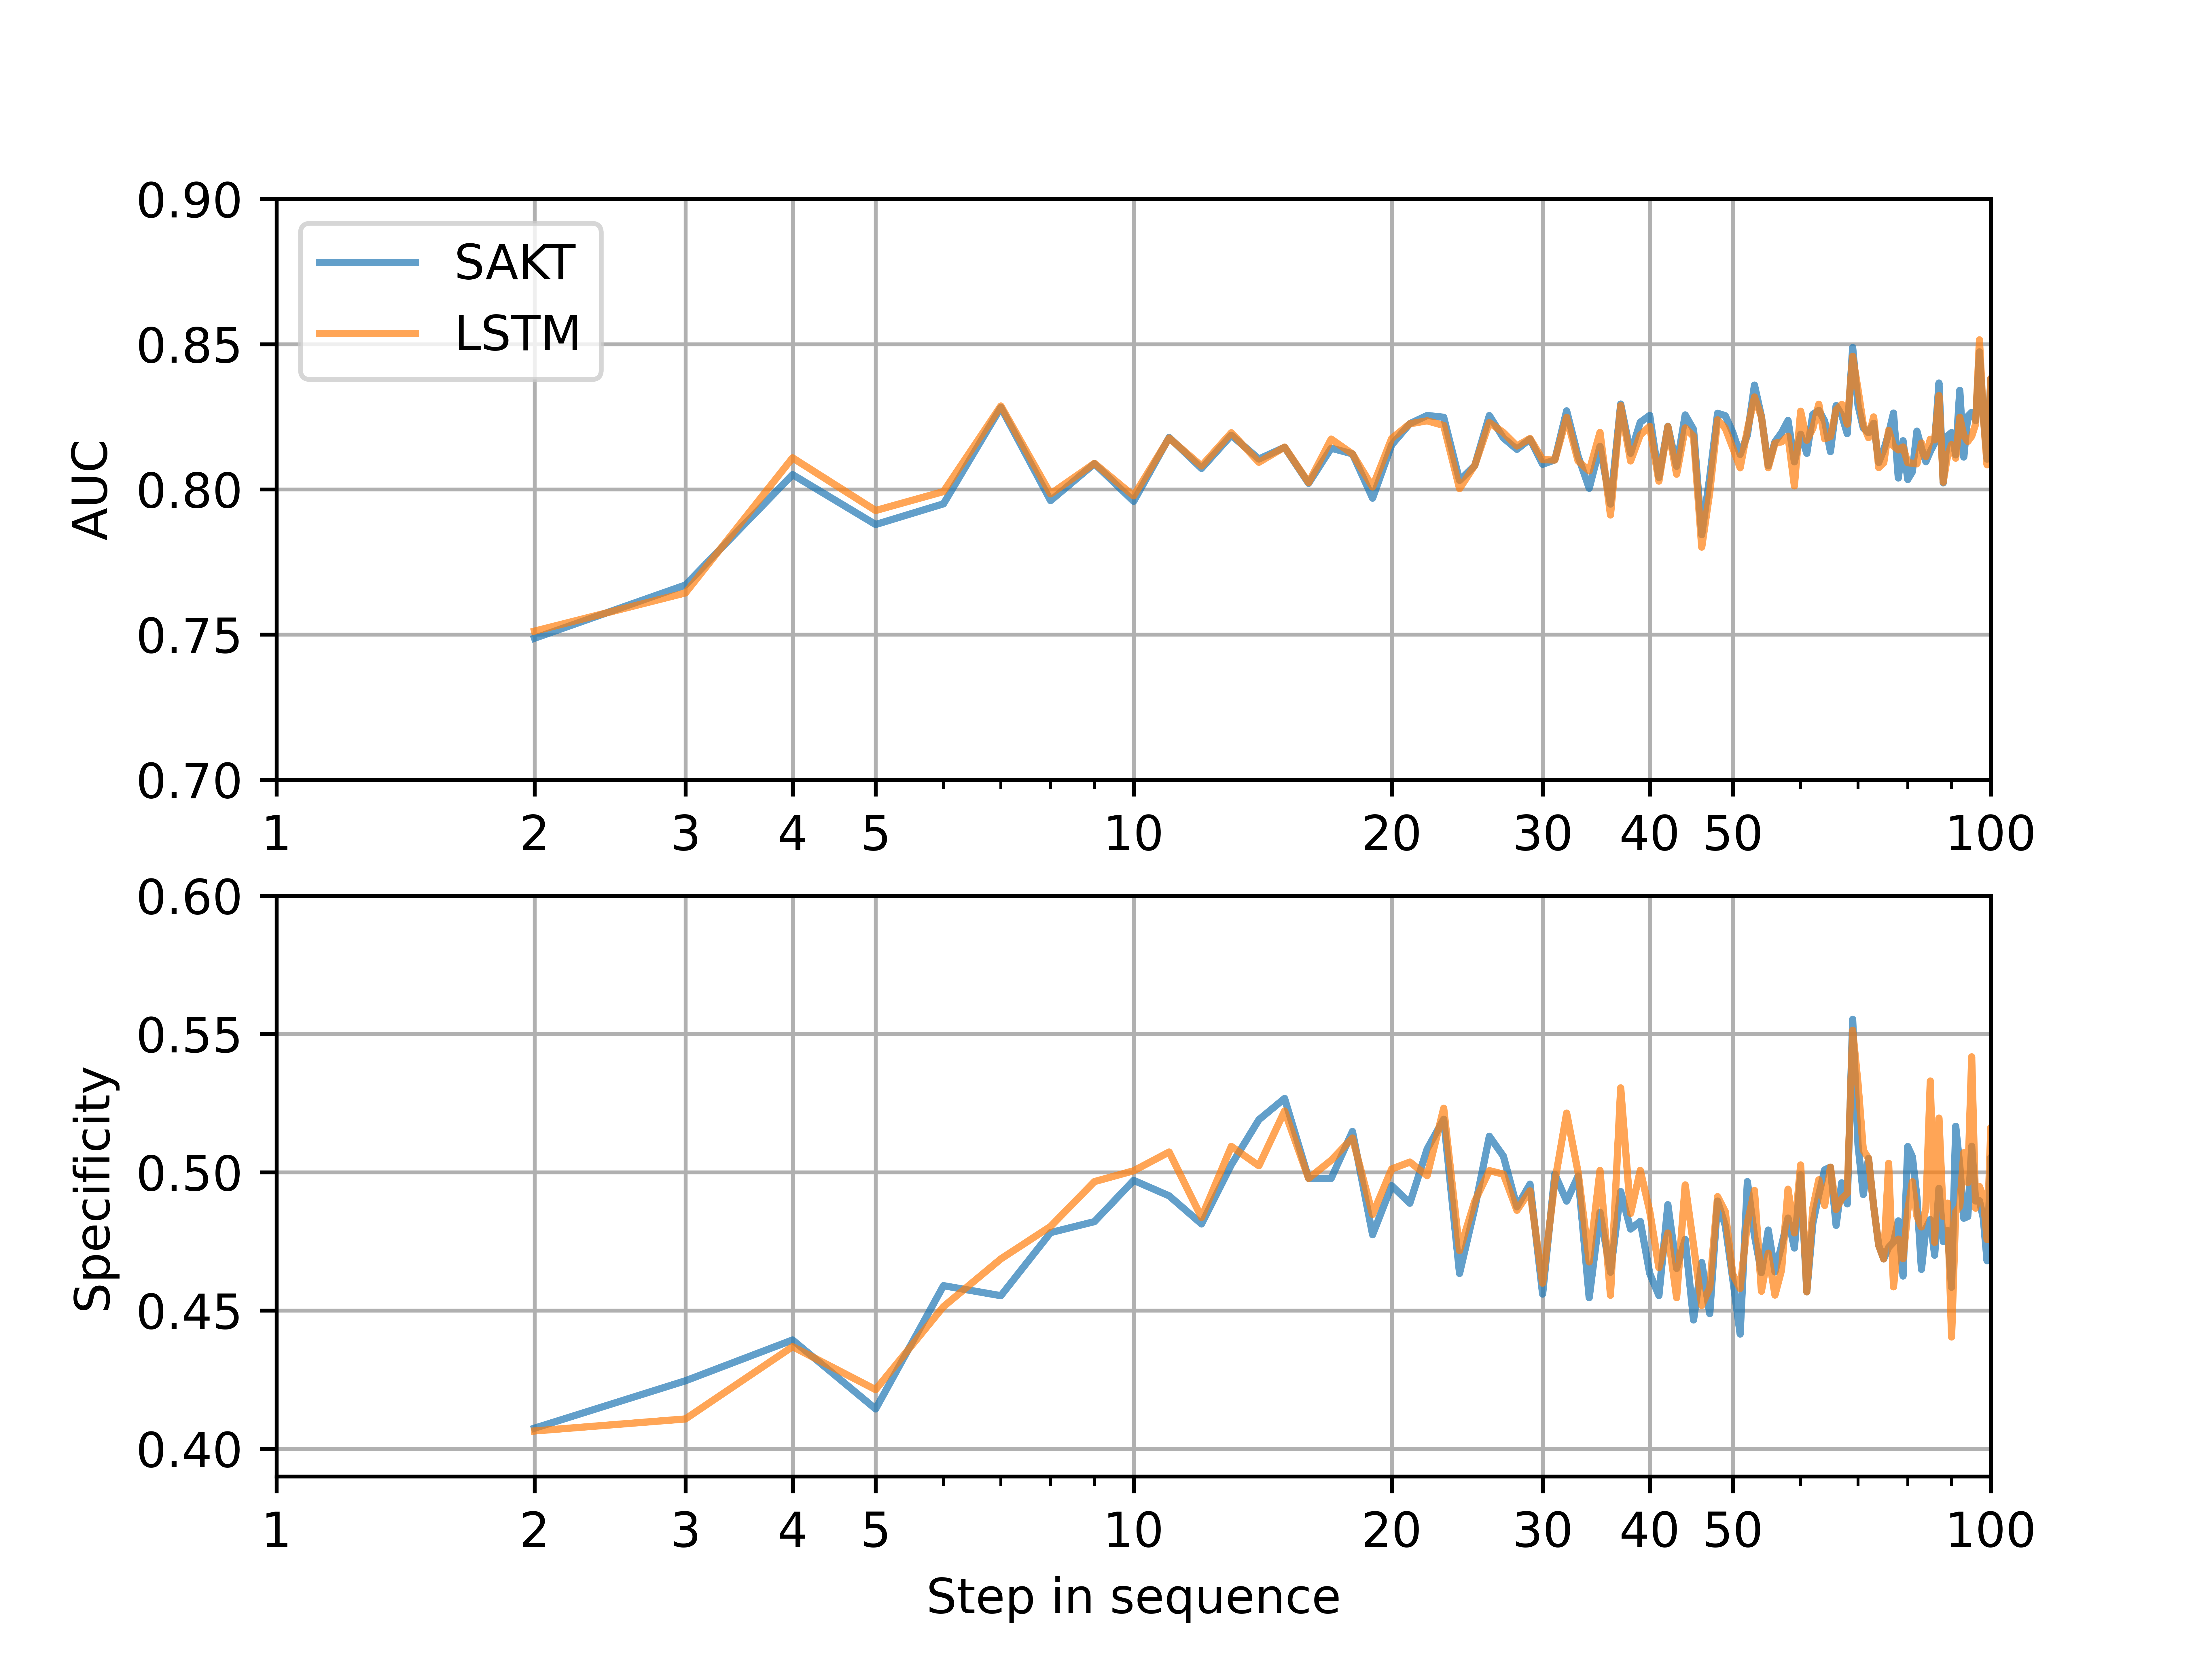
Model performance metrics over the first 100 steps in the response sequence, averaged across students, are shown on Figure 3. We focus on AUC and specificity because these metrics clearly show how model performance changes over the sequence steps. For both metrics, performance starts relatively low and increases rapidly over the first approximately 10 to 20 responses. Noise in this trend makes a strict threshold hard to identify. This trend indicates that the models need a minimum amount of data from a student before peak predictive performance is reached. After the initial rapid increase the metrics for both models level off. In practice, this means that a student would need to complete at least 10 to 20 responses before a model prediction should be used. However, as we’ll see in the next section, the models are sensitive to noise beyond the first 10 to 20 responses, so even more data should be collected to be prudent. For high-stakes applications, more analysis is required, such as how the time needed to initialize a model varies with different question types.
3.3 When are models sensitive to noisy response inputs?
Student response data is often noisy due to factors like misreading questions, accidental clicks, guessing, or submitting random responses out of boredom. When used on a learning platform, the model should be robust to noise like this and not overly rely on single responses that might not truly reflect a student’s ability.
To examine how robust the models are in handling noisy input data, we examined model predictions at all points of the response sequence after intentionally injecting noise into the data. For this analysis, we removed students with sequence lengths less than 250 responses to ensure that the population of students was the same as we varied the step in the sequence that was being analysed. Specifically, when predicting performance on step \(i\) in the sequence, we inverted the outcome of step \(i-1\). For example, consider a student sequence [1,0,0,1,0] on steps 1-5. When predicting the response on step 5, we instead gave the model the altered sequence [1,0,0,0], then compared the predicted probability correct to predictions from unaltered data (i.e., [1,0,0,1]).
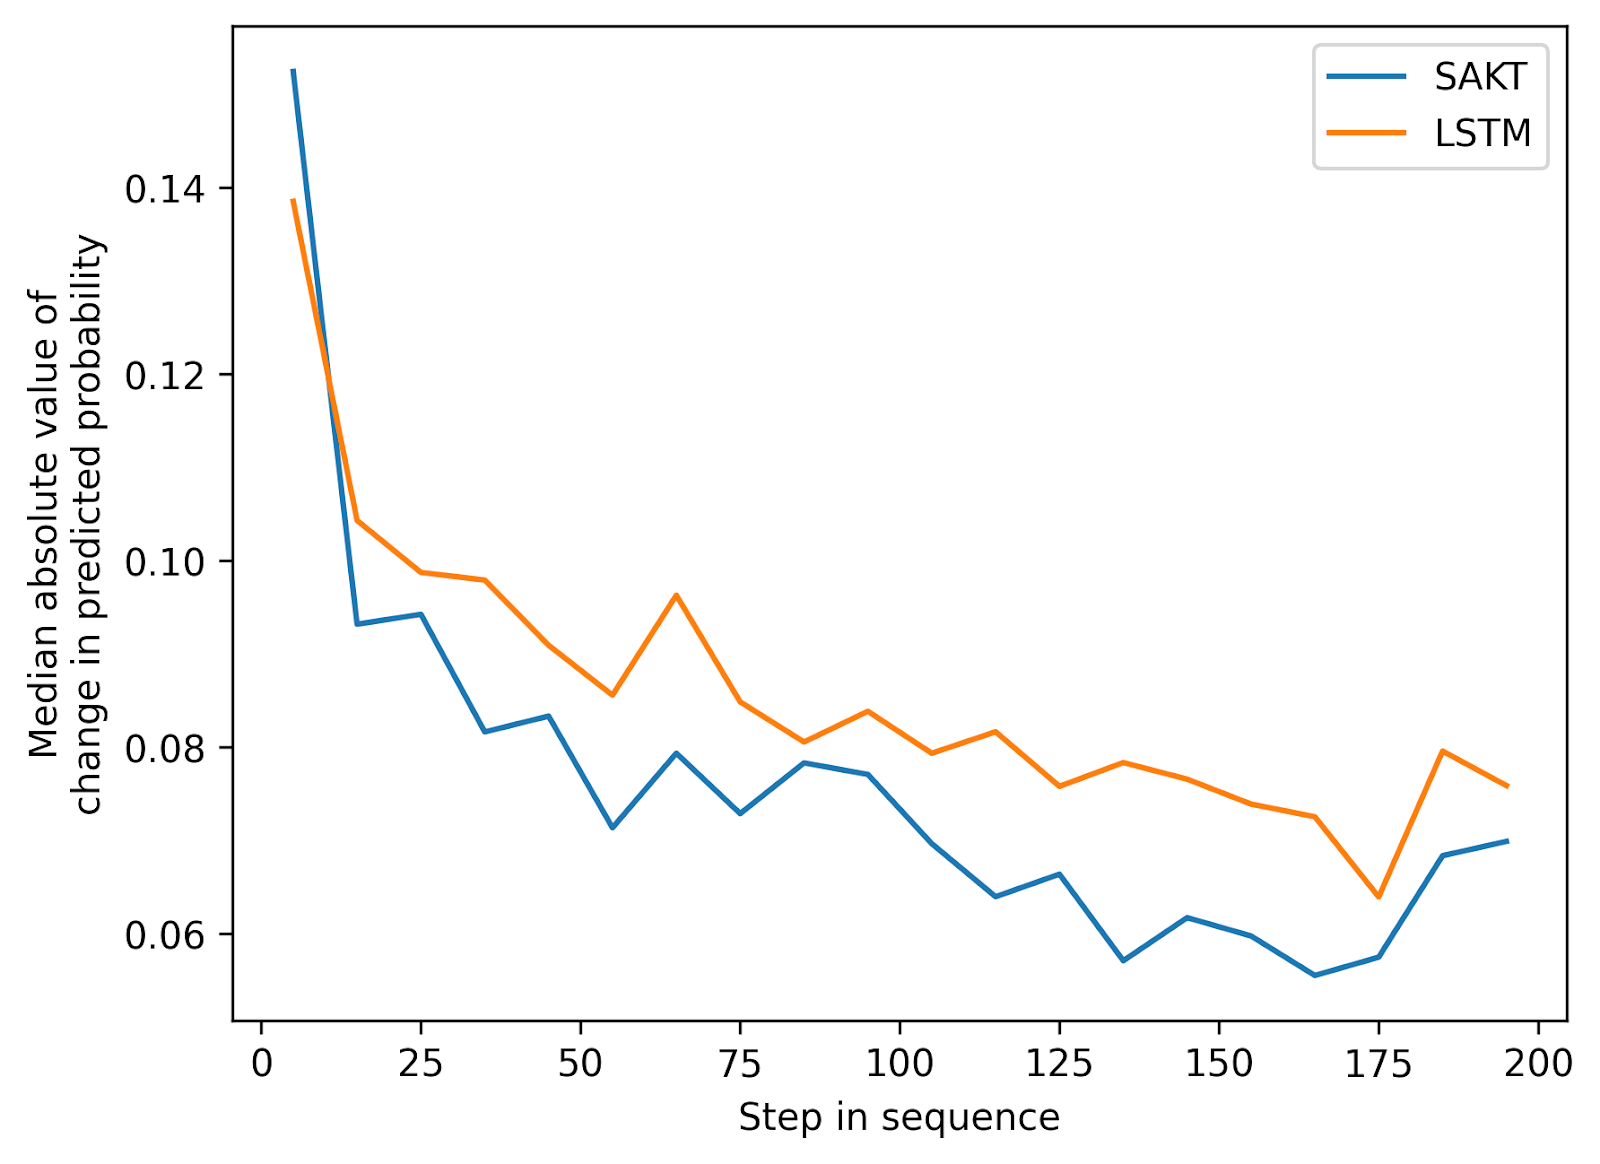
The results are shown on Figure 4, which plots the median of the absolute values of the change in the prediction of the following response. As seen in Figure 4, the impact of noise injection varies depending on where in the response sequence it occurs. Noise that occurs early in the sequence has a much bigger impact than noise that occurs later in the sequence. Moreover, the impact of noise tapers off to a steady decrease later in the sequence. This pattern is likely due to the fact that the models have fewer observations from each student earlier in the sequence, so individual responses are proportionally more meaningful, and therefore have a larger impact on the model predictions. After about 50 steps (which is a typical unit in a course), injected noise starts to have more of a modest absolute impact on the prediction (\(\sim \)0.06 - 0.1). Broadly, this indicates that the models become more stable and less sensitive to random perturbations as they accumulate more observations. This is a similar behavior to the previous section on the cold start problem, where the model needs to receive enough responses from a new student to become appropriately initialized.
3.4 Does the order of questions impact model predictions?
Student behavior, adaptive test mechanics, and a variety of other reasons can lead to students answering the same questions in different orders. However, teachers and students often have the common-sense expectation that if two students give the same responses to the same questions, the students should be interpreted to have the same ability, independent of the order of those questions. Given this expectation, and the intrinsic nature of order of training in DKT models, it is important to evaluate how DKT model respond to differences in question order.
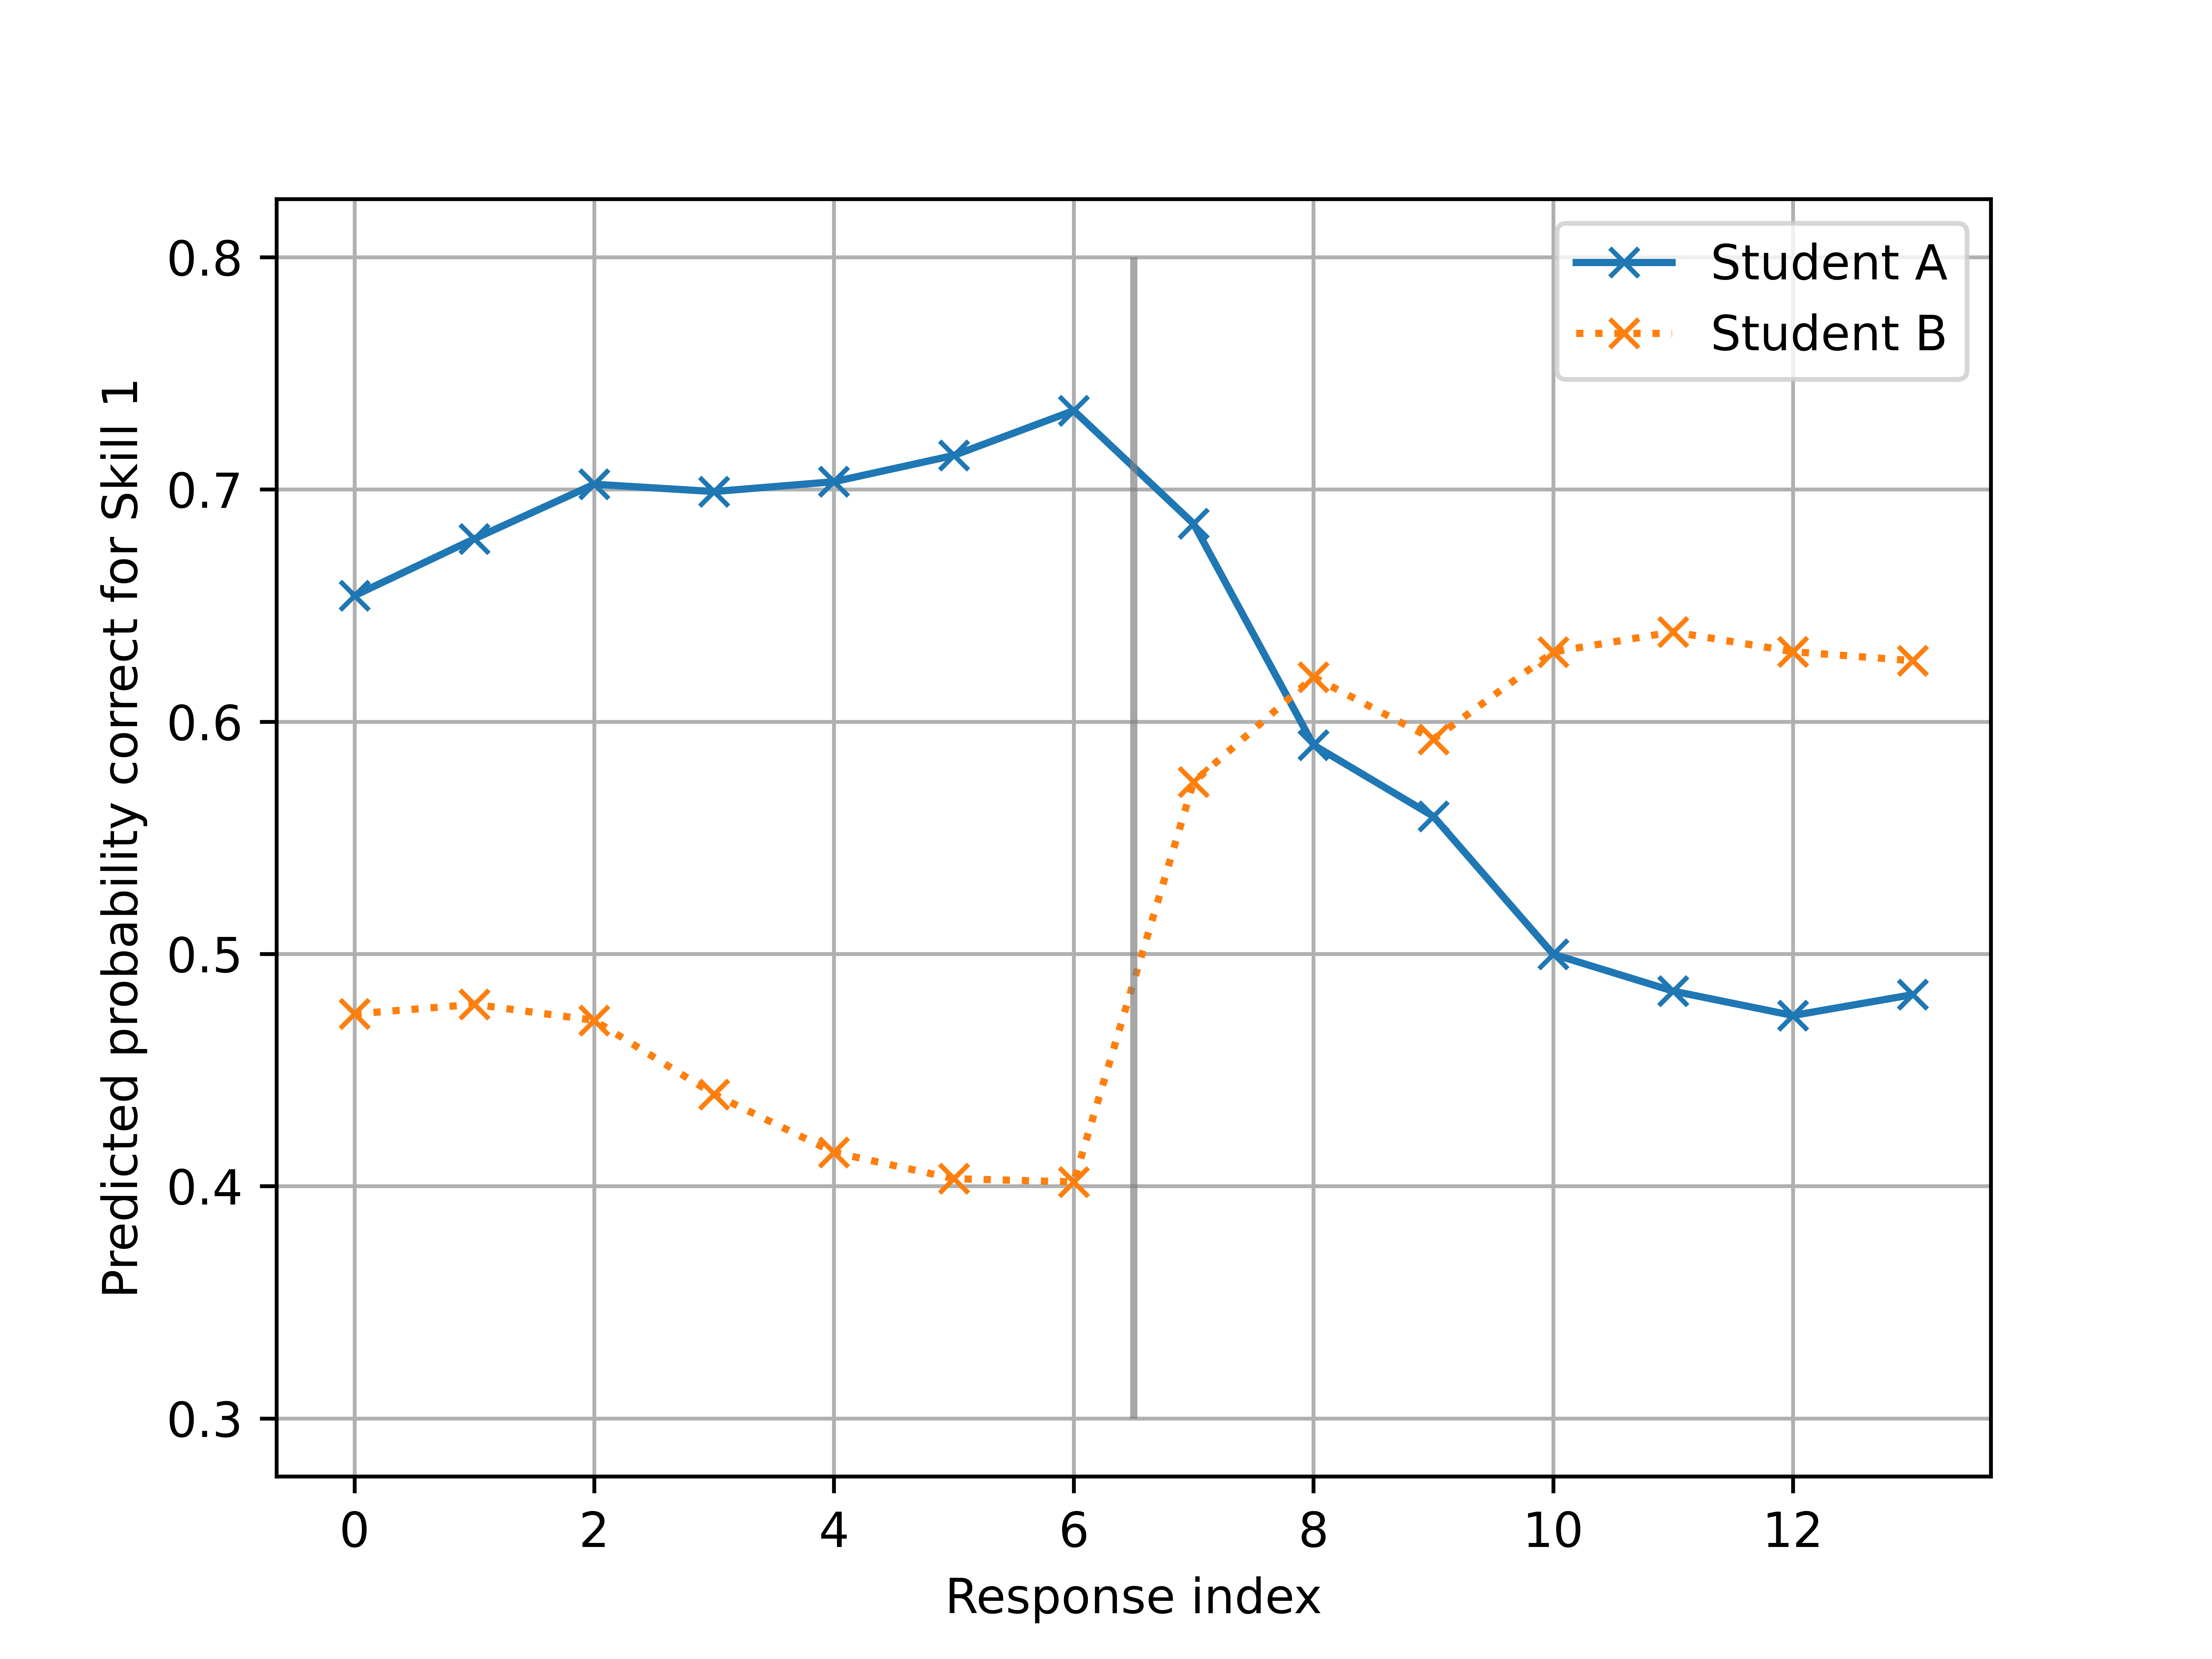
To address this, we prepared two response sequences from two synthetic students (Student A and Student B) responding to questions from two unrelated skills within the course ("ratios using tape diagrams" and "negative symbol as opposite", referred to as Skill 1 and Skill 2). Both students always responded correctly on questions from Skill 1 and incorrectly on questions from Skill 2. The only difference between the students was the order in which they responded. Student A responded to 7 questions on Skill 1 followed by 7 question on Skill 2 and Student B responded to 7 questions on Skill 2 followed by 7 questions on Skill 1. We then generated predictions for all questions for Skill 1 using SAKT at each step in the sequence. The average of those predictions are shown on Figure 5. Note that we also ran the analysis with the LSTM model and found similar results.
As seen on Figure 5, SAKT’s predictions for Student A (blue line) dropped after the 7th question when they started giving incorrect responses to Skill 2. For Student B (orange line), the predicted probability for Skill 1 dropped while giving incorrect responses to Skill 2 and then sharply increased when they began to give correct responses to Skill 1. Interestingly, by the end of the sequence, the predicted probability for Skill 1 for Student A and B differed by more than .10, despite having responded to the exact same questions identically, just in a different order. To confirm the general validity of this result, we repeated the analysis across all possible pairings of 38 exercises in 3 different units. The mean difference in the final predicted probabilities between the two differently ordered sequences was .28.
These results show that the order in which questions are answered has a profound impact on the DKT model’s predictions for a student. A streak of incorrect responses, even to unrelated questions, reduces the model’s predicted probability of correct responses to questions which have previously only been responded to correctly. We believe that this is caused by the model’s over reliance on whether recent answers are correct or incorrect rather than any real student behavior. In applications where the model is being used to give an assessment of a student’s knowledge across a wide variety of topics, this is an unwanted model behavior. This could potentially be addressed by altering the loss function so that it does not only provide feedback information about the single question that a student is responding to. Other researchers [11] have found that altering the loss to include the next response to all questions at each step helps to stabilize the model predictions. This approach could also be extended so that the loss also includes the previous responses given to each question, but further research is needed here.
4. DISCUSSION AND CONCLUSIONS
In this study, we evaluated two DKT models, SAKT and LSTM, with an emphasis on practical considerations. Across all comparisons, we found that LSTM and SAKT performed similarly enough to be functionally equivalent. Thus, model performance does not appear to be a reason to choose between these two models. It is worth noting that the low specificities (below 0.5 in all cases) found in this study suggests that these models should not be used in high-stakes applications, where important impacts arise from identifying students who do not understand particular concepts. While both DKT models showed better overall predictive performance than IRT, our evaluations also highlighted a number of undesirable behaviors from the DKT models that could present challenges for their practical implementation.
One issue is that the DKT models are inherently better at identifying correct responses than incorrect ones. This is despite the fact that the data has a sufficient number of incorrect responses to draw from (nearly 30% of all responses in the training set). As noted previously, we were unable to improve this issue by adding additional layers or features to the models. Until this issue can be resolved, the only recourse may be altering the classification threshold to reduce false negatives at the cost of more false positives. Whether it is even possible to improve performance is also an open question, as our finding that lower specificity predictions tended to come from students with isolated incorrect responses suggests a degree of unpredictability. Regardless, this shortcoming of the DKT models is problematic, as it means the models will have limited utility in helping to identify learning gaps for individual students.
A second issue is that the DKT models do not perform at their best until they have received a sufficient number of responses from a student (approximately 10 to 50 responses). This is true both in terms of predictive performance and robustness to input noise. To deal with this, applications can use alternative systems during the initial stages, for example using a fixed set of initial questions or an IRT based computer adaptive test mechanism to select appropriate questions until the DKT model is initialized. Unfortunately, these extra systems add complexity. An alternate route would be further research into how to control the prior expectations for a student in a DKT model. In a simple model such as IRT, a single ability parameter can be adjusted based on prior expectations about the student. This is harder to do in the more complex, high dimensional DKT models.
Finally, we found that the order in which a student responds to questions has a significant impact on how the DKT models predict that student’s performance. This is similar to the result found in [5], however we further find that the use of an attention mechanism in the SAKT model does not improve the model’s ability to capture long term skill dependencies. This order-dependent result makes the DKT models particularly unsuitable in applications where the model is used to assess the student’s overall knowledge over a large sequence of skills.
4.1 Example Applications
While we have identified several shortcomings of DKT models in the previous section, this does not necessarily disqualify them from use in practical environments. Indeed, the degree of impact ultimately depends on how they are used. To illustrate, we will consider two example use cases, the second being more impacted by the shortcomings of DKT than the first.
In the first use case, we can imagine a platform in which students practice skills from a course in a predefined order, and must respond to a minimum number of questions in each skill. The DKT model estimates the probability of correctly responding to questions from each skill as practice unfolds, and decides when students have reached a sufficient threshold of understanding to move on, or if they need to respond to additional practice questions. In this use case, the risk of the model misidentifying student knowledge gaps would be mitigated by the fact that the student must demonstrate their knowledge on at least one question in each skill. None of the limitations of the model performance would be critically problematic because the model is only given limited control, with guardrails of a minimum number of questions being asked so that skills with a knowledge gap are not skipped entirely.
In a second use case, we can imagine the same type of platform as the previous example, but students can practice the skills in any order. A DKT model uses available responses from each student to make predictions for all skills in the course as way to represent their knowledge state. Given that the order of the questions can have large impacts on the model’s estimates, this implementation could be problematic. A student who did poorly on the most recent questions would see their estimates across all skills drop – even skills on which they were successful. Conversely, a student who responded with a streak of correct responses would increase all estimates. These situations could erroneously inflate or deflate estimates for a student, potentially leading to poor self-regulated learning decisions or interventions by the teacher.
These examples demonstrate the the utility of evaluating KT models from a practical perspective. By having a more nuanced understanding of model performance, we can establish necessary guard rails and more readily determine whether a model is appropriate for a specific use case.
5. ACKNOWLEDGMENTS
This work was in part made possible thanks to Schmidt Futures.
We also want to thank Ralph Abboud and Thomas Christie
(LEVI), Andrew Lan (UMass), and Yunsung Kim (Stanford) for
reviewing code and providing feedback on this work. All
analysis code can be found on github using the following link:
https://github.com/byamkovenko/Knowledge-Tracing. We are
also grateful to Chenyen Wang, who posted their code publicly, on
which we were able to draw (https://github.com/THUwangcy).
6. REFERENCES
- G. Abdelrahman, Q. Wang, and B. Nunes. Knowledge tracing: A survey. ACM Computing Surveys, 55:1–37, 2023.
- Y. Bai, X. Li, Z. Liu, Y. Huang, T. Guo, M. Hou, F. Xia, and W. Luo. csKT: Addressing cold-start problem in knowledge tracing via kernel bias and cone attention. Expert Systems with Applications, 266:125988, Mar. 2025.
- R. D. Bock and R. D. Gibbons. Item response theory. John Wiley & Sons, 2021.
- A. T. Corbett and J. R. Anderson. Student modeling and mastery learning in a computer-based programming tutor. In C. Frasson, G. Gauthier, and G. I. McCalla, editors, Intelligent Tutoring Systems, pages 413–420, Berlin, Heidelberg, 1992. Springer Berlin Heidelberg.
- X. Ding and E. C. Larson. Why deep knowledge tracing has less depth than anticipated. International Educational Data Mining Society, 2019.
- T. Fawcett. An introduction to ROC analysis. Pattern Recognition Letters, 27(8):861–874, June 2006.
- S. Pandey and G. Karypis. A self-attentive model for knowledge tracing. In 12th International Conference on Educational Data Mining, EDM 2019, pages 384–389. International Educational Data Mining Society, 2019.
- F. Pedregosa, G. Varoquaux, A. Gramfort, V. Michel, B. Thirion, O. Grisel, M. Blondel, P. Prettenhofer, R. Weiss, V. Dubourg, J. Vanderplas, A. Passos, D. Cournapeau, M. Brucher, M. Perrot, and E. Duchesnay. Scikit-learn: Machine learning in Python. Journal of Machine Learning Research, 12:2825–2830, 2011.
- C. Piech, J. Bassen, J. Huang, S. Ganguli, M. Sahami, L. J. Guibas, and J. Sohl-Dickstein. Deep knowledge tracing. In C. Cortes, N. Lawrence, D. Lee, M. Sugiyama, and R. Garnett, editors, Advances in Neural Information Processing Systems, volume 28. Curran Associates, Inc., 2015.
- A. Vaswani, N. Shazeer, N. Parmar, J. Uszkoreit, L. Jones, A. N. Gomez, L. Kaiser, and I. Polosukhin. Attention is all you need. CoRR, abs/1706.03762, 2017.
- Q. Zhang, Z. Chen, N. Lalwani, and C. MacLellan. Modifying deep knowledge tracing for multi-step problems. In Proceedings of the 15th International Conference on Educational Data Mining, page 684, 2022.
© 2025 Copyright is held by the author(s). This work is distributed under the Creative Commons Attribution-NonCommercial-NoDerivatives 4.0 International (CC BY-NC-ND 4.0) license.