ABSTRACT
Teachers often rely on the use of a range of open-ended problems to assess students’ understanding of mathematical concepts. Beyond traditional conceptions of student open-ended work, commonly in the form of textual short-answer or essay responses, the use of figures, tables, number lines, graphs, and pictographs are other examples of open-ended work common in mathematics. While recent developments in areas of natural language processing and machine learning have led to automated methods to score student open-ended work, these methods have largely been limited to textual answers. Several computer-based learning systems allow students to take pictures of hand-written work and include such images within their answers to open-ended questions. With that, however, there are few-to-no existing solutions that support the auto-scoring of student hand-written or drawn answers to questions. In this work, we build upon an existing method for auto-scoring textual student answers and explore the use of OpenAI/CLIP, a deep learning embedding method designed to represent both images and text, as well as Optical Character Recognition (OCR) to improve model performance. We evaluate the performance of our method on a dataset of student open-responses that contains both text- and image-based responses, and find a reduction of model error in the presence of images when controlling for other answer-level features.
Keywords
1. INTRODUCTION
The blending of educational technologies with machine learning and statistical modeling has led to the emergence of tools designed to augment instruction. While some such tools are designed to automate certain tasks for the teacher (e.g. [3, 17, 2]), others attempt to improve the efficiency with which teachers are able to assess student work and write directed feedback to guide learning.
In the context of mathematics education, teachers utilize a range of question formats to assess students’ understanding of covered topics. Prior work has described these question types in terms of “close-ended” and “open-ended” problems, distinguishing various types of problems by the difficulty with which answers to such questions may be automatically assessed by a simple matching algorithm. Multiple choice or fill-in-the-blank problems, as examples of close-ended problems, often allow for a small number of acceptable “correct” answers (i.e. in most cases, there is a single answer considered as correct). Although prior works have demonstrated the utility of these types of answers for measuring student knowledge (e.g. the extensive work on knowledge tracing [9, 25]), teachers often rely on the use of open-ended problems to gain deeper insights into the processes and strategies employed by students to solve such problems, as well as their ability to articulate their approach using proper mathematical terminologies. Short answer and essay question types are common in this regard, often with prompts such as “explain your reasoning”, but other open-ended formats are also common in the domain of mathematics.
For mathematics, teachers often rely on the use of visual representations in conveying mathematical concepts. The use of diagrams, number lines, graphs, tables, and sometimes even pictographs are commonly used to portray numerical and algebraic relationships. Just as these are used for instruction, students are also commonly asked to generate these types of visual representations to demonstrate their understanding. While open-ended work has typically referred to the use of text and natural language within prior research (e.g. [13, 37, 4]), the definition extends to drawings and similar artifacts produced by students. Tools such as GeoGebra[18] and Desmos[12] are examples of computer-based applications that allow students to interact with graphs and algebraic expressions. While tools like these exist, many teachers still prefer to use more traditional technologies, often in the form of paper and pencil or other physical media (e.g. blocks) in conjunction with computer-based technologies; some systems encourage this blending of media by allowing students to take pictures of their work and upload them as responses to open-ended problems.
This paper builds on prior work which focused on the development of an automated scoring tool for student answers to open response problems in mathematics [4]. Baral et. al, reported on how many students responded to open-response problems with images of their work (in the form of written mathematical equations and expressions as well as drawings of graphs, number lines, and other visual representations), whereas several others preferred to respond with a combination of an image of their work combined with a typed textual explanation within a single student response (e.g. the student draws a graph, uploads the image and then types a description of their thought process with the image of the graph). These cases were, unsurprisingly, found to contribute significantly to the model error as the presence of images in student responses were not previously accounted for within the developed methods. This work seeks to take initial steps toward understanding how recent advancements in areas of deep learning-based image and text embedding methods may help to address these challenges.
Specifically, this paper addresses the following research questions:
- Does the use of pre-trained deep learning image and text embedding methods lead to improved performance in the context of previously-developed open response scoring models?
- Are there differences in terms of the resulting model performance when comparing across different types of image-supporting embedding methods?
- Does the incorporation of image-supporting embedding methods reduce the correlation between the presence of images in student responses and modeling error when accounting for other answer-level covariates?
2. RELATED WORKS
2.1 Automated Scoring Models
With the development of online learning platforms, there has been a growing body of research in the development of automated methods of assessment for analyzing and providing immediate feedback on students’ work. These developments have prevailed in multiple domains of science [23, 6], programming[24, 26, 35], writing[21, 1, 8, 29, 39], mathematics[22, 13, 4] and college level courses[11]. In the domain of mathematics, auto-scoring have been developed for closed-ended problems with single or limited correct answers(e.g., multiple-choice question, fill-in-the-blank, check all that apply) [3, 17] to more open-ended problems with multiple possible solutions (eg. short answer, long answer, Explain in plain english.) [22, 13, 14, 4, 37, 38, 5, 32]. Some of these works support pure mathematical content [22], while others support combination of both mathematical and textual answers[13, 4, 5, 38]. However, most of these auto-scoring methods in mathematical domains are limited to either text or mathematical content, and a very few have started focusing on automating responses for image-based responses.
2.2 Methods for Image Analysis and Representation
Optical Character Recognition (OCR) is an extensive field of research in image processing, that explores the recognition and conversion of handwritten textual information to machine-encoded text, such that this information could be further processed and analyzed. Studies such as Shaikh et al. (2019) [31], utilizes OCR-based methods, combined with Convolutional Neural Networks(CNN) in auto-scoring structured handwritten answer sheets of multiple choice questions. Other studies like [34] propose an automated scoring system for handwritten student essays in reading comprehension tests, utilizing handwriting recognition and machine learning-based automated essay scoring methods. Khuong et. al [20] in their work proposes clustering handwritten mathematical answers scanned from paper-based exams, to improve the efficiency of human raters in scoring these answer sheets. Another study from Gold et. al [15], in their attempt to auto-score handwritten answers, presents the challenges of using handwriting in intelligent tutoring systems. Further, they present, how the lack of better recognition systems in these cases leads to poor scoring performances.
Recent advancements in the areas of deep learning and computer vision have led to the development of large-scale models of image representation and classification. ImageNet [10] is a large-scale image dataset widely used for training and evaluating computer vision models. Trained over 14 million images belonging to more than 22,000 different classes, ImageNet is considered a benchmark for image classification tasks. CLIP (Contrastive Language-Image Pre-training) [27] is a recently introduced image classification model based on transformer architecture, commonly used in natural language processing tasks. This method is able to encode both natural languages (text) and images in the same vector space by using a multi-modal pre-training approach. The proposed methods in this work utilizes the CLIP model to represent image and text-based answers.
2.3 The SBERT-Canberra Model
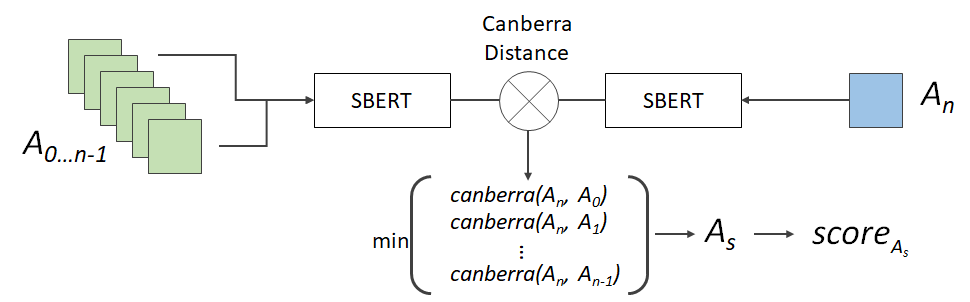
This work utilizes an auto-scoring method developed through several prior works [4, 7], referred to as the SBERT-Canberra model. As illustrated in Figure 1, the method produces a predicted score, \(score_{A_s}\), for a new student answer, \(A_n\), by leveraging the single-most-similar historic student answer, \(A_s\). The method utilizes Sentence-BERT [28] to first generate a 768-valued feature vector for both \(A_n\) as well as all teacher-scored historic student answers, \(A_{0...n-1}\) before then making a full pairwise comparison of \(A_n\) to these historic answers using Canberra distance[19]; Canberra distance is a rank-order-based distance measure that was found to more closely align to how teachers identify similarity in comparison to other distance measures such as Euclidean and Cosine Similarity [7]. From this, \(A_s\) is identified and its teacher-given score is used as the prediction for \(A_n\); the method, therefore, adopts a variation of K-Nearest-Neighbors and has exhibited notable performance when evaluated compared to a range of baseline models [4, 13], despite its simplicity.
Through prior work, several weaknesses of the auto-scoring method have also been identified by means of a multi-level regression-based error analysis [4]. From this, four primary areas of weakness were identified: 1) model error varied greatly from problem to problem, 2) there seemed to be variation in teacher grading, 3) the presence of numbers, expressions, and equations in textual explanations correlated with higher error, and 4) the presence of images in student answers correlated with higher error. Subsequent follow-up works have explored three out of these four weaknesses, examining how answers from similar problems can be leveraged to improve predictive power for problems with smaller sample sizes [30], explore the contextual factors that contribute to variance in teacher grading practices [16], and leverage the most-frequent mathematic terms, numbers, and expressions to reduce modeling error [5]. Following these works, this paper seeks to address the fourth weakness by exploring potential methods of representing both textual and image data within similar embedding spaces.
3. DATASET
In this study, we utilize a dataset of student open-ended answers in mathematics from the prior studies [4], to compare directly with the prior works. This dataset consists of 150,477 students’ answers to 2,076 different open-ended mathematics problems and scores given by 970 different teachers to these responses. The scores given by teachers to these responses are on an ordinal 5-point scale ranging from 0 to 4. The student responses given to these math-based questions are typically seen as a combination of textual responses (typed directly into the learning platform), mathematical expressions and equations, and images uploaded as a part of their work. The current dataset includes 3712 image responses in total to 311 different math problems. Some example image responses given by students are presented in Figure 2. As seen from these examples, the image-based student answers are of different types – some are handwritten, whereas others are digitally drawn images. In addition to this, these images can include handwritten text, diagrams, and graphs on a piece of paper. We can see lots of variations in these responses, in both text and image format.
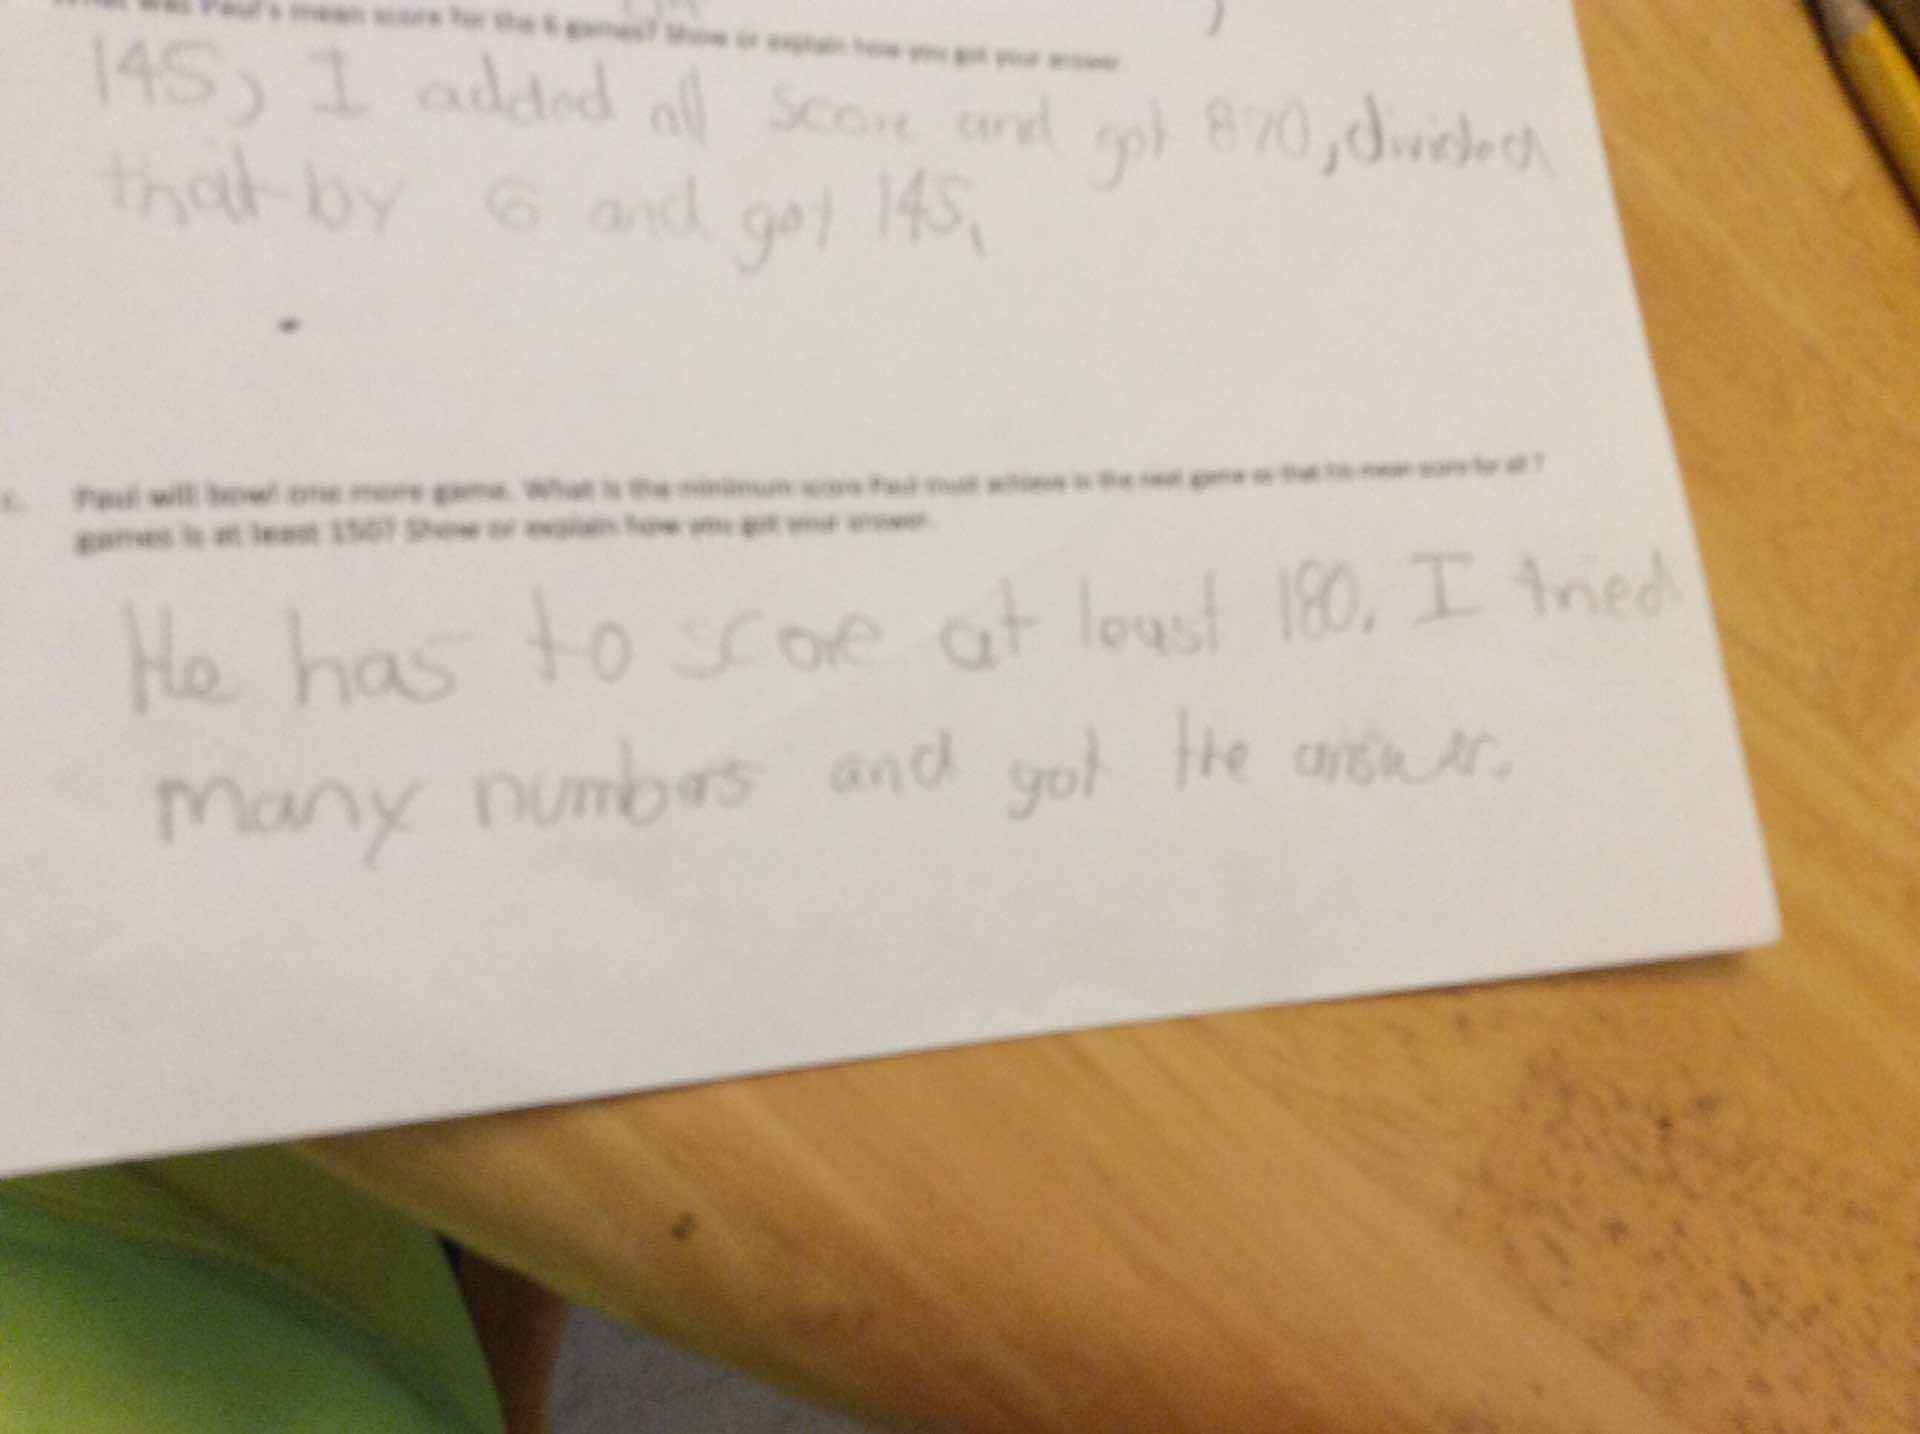
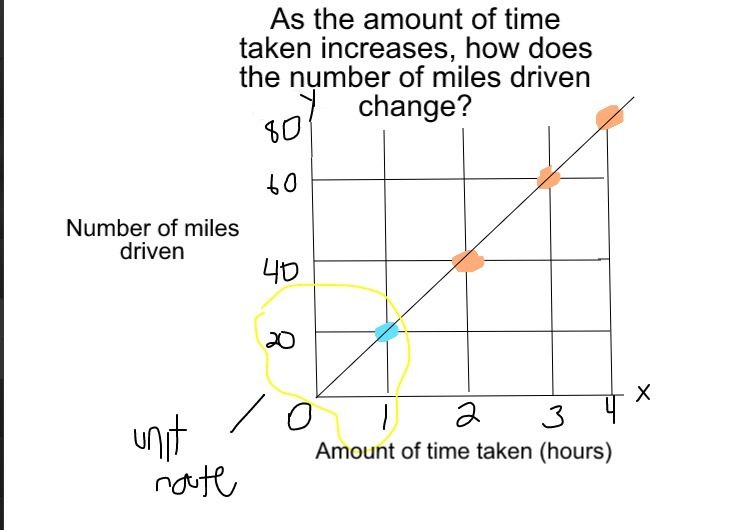
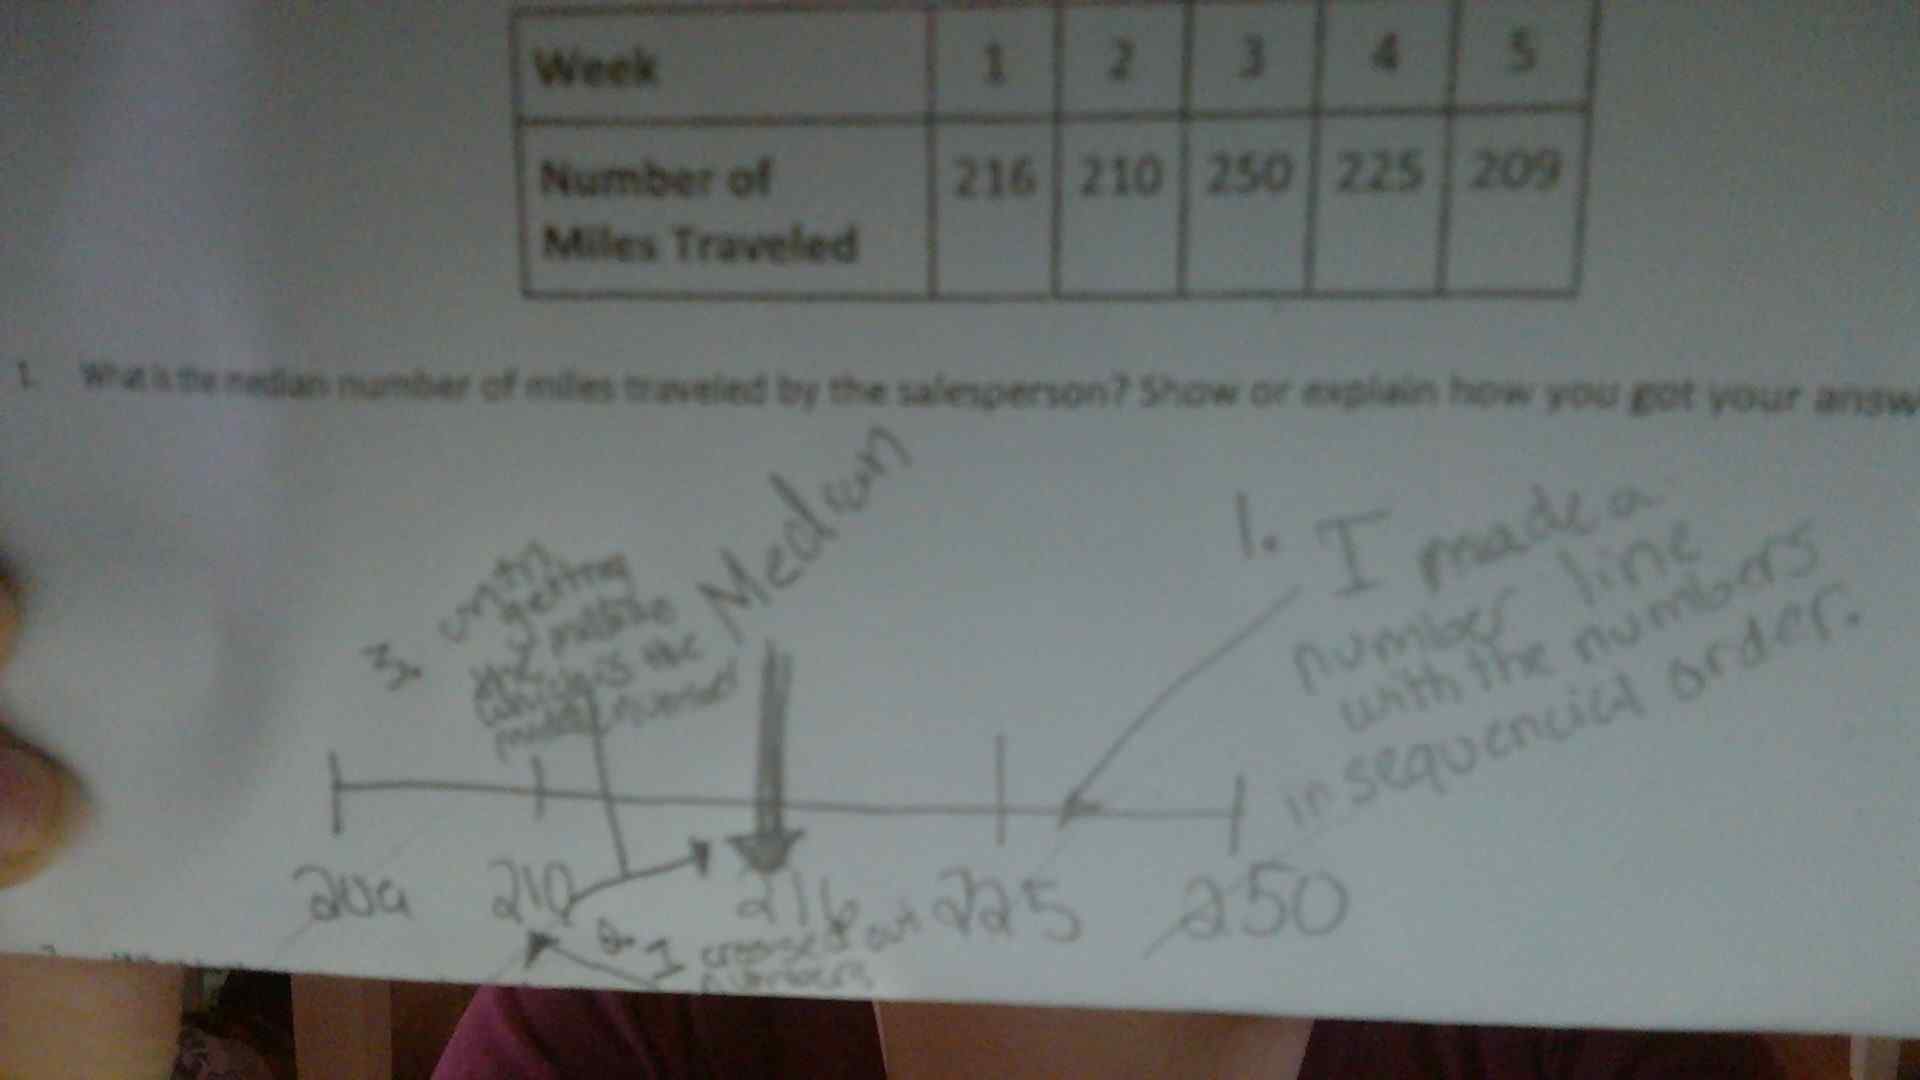
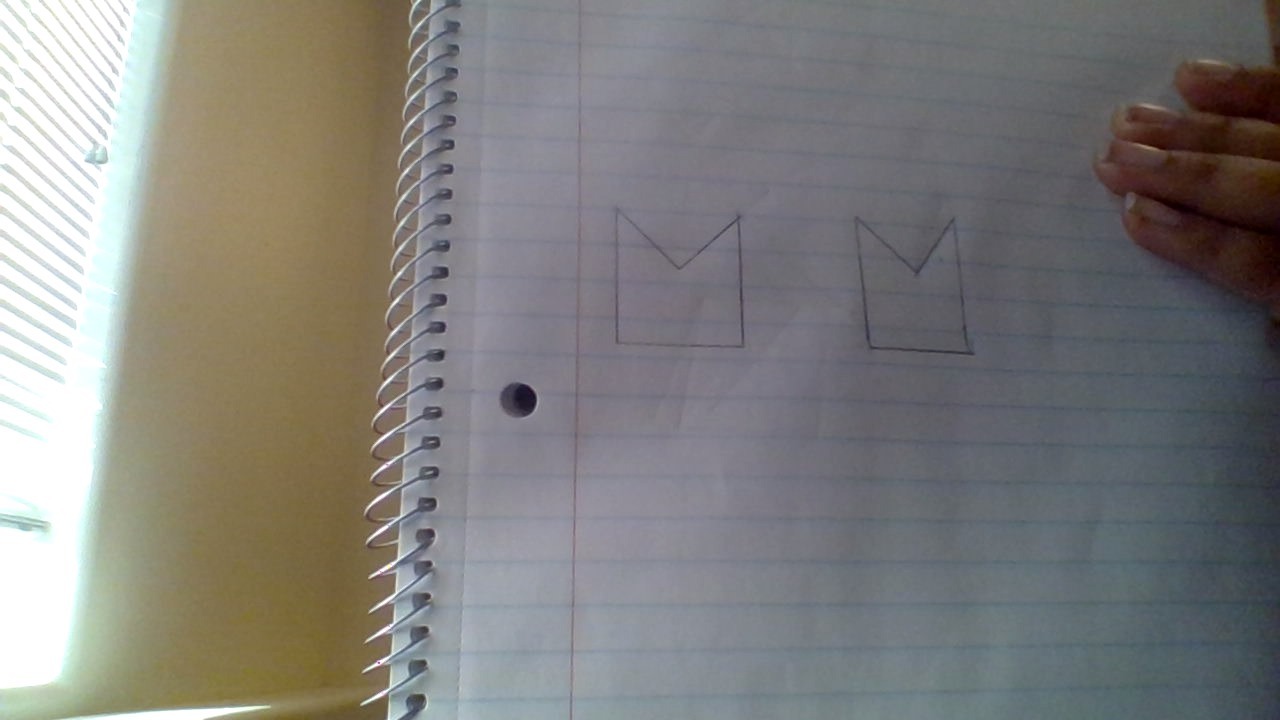
Figure 2: Examples of image-based responses from students given in response to Open-ended math problems
4. METHODOLOGY
Utilizing the dataset from [4] and a similar model design to auto-scoring student open-response answers, we propose an extension to this prior work to support image-based responses. Similar to [4], we train a separate model per problem and perform a 10-fold cross-validation for training. For the problems without any training data, a default model based on word counts, trained across all problem data is used similarly to the prior works. In this paper, we explore and compare three different methods which we describe in detail in the following sections.
4.1 CLIP-Text Method
As stated earlier, the prior works [4], is a similarity ranking-based method, that first converts each student’s answers to a 768-valued vector representation using Sentence-BERT[28], and compares answers using this vector representation and Canberra distance[19]. In our current method, we use a similar model structure with a different embedding method. This method is based on CLIP (Contrastive Language–Image Pre-training)[27] for encoding textual responses.
In the first method which we call the ‘CLIP-Text’ Method, we perform a text comparison similar to the prior SBERT-Canberra model, without accounting for image-based responses. Using the CLIP[27] model, we first embed the textual responses ignoring all the image responses. For any new answer in the test dataset, we compare them with the training set, by first generating a vector representation, and then comparing the vectors using Canberra distance to find the most similar pair of text responses. Using the most similar text, we utilize the score given by teachers to this similar response, in suggesting a score for the new response. In the CLIP-Text Method, we ignore the images, as we want to see how well the CLIP model does with just the text responses to directly compare it to the prior method. For any empty student responses, the model assigns a score of ‘0’, and also for responses with no textual answers (images are discarded in this method, so if a response contains only an image, it is assigned a score of 0).
4.2 CLIP-Image Method
The second method which we call ‘CLIP-Image’ method, addresses both images and text in student responses. This method is similar to the ‘CLIP-Text’ method, with the addition of image embeddings in comparing the similarity of responses. The CLIP model uses separate text and image encoders and allows embedding text and images into the same vector space. With the CLIP model, we first encode textual and image responses into a vector representation. If a student response contains both text and images, the text part is discarded and just the images are encoded in this method. Once all the responses in the training data are encoded, for a new student answer (with either image or text-based response), its corresponding encoding is calculated and compared to the embeddings in the training data, and the most similar response is selected based on the shortest Canberra distance between the new response and the responses in the training set.
4.3 CLIP-OCR Method
The third method is called ’CLIP-OCR’ method which is based on state-of-the-art Optical Character Recognition (OCR). This method uses the Tesseract engine[33] from Google for text extraction. Tesseract is an open-source OCR engine, that extracts both printed and written text from images. Similar to the ‘CLIP-Text’, this method, then encodes the original textual responses, and also the extracted text from images (without completely ignoring the image responses). The text information from the responses is then encoded using the CLIP model, and finally, any new response is compared to the historic responses in the training data using the encodings and Canberra distance, to get a score prediction.
5. RESULTS
| Model | AUC | RMSE | Kappa | |||
|---|---|---|---|---|---|---|
Current Paper | ||||||
| Rasch* + CLIP-Text | 0.852 | 0.594 | 0.469 | |||
| Rasch* + CLIP-Image | 0.854 | 0.587 | 0.471 | |||
| Rasch* + CLIP-OCR | 0.854 | 0.588 | 0.471 | |||
Prior works[4] | ||||||
| Baseline Rasch | 0.827 | 0.709 | 0.370 | |||
| Rasch* + Random Forest | 0.850 | 0.615 | 0.430 | |||
| Rasch* + SBERT-Canberra | 0.856 | 0.577 | 0.476 | |||
| *These rasch models also included the number of words. | ||||||
To answer our first and second research questions, we compare the current approaches directly to the prior methods from [13, 4]. We utilize similar evaluation methods, using a Rasch model[36] 1 that is equivalent to a traditional item response theory (IRT) model. This model aims to determine distinct parameters for each student and problem, representing student ability and problem difficulty, respectively. The rationale behind using this model is to allow a fairer comparison that accounts for factors external to the observed student response, such that the automated scoring model is evaluated solely based on its capacity to interpret the text in each student’s response.
We evaluate the methods using three different metrics – AUC score, Root Mean Squared Error (RMSE), and multi-class Cohen’s Kappa. The AUC score here is calculated as an average AUC over each score category and Root Mean Squared Error(RMSE) is calculated using the model estimates as a continuous-valued integer scale. The results of three methods as compared to the prior works [4] are presented in Table 1.
The result suggests that the CLIP-Text that uses the sentence embeddings from OpenAI CLIP model [27] has an AUC score of 0.852, RMSE error of 0.594, and Kappa of 0.469. Though the model doesn’t outperform the prior SBERT-Canberra method [4] of auto-scoring, the difference in each of the scores is very small. The next method CLIP-Image, which compares both sentence and image embeddings using the OpenAI CLIP model, outperforms the CLIP-Text method across all three evaluation metrics used (though the difference in these scores is minimal). This method has an AUC score of 0.854, RMSE error of 0.587, and Kappa of 0.469. The next method CLIP-OCR, based on text extraction from images using OCR methods, has a similar performance to the CLIP-Image model. Though the newly introduced methods do not outperform the prior text-based method, the introduction of auto-scoring image responses is something novel that this work explores. And we can see improved performance with the addressing content from image-response in the CLIP-Image and CLIP-OCR model, than solely using text-based responses in the CLIP-Text model.
| CLIP-Text | CLIP-Image | CLIP-OCR
| ||||||||
|---|---|---|---|---|---|---|---|---|---|---|
| B | Std. Error | B | Std. Error | B | Std. Error | |||||
| Intercept | 0.379*** | 0.005 | 0.361*** | 0.005 | 0.361*** | 0.005 | ||||
| Length of Answer | 0.002*** | 0.000 | 0.002*** | 0.000 | 0.002*** | 0.000 | ||||
| Avg. Word Length | 0.012*** | 0.001 | 0.015*** | 0.001 | 0.015*** | 0.001 | ||||
| Numbers Count | 0.0002*** | 0.000 | 0.0002*** | 0.000 | 0.0002*** | 0.000 | ||||
| Operators Count | -0.001** | 0.000 | -0.001** | 0.000 | -0.001** | 0.000 | ||||
| Equation Percent | 0.139*** | 0.008 | 0.158*** | 0.008 | 0.156*** | 0.008 | ||||
| Presence of Images | 2.418*** | 0.018 | 0.472*** | 0.018 | 0.560*** | 0.018 | ||||
*p <0.05 **p<0.01 ***p<0.001; | ||||||||||
6. ERROR ANALYSIS
To answer our third research question and to explore if the proposed image-supporting methods lead to improvements in the model’s performance in the presence of images, we conduct an error analysis of the proposed methods. As previously introduced, prior work conducted an error analysis to understand the limitations of the SBERT-Canberra method [4]. This error analysis involved the calculation of several student answer-level features and using a linear regression analysis with the absolute prediction error (absolute difference between the teacher-provided score and the prediction from the model) as the dependent variable. This analysis reported that the largest amount of error in the SBERT-Canberra model was correlated with the presence of mathematical terms and equations and the presence of images in the answer text.
In this paper, we propose a method to auto-score responses in the presence of both text and images. Although the proposed methods do not outperform the previous method on auto-scoring strictly text-based answers, we hypothesize that this could be a result of using a different method of embedding text; there may be an inherent trade-off where performance is reduced for textual responses but results in improved performance where there are images (averaging out to little-to-no overall improvement). Also, from the results, we have seen improvements in the performance of the ‘CLIP-Image’ and ‘CLIP-OCR’ methods (that addresses the content of the image when auto-scoring) over the ‘CLIP-Text’ method (which is just based on text responses). To further study the factors that contribute to the error of these models, and to verify whether introducing image components in the text-based models actually improve the performance in the presence of images, we replicate the error analysis from Baral et. al [4]. Using features from student answers including ‘Length of answer’, ‘Average word length’, ‘Total numbers count’, ‘Total operators’, ‘Percentage of equations’ and ‘Presence of images’ as the dependent variables and Absolute model error as the independent variable, we perform three different linear regression analyses corresponding to the three proposed methods for auto-scoring.
6.1 Results of Error Analysis
The results of the error analysis are presented in Table 2. All the features from student answers are statistically significant in predicting the modeling error in all three proposed methods. However, most of these features have low coefficient values, suggesting a relatively small effect, with the exception of ‘Equation Percent’ and ‘Presence of Images’ which are positively correlated with the model error in all three cases. This is similar to the results of error analysis from prior study [4]. For the ‘CLIP-Text’ model, the coefficient for the presence of images is 2.418, suggesting that the presence of images in answers attributes to a notable amount of error in the model prediction, even when considering the difference in feature scaling. However, the coefficient value decreases to 0.472 in the ‘CLIP-Image’ method, and 0.560 in the ‘CLIP-OCR’ method. This decrease suggests that the introducing image component to the ‘CLIP-Text’ method using embedding and OCR-based text extraction actually helped the model improve in the presence of images. It is also important to note that this work does not explicitly address mathematical terms (including numbers, expressions, and equations) in the score prediction as has been suggested by other work [5]. Also, we see a slight increase in the coefficient values for equation percentage from ‘CLIP-Text’ to ‘CLIP-Image’ and ‘CLIP-OCR’. For the ‘CLIP-Text’ method, we discard any images from the answer text, whereas for the other two methods, if there is a response that contains both image and text we discard the text from these responses and just consider the images. The change in the coefficient values for equation percent could be a result of this quality.
Following the error analysis procedure introduced in [4], we additionally applied a multi-level model to examine model error while accounting for clustered variance at the teacher-, problem-, and student-levels. We used a similar regression model with answer-level variables at level 1 (i.e. those listed in Table 2) and teacher-, problem-, and student- identifiers at level 2 as random effects. As before we again observed model error as the dependent variable. Controlling for these additional random effects did not lead to differences in the interpretation of our results; for this reason, we have omitted these additional regression results due to space limitations.
7. LIMITATIONS AND FUTURE WORKS
This paper represents an initial step toward improving state-of-the-art methods for auto-scoring student responses to mathematical problems in the presence of images. This is a preliminary work conducted towards exploring the feasibility and challenges in auto-scoring student image responses in the mathematical domain. Thus, the methods presented have several limitations and challenges that can be addressed with future work.
The proposed methods in this work use the CLIP model [27] trained on a large variety of datasets of images and natural language available over the internet. While this method shows promising results in recognizing a range of common objects, the pre-trained model may not have been exposed to the dataset of student hand-written or hand-drawn mathematics; the model was trained for application in very broad domains to recognize objects and is not optimized for identifying similar responses on paper. It has also been found that while the CLIP model learns a capable OCR system, it exhibits low accuracy in the case of handwritten digits in the widely-used MNIST dataset [27]. Further, fine-tuning this model on a mathematical dataset could lead to better model performance.
It is also important to note that the OCR method is based on the Tesseract [33] engine; this is rather a traditional OCR method and more recent advancements in OCR technology may be explored in the future to achieve improved results. Additionally, this method is known to be sensitive to poor-quality images, complex backgrounds, variation in handwriting styles, and ambiguity in the characters [33]. All of these are the common qualities of the images found in our dataset. While this method supports digital images (that are screenshots of work done on a computer), the method has low accuracy in extracting textual information from handwritten answers. Thus, exploring better OCR methods that support both handwritten and digital textual answers would better improve these auto-scoring methods for images. Further, both of the proposed methods that support images, inherently discard the additional text if present in the response. These texts may present additional supporting information to the image-based answers, so it is important to explore how to address this when evaluating these responses.
Apart from the limitation mentioned above, the process of analyzing and processing these image-based answers in itself is a challenging task, as we can see a lot of variation in these images of student-provided answers. Figure 2, presents some examples of image-based student answers. The student work in these images are not always clearly presented and structured – some handwriting is hard to read, the images sometimes are of low resolution and are blurry, the use of pencils makes the writing feint and hard to read, and lacks consistent formatting. Due to the freedom provided to students by the use of paper and pencil to draw out their solution, the resulting answer is not always structured in the same way from student to student. Future work could help address some of these challenges by implementing a more rigorous cleaning and preprocessing procedure prior to applying any image representation models. Cropping images to focus on the prominent aspects of student work, rotating images to improve the consistency of orientation, and even color correction can help improve the clarity of the work.
In all of this work, there are also several ethical concerns that should be considered in developing and applying these various methods. Images may contain Personally Identifiable Information(PII) such as students’ names, faces, skin color, etc. which exposes a potential risk of biases or disparate performance in regard to the machine learning models. Future works could mitigate some of these challenges by utilizing some of the pre-processing methods described above, but also emphasizes the importance of evaluating these scoring models for potential biases or unfairness in their predictions.
8. CONCLUSION
In this study, we have presented preliminary work towards developing an auto-scoring method for student response in mathematics that includes images. By building upon the prior research in auto-scoring text-based mathematical answers, we have proposed methods for representing and scoring image-based responses. In addressing our first research question, our proposed methods did not outperform the current state-of-the-art approach for auto-scoring, but they did exhibit comparable performance across all three evaluation metrics used. Addressing our second research question, we did not find meaningful differences between the different image-supporting embedding methods. The results of the conducted error analysis, in alignment with our third research question, further indicate that using pre-existing methods of text and image embeddings can enhance the performance of the auto-scoring models in the presence of images. Our findings from this study point toward new directions for research in the area of analyzing and processing image-based student responses in mathematics.
9. ACKNOWLEDGMENTS
We thank multiple grants (e.g., 1917808, 1931523, 1940236, 1917713, 1903304, 1822830, 1759229, 1724889, 1636782, 1535428, 1440753, 1316736, 1252297, 1109483, & DRL-1031398); IES R305A170137, R305A170243, R305A180401, R305A120125, R305A180401, & R305C100024, P200A180088 & P200A150306, as well as N00014-18-1-2768, Schmidt Futures and a second anonymous philanthropy.
10. REFERENCES
- L. K. Allen, M. E. Jacovina, and D. S. McNamara. Computer-based writing instruction. Grantee Submission, 2016.
- P. An, K. Holstein, B. d’Anjou, B. Eggen, and S. Bakker. The ta framework: Designing real-time teaching augmentation for k-12 classrooms. In Proceedings of the 2020 CHI Conference on Human Factors in Computing Systems, pages 1–17, 2020.
- J. R. Anderson, A. T. Corbett, K. R. Koedinger, and R. Pelletier. Cognitive tutors: Lessons learned. The journal of the learning sciences, 4(2):167–207, 1995.
- S. Baral, A. F. Botelho, J. A. Erickson, P. Benachamardi, and N. T. Heffernan. Improving automated scoring of student open responses in mathematics. International Educational Data Mining Society, 2021.
- S. Baral, K. Seetharaman, A. F. Botelho, A. Wang, G. Heineman, and N. T. Heffernan. Enhancing auto-scoring of student open responses in the presence of mathematical terms and expressions. In International Conference on Artificial Intelligence in Education, pages 685–690. Springer, 2022.
- S. Bhatnagar, N. Lasry, M. Desmarais, and E. Charles. Dalite: Asynchronous peer instruction for moocs. In European Conference on Technology Enhanced Learning, pages 505–508. Springer, 2016.
- A. Botelho, S. Baral, J. A. Erickson, P. Benachamardi, and N. T. Heffernan. Leveraging natural language processing to support automated assessment and feedback for student open responses in mathematics. Journal of Computer Assisted Learning, 2023.
- J. Burstein, J. Tetreault, and N. Madnani. The e-rater® automated essay scoring system. In Handbook of automated essay evaluation, pages 77–89. Routledge, 2013.
- A. T. Corbett and J. R. Anderson. Knowledge tracing: Modeling the acquisition of procedural knowledge. User modeling and user-adapted interaction, 4(4):253–278, 1994.
- J. Deng, W. Dong, R. Socher, L.-J. Li, K. Li, and L. Fei-Fei. Imagenet: A large-scale hierarchical image database. In 2009 IEEE conference on computer vision and pattern recognition, pages 248–255. Ieee, 2009.
- P. Denny, A. Luxton-Reilly, and J. Hamer. Student use of the peerwise system. In Proceedings of the 13th annual conference on Innovation and technology in computer science education, pages 73–77, 2008.
- D. Ebert. Graphing projects with desmos. The Mathematics Teacher, 108(5):388–391, 2014.
- J. A. Erickson, A. F. Botelho, S. McAteer, A. Varatharaj, and N. T. Heffernan. The automated grading of student open responses in mathematics. In Proceedings of the Tenth International Conference on Learning Analytics & Knowledge, pages 615–624, 2020.
- M. Fowler, B. Chen, S. Azad, M. West, and C. Zilles. Autograding" explain in plain english" questions using nlp. In Proceedings of the 52nd ACM Technical Symposium on Computer Science Education, pages 1163–1169, 2021.
- C. Gold and T. Zesch. Exploring the impact of handwriting recognition on the automated scoring of handwritten student answers. In 2020 17th International Conference on Frontiers in Handwriting Recognition (ICFHR), pages 252–257. IEEE, 2020.
- A. Gurung, A. F. Botelho, R. Thompson, A. C. Sales, S. Baral, and N. T. Heffernan. Considerate, unfair, or just fatigued? examining factors that impact teacher. In Proceedings of the 30th International Conference on Computers in Education., 2022.
- N. T. Heffernan and C. L. Heffernan. The assistments ecosystem: Building a platform that brings scientists and teachers together for minimally invasive research on human learning and teaching. International Journal of Artificial Intelligence in Education, 24(4):470–497, 2014.
- M. Hohenwarter and M. Hohenwarter. Geogebra. Available on-line at http://www. geogebra. org/cms/en, 2002.
- G. Jurman, S. Riccadonna, R. Visintainer, and C. Furlanello. Canberra distance on ranked lists. In Proceedings of advances in ranking NIPS 09 workshop, pages 22–27. Citeseer, 2009.
- V. T. M. Khuong, H. Q. Ung, C. T. Nguyen, and M. Nakagawa. Clustering offline handwritten mathematical answers for computer-assisted marking. In Proc. 1st Int. Conf. on Pattern Recognit. and Artificial Intelligence, Montreal, Canada, pages 121–126, 2018.
- Y.-S. G. Kim, C. Schatschneider, J. Wanzek, B. Gatlin, and S. Al Otaiba. Writing evaluation: rater and task effects on the reliability of writing scores for children in grades 3 and 4. Reading and writing, 30(6):1287–1310, 2017.
- A. S. Lan, D. Vats, A. E. Waters, and R. G. Baraniuk. Mathematical language processing: Automatic grading and feedback for open response mathematical questions. In Proceedings of the second (2015) ACM conference on learning@ scale, pages 167–176, 2015.
- K. Leelawong and G. Biswas. Designing learning by teaching agents: The betty’s brain system. International Journal of Artificial Intelligence in Education, 18(3):181–208, 2008.
- A. Mitrovic. An intelligent sql tutor on the web. International Journal of Artificial Intelligence in Education, 13(2-4):173–197, 2003.
- C. Piech, J. Bassen, J. Huang, S. Ganguli, M. Sahami, L. J. Guibas, and J. Sohl-Dickstein. Deep knowledge tracing. Advances in neural information processing systems, 28, 2015.
- T. Price, R. Zhi, and T. Barnes. Evaluation of a data-driven feedback algorithm for open-ended programming. International Educational Data Mining Society, 2017.
- A. Radford, J. W. Kim, C. Hallacy, A. Ramesh, G. Goh, S. Agarwal, G. Sastry, A. Askell, P. Mishkin, J. Clark, et al. Learning transferable visual models from natural language supervision. In International Conference on Machine Learning, pages 8748–8763. PMLR, 2021.
- N. Reimers and I. Gurevych. Sentence-bert: Sentence embeddings using siamese bert-networks. arXiv preprint arXiv:1908.10084, 2019.
- B. Riordan, A. Horbach, A. Cahill, T. Zesch, and C. Lee. Investigating neural architectures for short answer scoring. In Proceedings of the 12th workshop on innovative use of NLP for building educational applications, pages 159–168, 2017.
- R. Rivera-Bergollo, S. Baral, A. Botelho, and N. Heffernan. Leveraging auxiliary data from similar problems to improve automatic open response scoring. Proceedings of the 15th International Conference on Educational Data Mining, pages 679–683, 2022.
- E. Shaikh, I. Mohiuddin, A. Manzoor, G. Latif, and N. Mohammad. Automated grading for handwritten answer sheets using convolutional neural networks. In 2019 2nd International conference on new trends in computing sciences (ICTCS), pages 1–6. Ieee, 2019.
- J. T. Shen, M. Yamashita, E. Prihar, N. Heffernan, X. Wu, B. Graff, and D. Lee. Mathbert: A pre-trained language model for general nlp tasks in mathematics education. arXiv preprint arXiv:2106.07340, 2021.
- R. Smith. An overview of the tesseract ocr engine. In Ninth international conference on document analysis and recognition (ICDAR 2007), volume 2, pages 629–633. IEEE, 2007.
- S. Srihari, J. Collins, R. Srihari, P. Babu, and H. Srinivasan. Automated scoring of handwritten essays based on latent semantic analysis. In International Workshop on Document Analysis Systems, pages 71–83. Springer, 2006.
- J. B. Wiggins, K. E. Boyer, A. Baikadi, A. Ezen-Can, J. F. Grafsgaard, E. Y. Ha, J. C. Lester, C. M. Mitchell, and E. N. Wiebe. Javatutor: an intelligent tutoring system that adapts to cognitive and affective states during computer programming. In Proceedings of the 46th acm technical symposium on computer science education, pages 599–599, 2015.
- B. D. Wright. Solving measurement problems with the rasch model. Journal of educational measurement, pages 97–116, 1977.
- L. Zhang, Y. Huang, X. Yang, S. Yu, and F. Zhuang. An automatic short-answer grading model for semi-open-ended questions. Interactive learning environments, 30(1):177–190, 2022.
- M. Zhang, S. Baral, N. Heffernan, and A. Lan. Automatic short math answer grading via in-context meta-learning. arXiv preprint arXiv:2205.15219, 2022.
- S. Zhao, Y. Zhang, X. Xiong, A. Botelho, and N. Heffernan. A memory-augmented neural model for automated grading. In Proceedings of the fourth (2017) ACM conference on learning@ scale, pages 189–192, 2017.
1A detailed description on the use of the Rasch model can be found in our prior works relating to [13, 4]
© 2023 Copyright is held by the author(s). This work is distributed under the Creative Commons Attribution-NonCommercial-NoDerivatives 4.0 International (CC BY-NC-ND 4.0) license.