ABSTRACT
Massive Open Online Courses (MOOCs) make high-quality learning accessible to students from all over the world. On the other hand, they are known to exhibit low student performance and high dropout rates. Early prediction of student performance in MOOCs can help teachers intervene in time in order to improve learners’ future performance. This is particularly important in healthcare courses, given the acute shortages of healthcare staff and the urgent need to train data-literate experts in the healthcare field. In this paper, we analysed a health data science MOOC taken by over 3,000 students. We developed a novel three-step pipeline to predict student performance in the early stages of the course. In the first step, we inferred the transitions between students’ low-level actions from their clickstream interactions. In the second step, the transitions were fed into Artificial Neural Network (ANN) that predicted student performance. In the final step, we used two explanation methods to interpret the ANN result. Using this approach, we were able to predict learners’ final performance in the course with an AUC ranging from 83% to 91%. We found that students who interacted predominately with lab, project, and discussion materials outperformed students who interacted predominately with lectures and quizzes. We used the DiCE counterfactual method to automatically suggest simple changes to the learning behaviour of low- and moderate-performance students in the course that could potentially improve their performance. Our method can be used by instructors to help identify and support struggling students during the course.
Keywords
1. INTRODUCTION
Today, online learning has greatly changed how people learn. Especially after the Covid-19 pandemic, traditional classrooms are augmented with online activities. In addition, Massive Open Online Courses (MOOCs) have recently made learning more accessible globally to millions of people. Despite the great interest in MOOCs, there are many challenges to their adoption, such as high dropout rates and low learning performance. This is primarily because students need to plan and regulate their learning activities, which can be challenging [20, 24, 11, 23]. Therefore, predicting student performance as early as possible can help teachers provide timely feedback and support to students and inform them of strategies to improve their performance [2].
Although there are many studies on predicting student performance in MOOCs, several important limitations have not yet been addressed [2]. First, most of the previously proposed methods require learner-interaction data of an entire course (from the first to the last day) for prediction. These studies are useful for analysing student performance and behaviour after the course has ended [7, 2]. Conversely, a method with the ability of early prediction of student learning outcomes can help improve student performance [2]. Second, previous work focused only on whether students passed or failed the course [4, 10, 2, 26], while it is also important to identify students with moderate performance. Teachers can potentially help such learners perform better than simply passing the course. Third, most studies on predicting student performance with the use of black-box machine learning models, are difficult to interpret. Therefore, it is hard for teachers to make sense of the predictions and act upon them. As machine learning has been rapidly used in various applications, it has become increasingly important to explain the process that leads to a particular decision [9]. Explanation algorithms can make it easier for teachers to provide personalised feedback to learners. Finally, an important area of education that needs more attention is health data science. According to the National Academy of Medicine, training healthcare professionals who are knowledgeable in both health and data science is highly required, urgent, and challenging [18]. The complexity of teaching interdisciplinary topics to students from diverse backgrounds adds to this difficulty [17]. Therefore, the application of an early student performance predictor to health data science courses can facilitate the much-needed training from which data-literate healthcare experts can emerge.
To address these issues, we propose a three-step pipeline for early prediction of student performance. First, we calculated a transition matrix between different learning actions using a first-order Markov chain representing students’ learning processes. Then, the calculated transition matrix was used to classify learners into high- (HP), moderate- (MP), and low-performance (LP) groups using an ANN. Finally, two explanation methods were utilised so as to make the model output more actionable for teachers. The SHAP explanation approach was used to find out which features are important for prediction. Then, we also applied the DiCE method to calculate counterfactual values for LP and MP students, so as to find out how they can improve their learning outcomes.
The proposed pipeline was applied to the Data Science in Stratified Healthcare and Precision Medicine MOOC on Coursera, which includes more than 3000 enrolled students [6]. The results show that students who interacted more with the project, discussion, and lab materials achieved higher final grades. In addition, HP students actively interacted with the video lectures by pausing and replaying the videos. This may indicate that HP students not only watched videos until the end but they also paused, replayed, and sought the video lectures to contemplate the video materials, take notes, or re-watch certain parts of the videos.
The achieved AUC values ranging from 83% to 91% indicate that the method was successful in predicting the performance of health data science students after one week or more of interaction with the course. We also discussed changes suggested by the explanatory method for two students (one LP and one MP) with the help of the course instructor. According to the course instructor, some of the suggested changes are useful for providing personalised feedback to students. The contributions of this study are: i) developing a novel ANN approach for early (after seven calendar days) student performance prediction, ii) employing explanation methods, which may help teachers to provide students with personalised feedback, and iii) applying our approach to an interdisciplinary MOOC in the field of health data science with a high number of enrolled students.
2. RELATED WORK
Prior work for predicting student performance in MOOCs used a variety of different methods. These methods can be classified into tree-based models, linear models, probabilistic models, and Neural Network (NN) approaches. Notable examples include Mbouzao et al. [19] who used a tree-based method to predict student success in a MOOC using video interaction data. They analysed data from a McGill University online course on edX over a period of 13 weeks. They defined three metrics based on video interaction data and predicted whether students would pass or fail. The method uses the students’ video interaction data after the first and sixth weeks as input. The accuracy of the early prediction was rather low (\(\approx \) 60%), while the prediction after the sixth week was more accurate. This result echoes the need to improve the early student performance prediction on MOOCs.
Another example of the application of tree-based methods is the work of Al-Shabandar et al. [1]. They analysed behavioural and demographic features of more than 590,000 students from 15 MOOCs in Harvard University’s HMedx dataset to predict pass/fail status. They applied several traditional machine learning methods, such as Random Forest (RF), Support Vector Machine (SVM), Naive Bayes (NB), Decision Tree (DT), Logistic Regression (LR), and NN, and showed that RF produces the best performance.
Some papers used linear models to predict student performance. For example, Liang et al. [14] applied three linear methods: linear discriminant analysis, LR and Lagrangian SVM (LSVM) to the behavioural data of students in a Data Structures and Algorithms MOOC to predict pass/fail status. They showed LSVM achieved the highest accuracy.
Another group of papers has used probabilistic methods such as NB, Bayes network and Bayesian generalised linear (BGL) models for performance prediction. For example, Cobos et al. [5] developed an online tool using various machine learning algorithms such as Boosted LR, RF, NB, NN, SVM and BGL to predict pass/fail status. The tool works based on analysing behavioural and video interaction data of students collected from 15 different MOOCs in social science and science fields. It was found that BGL is the best model as it can be trained quickly and gives stable results (AUC between 60% and 80%).
Numerous works have used NN such as MultiLayer Perceptron (MLP) or ANN, Recurrent Neural Networks (RNN) and Long Short-Term Memory (LSTM) to predict student performance. For example, Kőroesi and Farkas [13] developed an RNN model based on raw clickstream data that is suitable for both regression and multiclass classification of weekly student performance. They used the Stanford Lagunita dataset, which consists of log data from 130,000 students, and took the final quiz score as the output for the regression problem, while the students were divided into 10 levels based on their final scores for the classification problem. Although their model does not require a feature engineering step, the classification accuracy of the best model (using features of all weeks) is low (around 55%).
Qu et al [22] analysed a C programming MOOC with 1525 learners. They focused only on the log data of the programming tasks. Features such as submission times and order of submissions were used to predict student performance using an MLP. The results show that failing students have an obvious sequence pattern when trying to solve programming tasks, while the behaviour of passing students is less straightforward. The authors also developed an MLP with LSTM and discriminative sequential pattern mining to capture learners’ behavioural patterns and predict their performance. These NN-based models are black-box and would require an additional explanatory step to help teachers understand the results of these models [25].
The current approaches do not provide satisfactory performance in early student performance prediction [2]. Also, teachers need to identify LP students as soon as possible to help them adopt effective learning strategies. Moreover, none of the previous NN-based studies used explanatory methods to make the result more actionable and interpretable for teachers. The interpretation of the prediction is key for teachers since they need to understand the learning behaviour of students to write personalised feedback.
3. METHODOLOGY
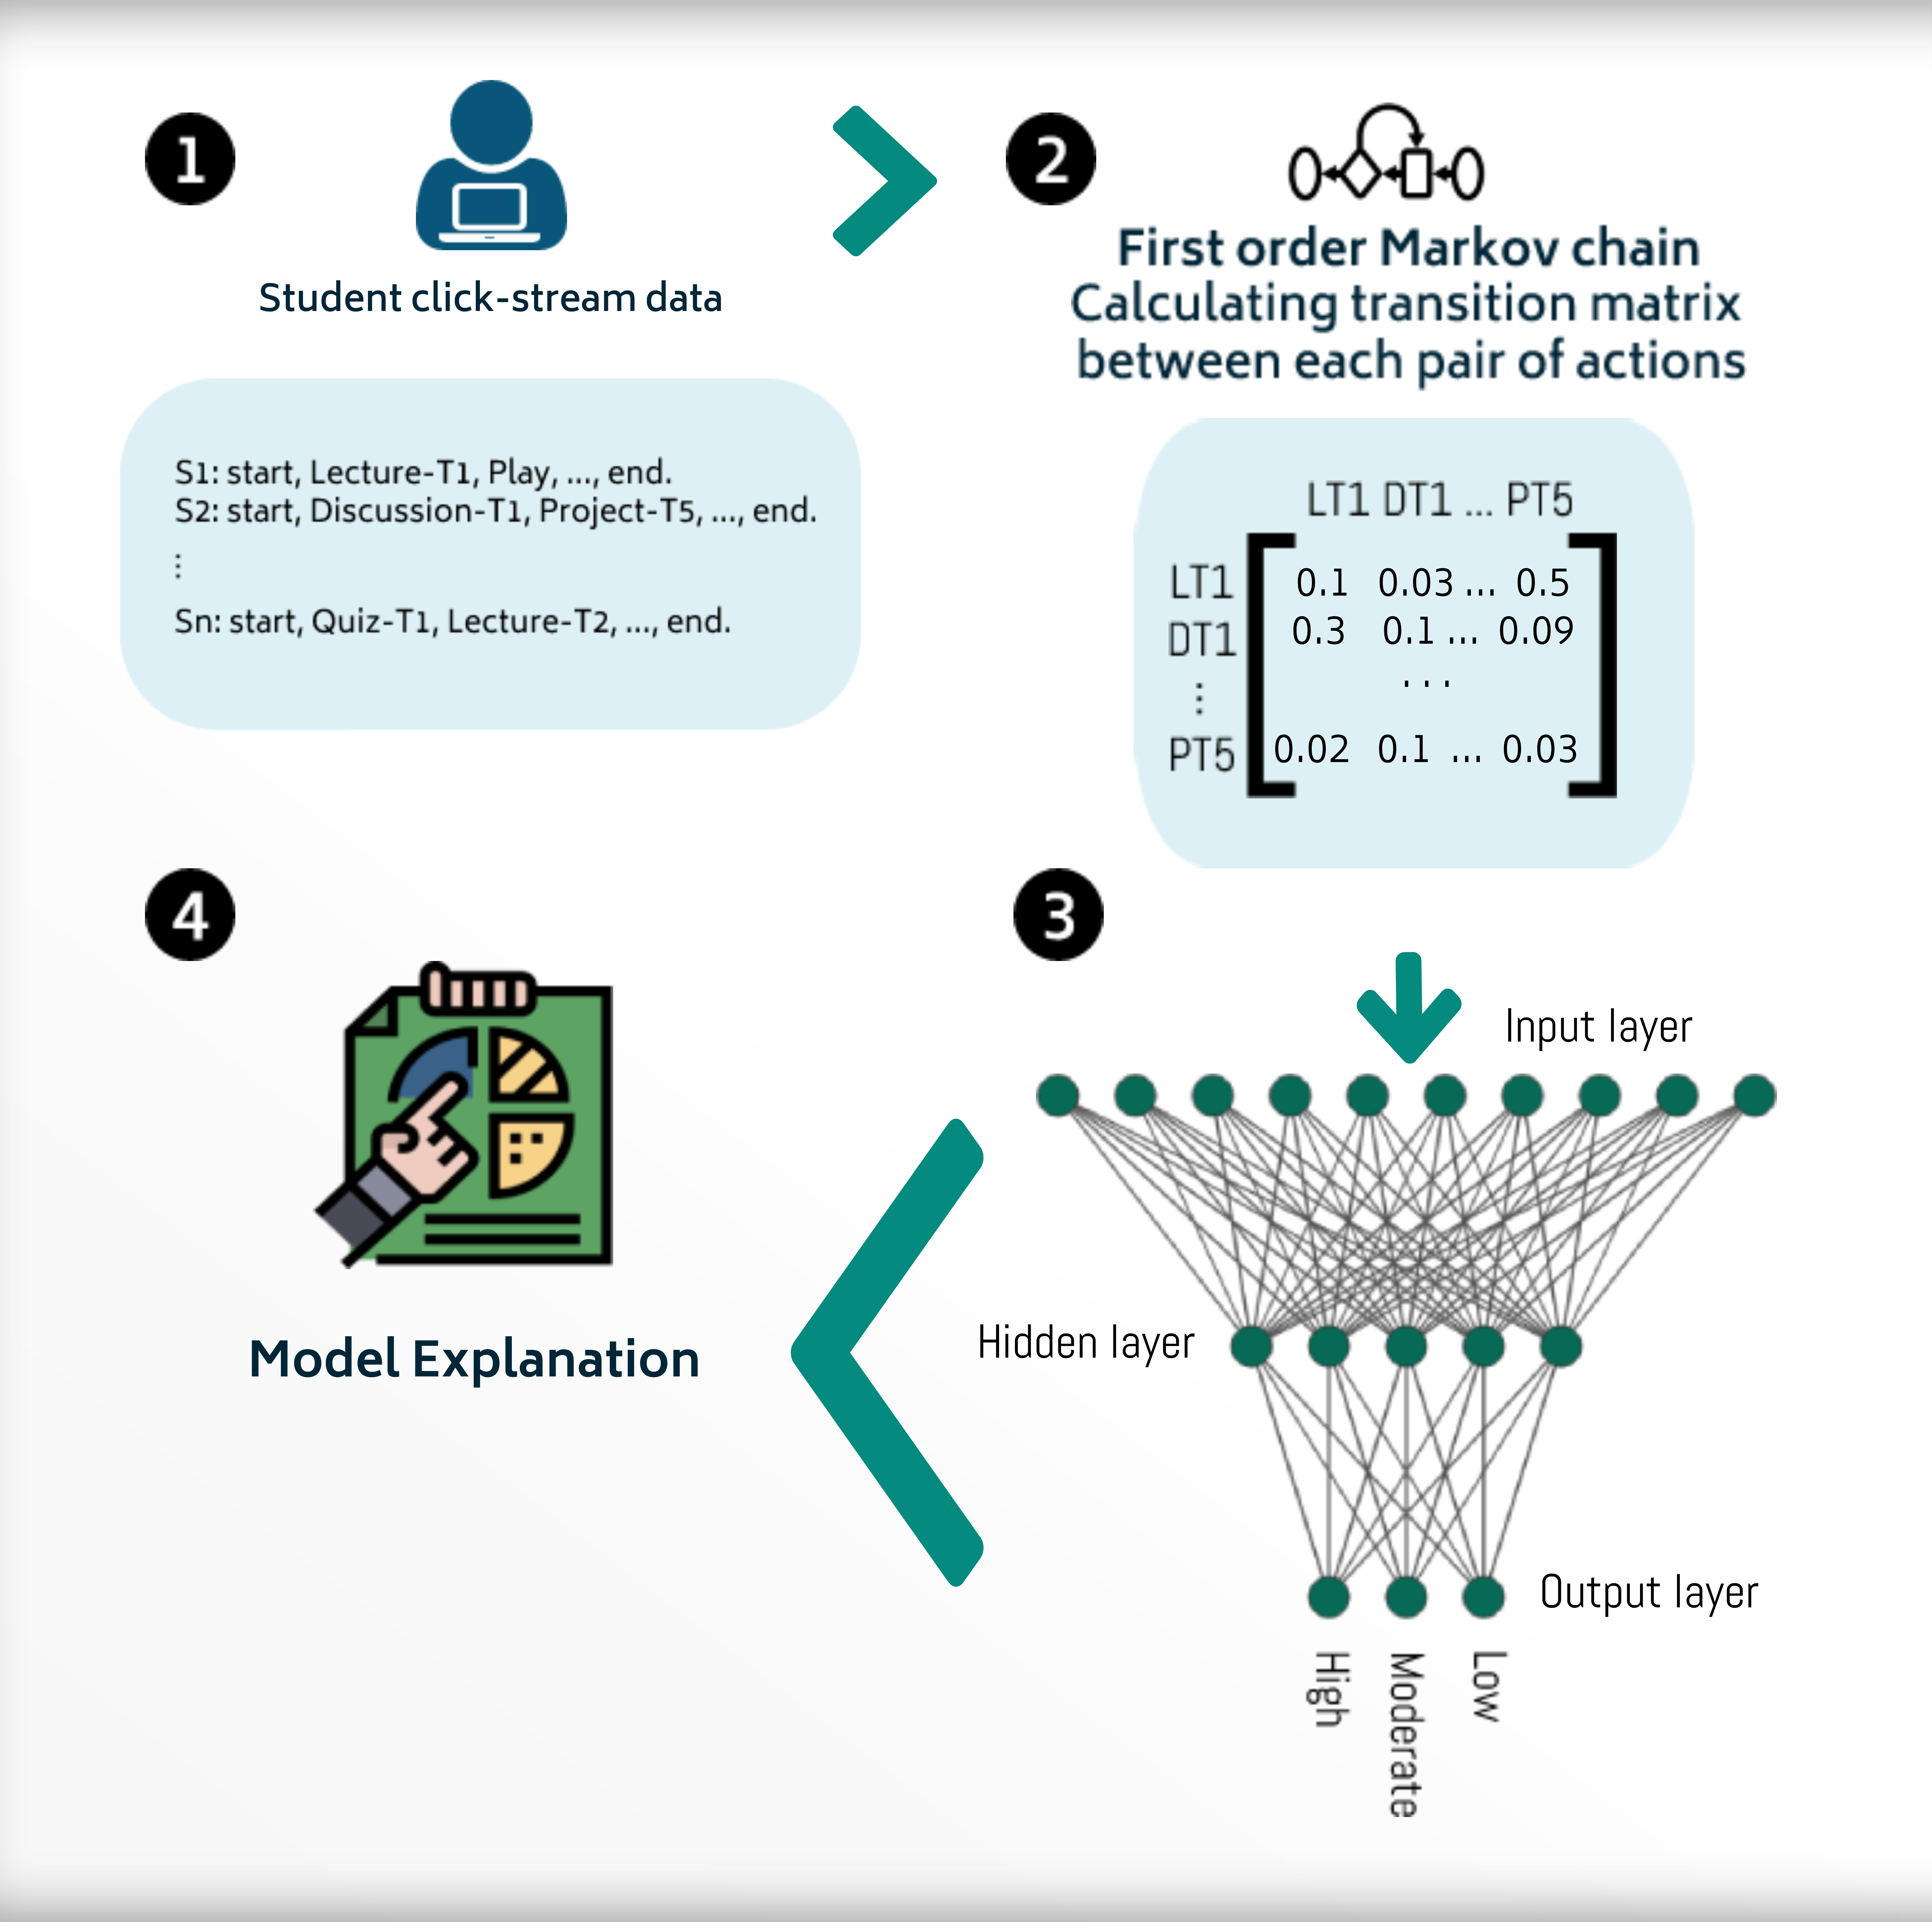
Figure 1 shows the schema of our approach for early student performance prediction. First, for each learner, a sequence of learning actions during a set time window (e.g. one calendar week) was extracted. These represent the lowest level actions carried out by the student (e.g., playing a video lecture, submitting an assignment, and so on). The set of possible learning actions can be defined based on clickstream data and the course design (See Section 4). Second, the transition probability between each pair of actions was computed using a first-order Markov chain. Third, an ANN was trained to predict students’ performance levels (LP, MP, and HP) given a student’s transition matrix. Finally, the DiCE and SHAP methods were employed to explain the model decision in order to help teachers write personalised feedback.
Let \(A= \{a_0,\ a_1,\ a_2, \, ..., \ a_N, a_{N+1}\}\) denote Markov states, where \(a_0 = start\), \(a_{N+1} = end\), each \(a_i\) is a learning action, and \(N\) is the number of all learning actions. Assume \(S_k = (s_k^{(0)}, \ s_k^{(1)}, ...,\ s_k^{(n)})\) be the sequence of actions for \(k\)th student in a time frame, in which \(s_k^{(0)} = start,\ s_k^{(n)} = end\) and \( s_k^{(t)} \in A\) be the action that the \(k\)th student has done in the \(t\)th time of the sequence of actions. The sequence of actions can be seen as a trajectory between states in the Markov chain and is used to estimate the transition probability between Markov states. Based on the Markov chain, the transition probability matrix for the learning process for \(k\)th student is \(P_k = [p_{k}(i,\ j)]_{i,j \in \{0,..., N+1\}}\) calculated by Formula \eqref{eq0}. \begin {equation} \label {eq0} p_{k}(i,\ j) = \frac {|s_k^{(t)} = a_i\ and \ s_k^{(t+1)} = a_j| }{\sum _{l \neq i}|s_k^{(t)} = a_i \ and \ s_k^{(t+1)} = a_l|}, \end {equation} where \(|.|\) is the count function. In Formula \eqref{eq0}, the number of transitions from \(a_i \) to \(a_j\) is divided by the number of all transitions emanating from \(a_i\). The transition probability matrix is calculated for each student separately. Although the action sequences for each student can change, the transition probability matrix for all students has the same dimension of \((N+2) \times (N +2)\). Note that if \(k\)th student never commits the transition from action \(a_i\) to action \(a_j\), \(p_k(i,j) = 0\).
For each student, the transition probability matrix of all actions in the time frame served as input to the ANN. We employed ANN as the state of the art in predicting student performance; they have been shown to outperform traditional methods [3]. The ANN model includes input, hidden, and output layers. The hidden layer computes the latent features extracted from the input layer using \(ReLU(x)\) as the activation function. The output layer has three neurons to compute the probability of the input belonging to each of the three classes (LP, MP, and HP) using \(Sigmoid(x)\) as the activation function. The final grade can be mapped to LP, MP, or HP categories, or more finer-grained categories, based on instructors’ preferences. A set of hyperparameters were used for finding the best ANN architecture. The values tested for the number of hidden neurons were 5, 10, 15, 20, 50, 100, and 200. The batch size values tested were 4, 8, 16, 32, 64, and 128. The number of epochs tested was 5, 10, 15, and 20. To train the model, the categorical cross-entropy loss (CCE) was computed on each batch of data and the weight values were updated based on ADAM optimizer [12] after feeding each batch. The model performance was evaluated on the test data using the Area Under ROC Curve (AUC). To evaluate the performance of the predictive model objectively, we used 5-fold stratified Cross-Validation (CV) and 20% of the training data were considered as validation data (changed in each fold) for tuning the hyperparameters.
3.1 Interpretability
We used the SHAP (SHapley Additive exPlanations) method [16] to select the most important features in predicting student performance. In the SHAP method, Shapley values are calculated for each transition probability (features) and the transitions with the highest Shapley values were considered the most important features that contribute the most to the model prediction. The Shapley value for a transition from action \(a_i\) to action \(a_j\) is \(\phi _{a_i \rightarrow a_j}\) and is defined in Formula \eqref{eq5}. Based on formula \eqref{eq5}, \(\phi _{a_i \rightarrow a_j}\) is the average improvement of the model by adding this feature (transition from action \(a_i\) to \(a_j\)) to all models considering different possible features. Herein, a feature is a transition from one action to another. \begin {equation} \label {eq5} \phi _{a_i \rightarrow a_j} = \sum _{S\subset M - \{i\}} \frac {|S|!(|M|-|S|-1)!}{M!}(f(S\cup i) - f(S)), \end {equation} where \(M\) is the set of all features and \(f(S)\) is the performance of model based on subset \(S\) of features. Since the features are the set of all possible transitions between Markov states, \(|M| = (N+2) \times (N+2)\). After calculating \(\phi _{a_i \rightarrow a_j}\) for all \(a_i, \ a_j \in A\), we ranked them based on their importance and selected the most important features.
In order to make the model more actionable for teachers, we used the DiCE [21] method for calculating counterfactual examples (CFs) to explain the conditions that can potentially change the students’ performance. Each CF is a set of changes (increase or decrease) in some transitions between learning actions. An example of a set of CFs is increasing the transition from Lecture A to Quiz B and decreasing the transition from Video pause to Video end. A good set of CFs should be efficient, proximal, and diverse. The efficiency of CF means that applying those changes in the students’ learning process may lead to higher performance. Proximity means that the suggested changes should be close to the current learning process of the student; i.e. the CFs suggesting huge changes in students’ current learning process are not practical. Finally, the diversity of the CFs denotes that the set of proposed changes in CFs should have the highest variety, so that the student can have different options.
Consider an LP student with a transition matrix of \(P\). A reasonable CF can be the transition matrix \(P'\) that has the same dimension and values as \(P\), but with subtle changes in some of the elements. Assume this student has a high transition probability from Video end to Quiz A, but a lower transition from Video end to Quiz B. Suppose that HP students proceed to Quiz B after the VideoEnd action with a high probability. In this case, recommending this student visit Quiz B after the VideoEnd action may increase the performance of the student. To this aim, for each LP or MP student with a transition matrix of \(P\), the set of \(P'_1, P'_2, ..., P'_m\) counterfactual transition matrices are selected such that the following loss function is minimised. \begin {align} \label {eq6} CF(P&) = argmin_{P'_1, P'_2, ..., P'_m} \sum _{i=1}^{m}L(f(P'_i), y^*) \\ &+ \frac {\lambda _1}{m}\sum _{i=1}^{m}dist(P'_i, P) - \lambda _2 dppDiversity(P'_1, P'_2, ..., P'_m) \nonumber \end {align}
In Formula \eqref{eq6}, \(f(P'_i)\) is the predicted performance of the student considering \(P'_i\) as his/her transition matrix, \(y^*\) is the ideal performance, \(L\) is the distance between prediction for \(P'_i\) and the ideal performance. \(dist\) is the Manhattan distance of two transition matrices, \(dppDiversity\) is the diversity of counterfactual transition matrices which is defined based on Formula \eqref{eq7}, and \(\lambda _1, \lambda _2\) are the regularization terms to balance three terms of loss functions. \begin {align} \label {eq7} dppDiversity(P'_1, P'_2, ..., P'_m) &= det(K)\\ k(i,j) = \frac {1}{dist(P'_i, P'_j)} \label {eq8} \end {align}
where \(i\), \(j\) is any two CFs, and \(det(K)\) is the determinant of the matrix \(K\) which its elements are defined based on Formula \eqref{eq8}. Consequently, three terms in calculating \(CF(P)\) represent the constraints for selecting good CFs. To be specific, minimising \(\sum _{i=1}^{m}L(f(P'_i), y^*)\) guarantees the efficiency of CF to be chosen in a way that may lead to high performance. Also, minimising \(\frac {\lambda _1}{m}\sum _{i=1}^{m}dist(P'_i, P)\) narrows down the CFs to the set of transition probabilities that are close to the current learning process. Finally, \(dppDiversity(P'_1, P'_2, ..., P'_m)\) ensures the diversity of CFs. For example, for each LP or MP student with a transition matrix of \(P\), various random proximal transition matrices \(P'\) with some changes in some of the elements are considered. Among different possible CFs, the set of \(m\) transition matrices which is highly probable in high-performance students and leads to the minimum \(CF(P)\) are selected. The selected CFs such as an increase or decrease in some transition values, can potentially be used to guide students towards improving their performance.
4. APPLICATION TO HEALTH DATA SCIENCE MOOC
We applied our approach to data from the Data Science in Stratified Healthcare and Precision Medicine (DSM) MOOC on Coursera, for the period between April 2018 and April 2022 [6]. Over this period, 3,527 learners were enrolled (38% male, 28% female, and 34% unknown) with at least one learning action. The course completion rate for these students is 38%. DSM is a self-paced 5-topic MOOC with a total of 43 videos, 13 reading materials, five quizzes, one programming assignment and one peer-review/project assignment. The course assessment includes a quiz for each topic, as well as a programming assignment for the third topic and a peer-reviewed assignment for the last topic. The final grades were calculated (out of 100) by the weighted average of all quiz and assignment scores (each quiz weight = 10%, programming assignment weight = 20%, and peer-reviewed assignment weight = 30%). Upon the course instructor’s request, we grouped students into three performance groups. An LP group (final grade < 50; i.e. student failed the course), which included 62% of students; an MP group (50 \(\leq \) final grade < 80), which included 21% of students; and an HP group (final grade \(\geq \) 80), which included 16% of students.
We used anonymised data and have received institutional ethics
approval for this research. All 3,527 enrolled learners with at
least one action were used for the analysis. The considered
actions include starting to watch a video lecture (Video-Start),
playing a video lecture (Play), watching a video lecture until
the end (Video-End), skipping forward or backwards throughout
a video lecture (Seek), pausing a video lecture (Pause),
changing the volume of a video lecture (Volume-Change),
changing the subtitle of a video lecture (Subtitle-Change),
downloading a video lecture (Download-Video), downloading
video lecture subtitle (Download-Subtitle), changing the play
rate of a video lecture (Playback-Rate-Change), visiting the
main page of the video lecture \(i\) (Lecture-Topic\(_i\)), engaging
with discussion forum \(i\) or posting a question on the forum (Discussion-Topic\(_i\)), engaging with general discussion forums
(Discussion-General), engaging with reading material \(i\)
(Reading-Topic\(_i\)), engaging with quiz \(i\) such as visiting the quiz
page or submitting the quiz (Quiz-Topic\(_i\)), engaging with lab
materials of topic \(i\) (Lab-Topic\(_i\)), and engaging with the
peer-reviewed assignment such as visiting the project or project
submission (Project-Topic\(_i\)). The \(i\) is a topic number ranging
from 1 to 5.
For all performance groups, we computed the percentage of students in each group that carried out each learning action, denoted RAP (Relative Action Presence). Interestingly, more than 80% of the LP students interacted with the first topics more than the topics towards the end of the course. The RAP score for LP students’ learning actions decreases as the course advances. On the other hand, almost all HP students were involved in assessment-related actions, such as projects, lab work and quizzes. MP students have similar RAP scores to HP students, although the order of frequent actions is slightly changed.
For example, the project topic5, which accounts for 30% of the total score, has the highest RAP (almost 100%) for the HP students, a low RAP (about 10%) for LP and a relatively high RAP (about 80%) in the MP students. Also, RAP for Discussion-General is relatively high (about 75%) in the HP, medium (about 55%) in the MP and low (0.25%) in the LP group. In general, the majority (about 80%) of HP students were involved in two-thirds of the activities, while the majority (about 80%) of the LP students were involved in one-third of the actions, highlighting the fact that the HP students were involved in more actions than the LP. Furthermore, since the RAP of lab work, projects, and quizzes are much larger among HP students compared to the LP group, it can be concluded that HP students focused on assessment-related actions. It should be noted that the low RAP of action in a group could be caused by a high dropout of students (fewer students continued the course) or low engagement of students that continued the course.
Even for the actions of the first topic, the RAP of HP is greater than MP students, and the RAP of the MP is greater than the LP group. These differences show that students’ performance can be predicted based on their level of interaction with the first topic. As the course progresses, the difference in RAP increases between the HP and the MP, and between the MP and the LP; i.e. the differences between the groups become more pronounced as the course progresses.
4.1 Learning Processes
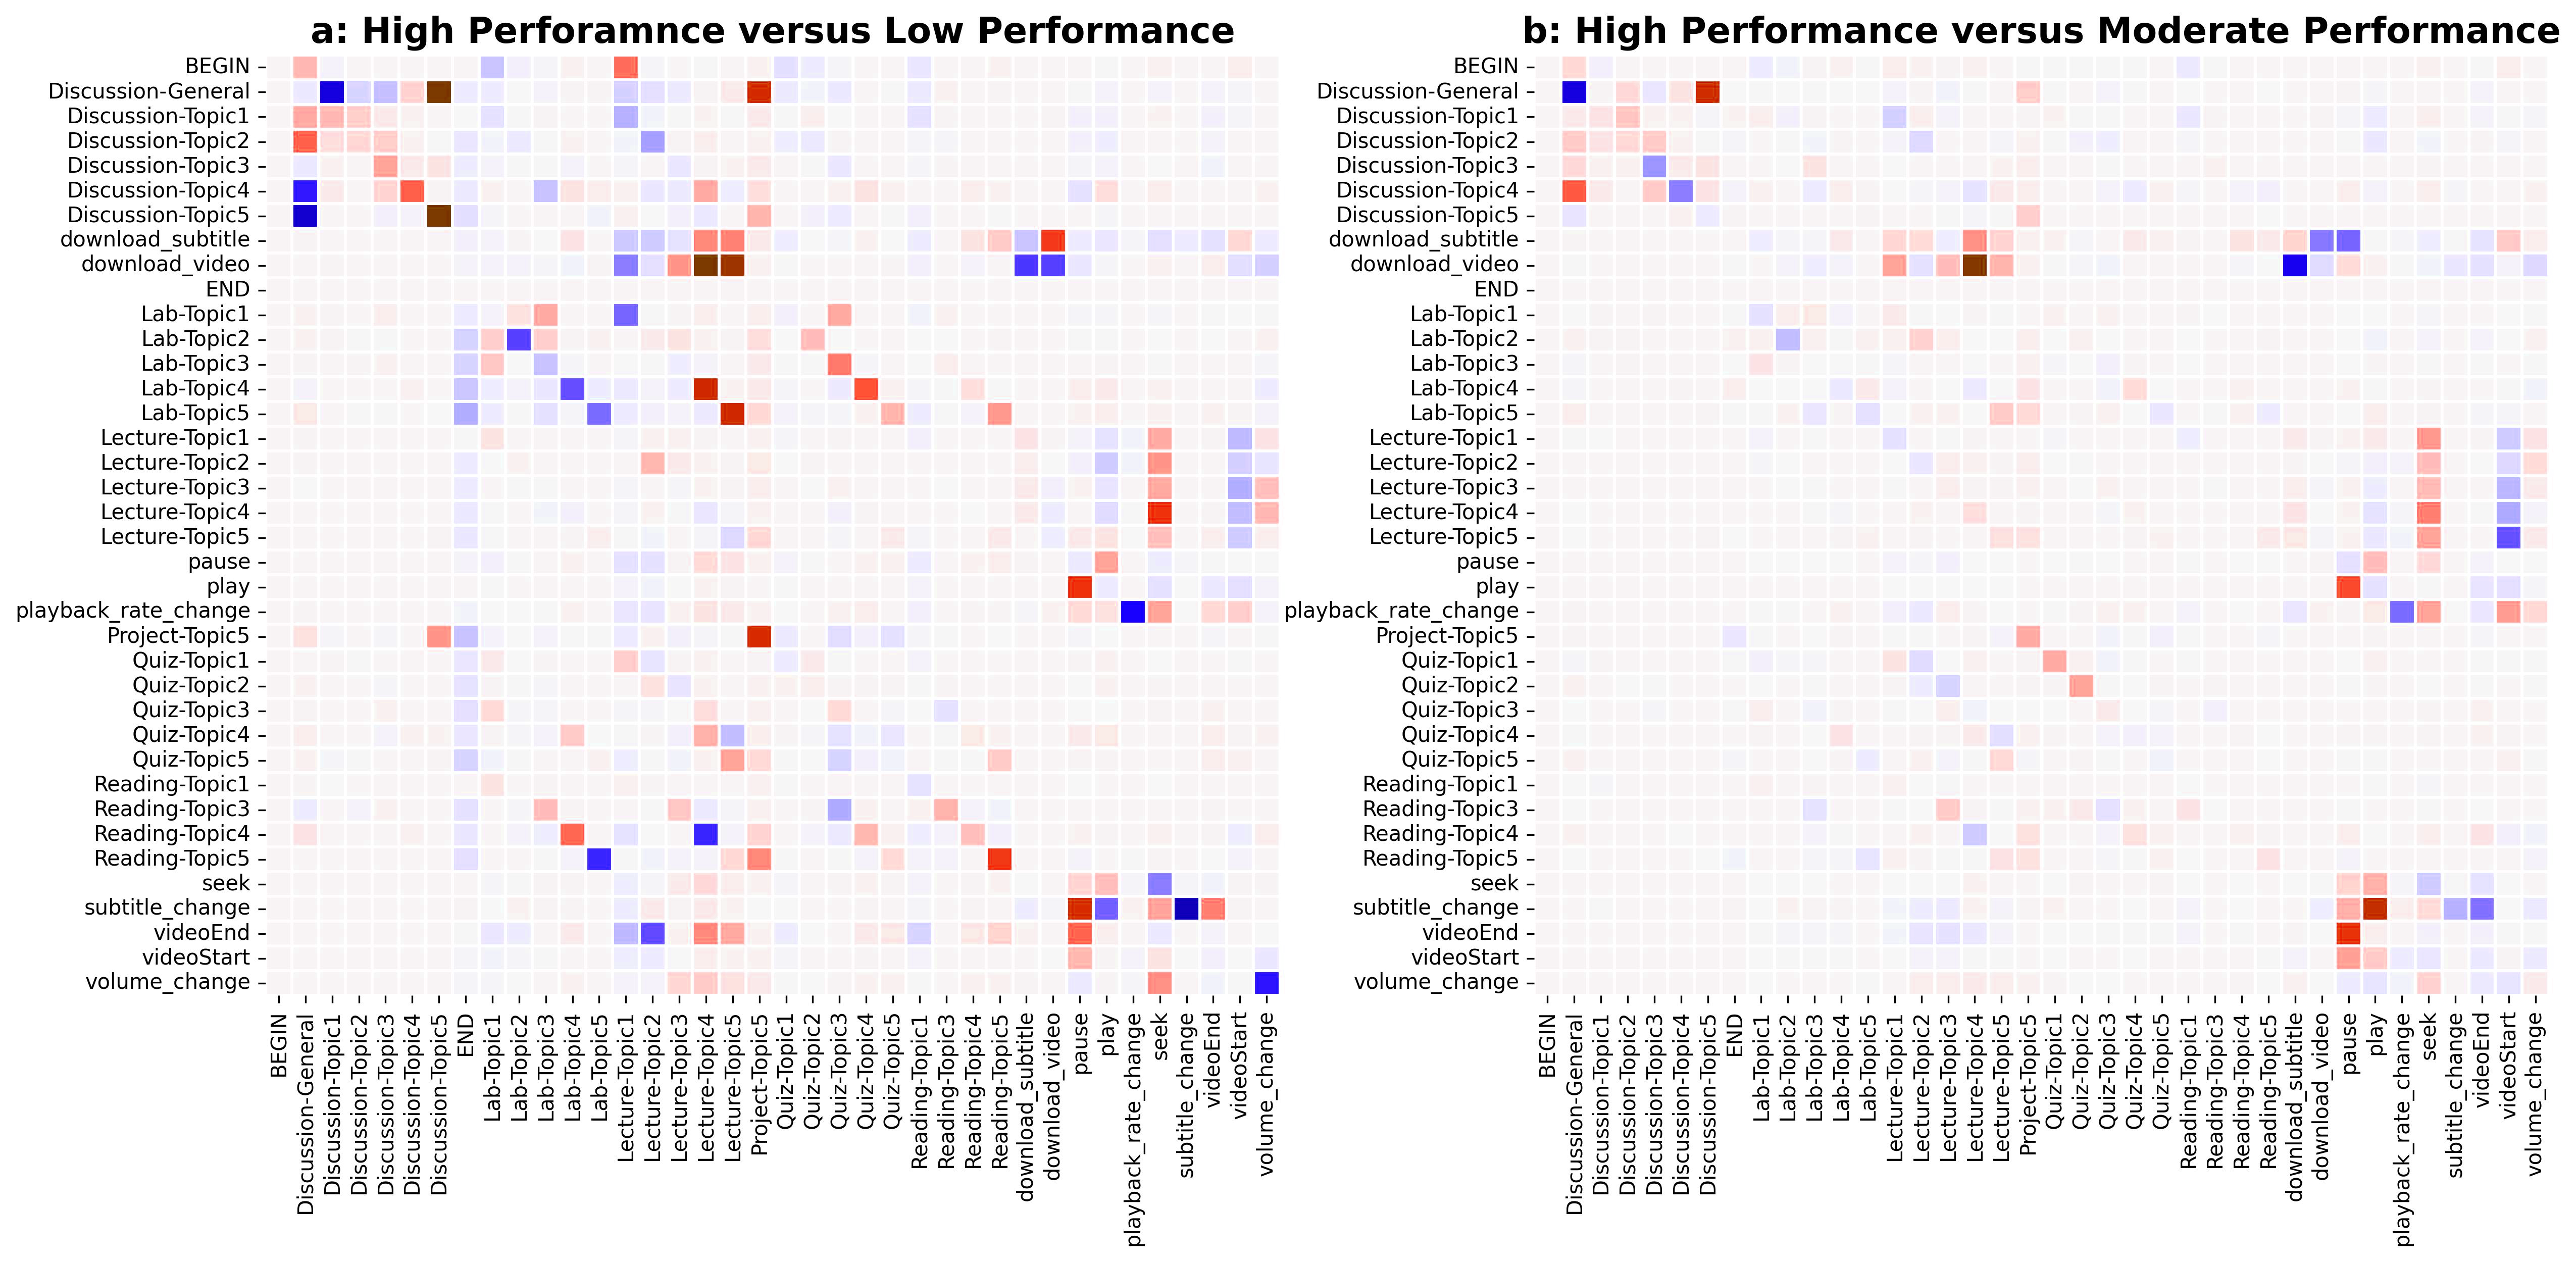
To shed more light on the differences in the learning process between the HP, MP, and LP groups, the transition probability matrices for each of the groups of students were calculated using First-order Markov models [8]. The difference between the transition probability matrices of each pair of groups is shown in Figure 2.
One difference between the students of the HP and LP groups is how students interacted with videos. The red colours in the pause and seek columns show that the HP students are more inclined to use the pause and seek actions than the LP ones (Figure 2 a). Consequently, seeking and pausing videos, which may involve contemplating the video material, making notes, or re-watching certain parts of the lecture, is a helpful action that may lead to better performance. Conversely, it can be concluded that finishing a video on its own is not an indicator of a good comprehension of the concepts presented in the video.
Another difference between the HP and LP groups is how students transitioned from the video-download action. After doing this action, students in the HP group proceeded mainly to the main page of lecture topics 5 and 4, while students in the LP group proceeded to the main page of lecture topics 1 and 2 (Figure 2 a). A similar trend appears when comparing the matrices of the MP and LP groups (Figure 2 b). The transitions from VideoEnd to lecture topics show that HP students are more likely to go to lecture topics 5 and 4, while LP ones prefer to move to lecture topic 1 (Figure 2 a). LP students engage more with actions in the first topics, while HP and MP students focus more on the last topics, which contribute more to the overall score.
Interestingly, after visiting the general discussion forum, HP students mostly move to discussion topic 5, while the LP students mainly moved to discussion topic 1 (Figure 2 a). Also, the high probability of transition from discussion topic 5 to itself, and project topic 5 to itself, for the HP and MP students when compared to the LP students, support that the HP and MP were engaged with and discussed project topic 5 more than the LP students.
There are a few differences between the HP and MP groups. The most obvious difference is the higher likelihood of using seek and pause actions among the HP compared to the MP students (Figure 2 b), which supports the hypothesis that seek and pause can lead not only to an acceptable but also to a high final grade. Another difference is that the HP students are more likely to select discussion topic 5 after going to the discussion area, while students from the MP group are more likely to stay in the general discussion forum, which includes discussion related to the course but not strictly related to a particular weekly topic (Figure 2 b).
4.2 Early Prediction of Student Performance
In this study, we set week as the time window; therefore, the model is able to predict students’ final performance after seven calendar days or more. Five prediction models were built and trained using clickstream data available up to each calendar week.
| AUC
| |||||
|---|---|---|---|---|---|
| Time window | LP | MP | HP | Micro | Macro |
| First week | 0.78 | 0.65 | 0.74 | 0.83 | 0.72 |
| First two weeks | 0.89 | 0.76 | 0.84 | 0.89 | 0.83 |
| First three weeks | 0.91 | 0.70 | 0.83 | 0.87 | 0.81 |
| First four weeks | 0.93 | 0.74 | 0.87 | 0.90 | 0.85 |
| First five weeks | 0.94 | 0.80 | 0.88 | 0.91 | 0.87 |
The best values of the hyperparameters were determined based on the performance of the models on the validation data. Accordingly, the number of hidden neurons, epoch size, and batch size were set to 200, 10, and 128, respectively. Mean AUC values were averaged over 10 replications of the 5-fold CV.
Table 1 shows the AUC of each model for predicting students performance. It is obvious that the AUC increases over time for the prediction of the LP and HP students. Based on Table 1, the AUC for the prediction of the MP students decreases slightly in the first three weeks’ analysis in comparison with the first two weeks’ analysis. This could be due to the different behaviour of MP students in the third week compared to their behaviour in the other weeks. A possible explanation for this difference may be the programming assignment as an assessment for the third week, which might have an impact on the MP students’ behaviour. This decrease in the AUC of the prediction of MP based on the first three weeks affects the overall AUC value.
Although the model based on the first five weeks achieved excellent AUC value (91%), indicating its great potential in stratifying students, the model based on the first calendar week also succeeded to classify students with a good AUC (83%), showing that students’ performance can be predicted with good accuracy from their actions in the first seven days (See Table 1). Moreover, the performance of each model in predicting the LP students is better than that of the MP or HP students. This could be due to the larger group size, and thus more training data from the LP students, or the better discrimination of the definition of the LP students (score from 0 to 50) compared to the two other groups. We used the zeroR model as a baseline similar to the related work [27, 15]. The proposed method significantly outperforms the zeroR model baseline (AUC = 0.5, accuracy = 0.62).
4.3 Explanation and Important Features
The SHAP method was applied to estimate the importance of features based on their influence on the predictive model of the first week. The most important feature is the transition from video pause to play, which has a large, medium and small impact on the prediction of the HP, MP, and LP students, respectively. The top 10 important features include transitions between play, pause, seek, videoStart, and videoEnd, indicating the high impact that interaction with videos has on their performance. Both transitions from pause to play and from play to pause are highly important, with a relatively even impact of \(play\rightarrow pause\) in the prediction of each group and a greater impact of \(pause\rightarrow play\) in predicting the HP students, highlighting that even if all students paused videos at the same rate, HP students resumed videos much more frequently than others. The same is true for the transitions \(seek\rightarrow pause\) and \(pause\rightarrow seek\); thus, resuming videos after a pause or seek is a better indicator of the HP students than pausing or seeking itself.
| Student | Suggested changes
| |
|---|---|---|
| Student1 (Current group: LP) | Increase \(Lab-Topic1\rightarrow Quiz-Topic5\) | \(Lecture-Topic1\rightarrow Video seek\) |
| \(videoStart\rightarrow Discussion-Topic5\) | \(Video pause\rightarrow Discussion-Topic3\) | |
| \(Lab-Topic3\rightarrow Project-Topic5\) | \(Lecture-Topic4\rightarrow Lecture-Topic1\) | |
| \(Lecture-Topic5\rightarrow Lab-Topic5\) | \(Quiz-Topic5\rightarrow Video play\) | |
| \(Quiz-Topic5\rightarrow Lecture-Topic3\) | ||
| Student2 (Current group: MP) | Increase \(Lecture-T3\rightarrow Lab-Topic5\) | \(Discussion-Topic3\rightarrow Discussion-Topic5\) |
To assess the values of the most important features in each group, their relative occurrence was calculated for each group of students. All the top features have high, medium and low relative occurrence among HP, MP, and LP students, respectively. Although there are many more students in the LP group and only a few students in the HP group, the relative frequency of the HP students is much higher for the top features, which shows that the total number of actions (transitions) for this small number of HP students was greater than the total number of actions for the large population of LP students. Consequently, this can be considered as an indicator of the diligence of the HP students, the mediocre effort of the MP students, and the minimum number of actions of the LP students.
We also tried to select the top 300 important features using the SHAP method to train the models. This resulted in micro-average AUC values of 84%, 88%, 88%, 91%, and 91% for the predictive models in weeks 1 to 5. However, the improvement in model performance was insignificant, which suggests that our method was able to extract important information from the sparse input features.
In the final analysis, we employed the DiCE method to suggest potential changes for LP and MP students that could improve their performance. Table 2 shows example results of the method for two students, one in the LP group and one in the MP group. Below are some interpretations based on the suggested changes in addition to the course instructor’s discussion around the suggested changes.
Student 1 (an LP student): It seems that this student had more trouble with the theoretical questions than with the programming questions in the quizzes. Therefore, they should watch video lectures and take notes before taking the quizzes. Also, this student is advised to focus more on the programming lab in Topic 1, before taking Quiz 5. According to the course instructor, this is a meaningful recommendation, as this lab can support refreshing fundamental programming knowledge, which aids in answering programming questions. Another recommendation that is meaningful according to the course instructor is around using discussion forums more. In particular, the algorithm highlights engaging with the discussion forums for Topics 3 and 5 upon watching lecture videos. In online education, posting questions in the forums and reading existing discussions is a good strategy for clarifying questions that may arise when watching videos. Some suggestions, however, are harder to decipher, according to the course instructor. In particular, it is unclear why it is recommended to engage with the programming lab in Topic 3 before attempting the peer-reviewed assessment, given that they cover very different concepts.
Student 2 (an MP student): By increasing only two transitions, he/she can become an HP student. It can be deduced that the student needs to work more on the topic of lecture 3 and then on topic 5. This student can improve his/her performance if he/she spends more time on lab material and discussions 3 and 5. According to the course instructor, it is not a surprise that topics 3 and 5 are highlighted here, as these two topics are strongly related to the programming and the peer-reviewed assignment. The recommendation, however, to increase the transition from the lecture in topic 3 to the programming lab in topic 5 is somewhat unexpected, as the two topics cover rather different content. The instructor has speculated that students might benefit from refreshing knowledge related to network analysis in topic 3 when learning new concepts around graph data in topic 5, even though this link is not made evident in the course design. This is an interesting hypothesis to investigate in the future.
5. DISCUSSION
We proposed a novel approach for early predicting student performance based on their learning process. Our method, a combination of ANN and Markov chain, classified learners into three performance groups with AUC ranging from 83-91%. The results showed that even after only one week of interaction with the course, our method can predict final performance with reasonable accuracy. We also used SHAP and DiCE explanation methods to identify important features and suggest changes for LP and MP students to potentially improve their performance. The proposed pipeline can be used for different courses towards providing early and personalised interventions to students. Since artificial intelligence methods are not error-free, they are only an assistant for teachers to provide them with processed information. Ultimately, it is teachers who write personalised feedback for students by analysing the method results.
Learner behaviour in the health data science MOOC shows that interacting with video lectures, such as pausing or replaying a video, which may be related to contemplating on the material, taking notes, or re-watching certain parts result in a higher final grade. Investing more time in learning materials related to key assessments (i.e. lab materials and content from topics 3 and 5) also leads to higher grades. Our analysis indicates that LP students lose motivation after attending Topic 3, while their engagement with Topic 1 materials is high. Our recommendation is to divide large assessments into small tasks that a student can work on each week, so as to motivate them and improve their performance.
A limitation of this work is that enrolled learners in MOOCs have different motivations; therefore, the definition of performance criteria is conceptually controversial. We focused on the final grade as an indicator of learning performance. Further research is needed to define a new performance criterion that considers learner motivation as well as the final grade. Since the method does not depend on course design and can be used for MOOCs with a different number of topics and learning materials, it needs to be applied to multiple courses with different designs, contexts, and sample sizes to assess its generalisability. The explanation step of the pipeline can be improved with textual and visual explanations based on educational learning theories. We have shown that some of the suggestions by explanation methods make sense for instructors but there are several recommendations which are not clear enough. Further studies are needed to process the output of the explanation step for making them more consistent with learning theories and teachers’ prior knowledge about the course.
6. ACKNOWLEDGMENTS
This work was supported by the Medical Research Council [grant number MR/N013166/1].
7. REFERENCES
- R. Al-Shabandar, A. Hussain, A. Laws, R. Keight, J. Lunn, and N. Radi. Machine learning approaches to predict learning outcomes in massive open online courses. In 2017 International joint conference on neural networks (IJCNN), pages 713–720. IEEE, 2017.
- A. Alhothali, M. Albsisi, H. Assalahi, and T. Aldosemani. Predicting student outcomes in online courses using machine learning techniques: A review. Sustainability, 14(10), 2022.
- Y. Baashar, G. Alkawsi, A. Mustafa, A. A. Alkahtani, Y. A. Alsariera, A. Q. Ali, W. Hashim, and S. K. Tiong. Toward predicting student’s academic performance using artificial neural networks (anns). Applied Sciences, 12(3):1289, 2022.
- Y.-C. Chiu, H.-J. Hsu, J. Wu, and D.-L. Yang. Predicting student performance in moocs using learning activity data. J. Inf. Sci. Eng., 34(5):1223–1235, 2018.
- R. Cobos and L. Olmos. A learning analytics tool for predictive modeling of dropout and certificate acquisition on moocs for professional learning. In 2018 IEEE international conference on industrial engineering and engineering management (IEEM), pages 1533–1537. IEEE, 2018.
- Coursera. Data science in stratified healthcare and precision medicine | coursera. https://www.coursera.org/learn/datascimed. Accessed: Dec. 5, 2022.
- J. E. M. Fotso, B. Batchakui, R. Nkambou, and G. Okereke. Algorithms for the development of deep learning models for classification and prediction of behaviour in moocs. In 2020 IEEE Learning With MOOCS (LWMOOCS), pages 180–184. IEEE, 2020.
- R. Gatta, J. Lenkowicz, M. Vallati, E. Rojas, A. Damiani, L. Sacchi, B. De Bari, A. Dagliati, C. Fernandez-Llatas, M. Montesi, A. Marchetti, M. Castellano, and V. Valentini. pminer: An innovative r library for performing process mining in medicine. In A. ten Teije, C. Popow, J. H. Holmes, and L. Sacchi, editors, Artificial Intelligence in Medicine, pages 351–355, Cham, 2017. Springer International Publishing.
- D. Gunning, M. Stefik, J. Choi, T. Miller, S. Stumpf, and G.-Z. Yang. Xai—explainable artificial intelligence. Science robotics, 4(37):eaay7120, 2019.
- N. I. Jha, I. Ghergulescu, and A.-N. Moldovan. Oulad mooc dropout and result prediction using ensemble, deep learning and regression techniques. In CSEDU (2), pages 154–164, 2019.
- K.-J. Kim and C. J. Bonk. The future of online teaching and learning in higher education. Educause quarterly, 29(4):22–30, 2006.
- D. P. Kingma and J. Ba. Adam: A method for stochastic optimization. arXiv preprint arXiv:1412.6980, 2014.
- G. Kőrösi and R. Farkas. Mooc performance prediction by deep learning from raw clickstream data. In International Conference on Advances in Computing and Data Sciences, pages 474–485. Springer, 2020.
- K. Liang, Y. Zhang, Y. He, Y. Zhou, W. Tan, and X. Li. Online behavior analysis-based student profile for intelligent e-learning. Journal of Electrical and Computer Engineering, 2017, 2017.
- D. Litman and K. Forbes-Riley. Predicting student emotions in computer-human tutoring dialogues. In Proceedings of the 42nd Annual Meeting of the Association for Computational Linguistics (ACL-04), pages 351–358, 2004.
- S. M. Lundberg and S.-I. Lee. A unified approach to interpreting model predictions. Advances in neural information processing systems, 30, 2017.
- A. S. Lundervold and A. Lundervold. An overview of deep learning in medical imaging focusing on mri. Zeitschrift für Medizinische Physik, 29(2):102–127, 2019.
- M. E. Matheny, D. Whicher, and S. T. Israni. Artificial intelligence in health care: a report from the national academy of medicine. Jama, 323(6):509–510, 2020.
- B. Mbouzao, M. C. Desmarais, and I. Shrier. Early prediction of success in mooc from video interaction features. In International Conference on Artificial Intelligence in Education, pages 191–196. Springer, 2020.
- P. M. Moreno-Marcos, C. Alario-Hoyos, P. J. Muñoz-Merino, and C. D. Kloos. Prediction in moocs: A review and future research directions. IEEE transactions on Learning Technologies, 12(3):384–401, 2018.
- R. K. Mothilal, A. Sharma, and C. Tan. Explaining machine learning classifiers through diverse counterfactual explanations. In Proceedings of the 2020 conference on fairness, accountability, and transparency, pages 607–617, 2020.
- S. Qu, K. Li, B. Wu, S. Zhang, and Y. Wang. Predicting student achievement based on temporal learning behavior in moocs. Applied Sciences, 9(24):5539, 2019.
- N. Rohani, K. Gal, M. Gallagher, and A. Manataki. Discovering students’ learning strategies in a visual programming mooc through process mining techniques. In Process Mining Workshops: ICPM 2022 International Workshops, Bozen-Bolzano, Italy, October 23–28, 2022, Revised Selected Papers, pages 539–551. Springer, 2023.
- S. L. Schneider and M. L. Council. Distance learning in the era of covid-19. Archives of dermatological research, 313(5):389–390, 2021.
- V. Swamy, B. Radmehr, N. Krco, M. Marras, and T. Käser. Evaluating the explainers: Black-box explainable machine learning for student success prediction in MOOCs. In A. Mitrovic and N. Bosch, editors, Proceedings of the 15th International Conference on Educational Data Mining, pages 98–109, Durham, United Kingdom, July 2022. International Educational Data Mining Society.
- B. Xiao, M. Liang, and J. Ma. The application of cart algorithm in analyzing relationship of mooc learning behavior and grades. In 2018 International Conference on Sensor Networks and Signal Processing (SNSP), pages 250–254. IEEE, 2018.
- A. Zohair and L. Mahmoud. Prediction of student’s performance by modelling small dataset size. International Journal of Educational Technology in Higher Education, 16(1):1–18, 2019.
© 2023 Copyright is held by the author(s). This work is distributed under the Creative Commons Attribution-NonCommercial-NoDerivatives 4.0 International (CC BY-NC-ND 4.0) license.