ABSTRACT
Spatial analytics receive increased attention in educational data mining. A critical issue in stop detection (i.e., the automatic extraction of timestamped and located stops in the movement of individuals) is a lack of validation of stop accuracy to represent phenomena of interest. Next to a radius that an actor does not exceed for a certain duration to establish a stop, this study presents a reproducible procedure to optimize a range parameter for K-12 classrooms where students sitting within a certain vicinity of an inferred stop are tagged as being visited. This extension is motivated by adapting parameters to infer teacher visits (i.e., on-task and off-task conversations between the teacher and one or more students) in an intelligent tutoring system classroom with a dense layout. We evaluate the accuracy of our algorithm and highlight a tradeoff between precision and recall in teacher visit detection, which favors recall. We recommend that future research adjust their parameter search based on stop detection precision thresholds. This adjustment led to better cross-validation accuracy than maximizing parameters for an average of precision and recall (\(F_1\) = 0.18 compared to 0.09). As stop sample size shrinks with higher precision cutoffs, thresholds can be informed by ensuring sufficient statistical power in offline analyses. We share avenues for future research to refine our procedure further. Detecting teacher visits may benefit from additional spatial features (e.g., teacher movement trajectory) and can facilitate studying the interplay of teacher behavior and student learning.
Keywords
1. INTRODUCTION
The increasing accessibility and affordability of position sensing devices have fostered the application of position analytics in educational data mining [4, 18, 27, 28]. Features mined from these novel data streams have various applications, including healthcare worker training [3], the study of teaching strategies [15], and instructor dashboards [4, 18].
One key feature derived from position data is teacher or student stops in the classroom, extracted via decision rules or algorithms for stop detection [16, 25, 26]. For our purposes, we define stop detection as extracting timestamped and located stops (i.e., pauses in movement) from raw data that captures the movement of individuals in classrooms as a time-series of x-y coordinates. Stop detection defines a set of parameters that determine the presence of a stop or interaction between two individuals. Typically, a radius parameter determines a range of motion the actor does not exceed, and a duration parameter designates the minimal amount of time the actor is required to stay in that range of motion.
Stop detection has various nascent applications in educational data mining. Martínez-Maldonado et al. [17] used heatmaps to infer the distribution of teacher visits at different groups of students and inferred teacher strategies by investigating sequences of teacher visits targets. Similarly, An et al. [1] used dandelion diagrams (i.e., a triangular “spotlight” shape) to visualize teachers’ spatial trajectory for teacher reflection tools. Other studies highlighted the importance of spatial teacher attention for learning. One study related teacher-student interactions to improved learning and engagement in a higher education physics lab [21].
With many of these applications emerging, a critical issue in stop detection is a lack of validation of the accuracy of stops to represent phenomena of interest (e.g., teacher-student interactions). Past studies made ad hoc choices for parameters used in stop detection without validating their choices of radius and duration parameters [16, 25, 26]. This is important because a lack of validation in the detection of spatial features can result in noisy variables that either do not relate to learning outcomes of interest (e.g., learning gain differences based on the frequency of teacher visits of students) or, in the worst case, lead to a biased inference. Relatedly, parameter choices need to generalize to diverse classroom settings and layouts adequately, given that the spatial movement of teachers (and the resulting distance parameters during interactions) likely vary across classroom settings and pedagogies [13]. For example, classrooms with technology-based learning have been reported to include spatial movements and behaviors of teachers different from more traditional classroom settings [11].
Taken together, applying prior stop detection procedures to infer teacher visits at particular students in dense K-12 classrooms requires adjustments. The current study presents a reproducible procedure to optimize stop detection parameters for K-12 classrooms. This extension is motivated by adapting parameters to infer teacher visits to students working with an intelligent tutoring system. This study reports initial baselines for detecting and validating inferred teacher visits in K-12 classrooms. Our approach includes optimizing stop detection parameters based on training data of field observations, drawing from studies outside of education that used machine learning for stop detection from video motions [9]. To achieve this, we extend an established stop detection algorithm described in Martínez-Maldonado et al. [16] to account for dense classroom layouts. Finally, we contribute guidelines regarding handling tradeoffs in teacher visit detection accuracy, namely accuracy and recall, concerning sample size. We share reproducible analysis code that includes our stop detection algorithm and its parameter tuning, including synthetic training data.1
2. RELATED WORK
2.1 Stop detection
One key application of stop detection in educational data mining featured in this study is to map the stops of teachers to visits of particular students in the classroom (referred to as teacher visits). We survey prior research on teacher visits and stop detection in educational data mining.
Teacher visits can relate to various constructs relevant to teaching strategies. First, teacher visits can relate to helping students. VanLehn et al. [23] developed a data-driven classroom orchestration tool to recommend teacher visits to students working with intelligent tutoring systems and make visible the limited resources of teachers to visit all students that would require help through qualitative coding of teacher-student interactions. Second, teacher visits can also relate to teacher information seeking [22] and student relationship building [12]. Given teachers’ time and resource constraints to pay spatial attention to all students’ needs in the classroom, past work has argued that improved learning through teacher-facing tools is partially due to improved teacher sensing and attention allocation decisions in the classroom [8]. In line with this reasoning, recent research found student idleness decreased after teacher visits when working with AI tutors [10].
Past methodological choices in stop detection algorithms have been heuristic, ad hoc, and varied. This is important as established machine learning techniques for stop detection are largely based on GPS data (cf. [19]) which do not provide the spatial granularity necessary for stop detection in classroom settings. Martínez-Maldonado et al. [16] used a distance from the teacher’s x-y coordinates of 1 m to detect stops based on a heuristic of individuals’ reported personal space during interpersonal interactions [20] and an ad hoc duration of the proximity of 10 s. Similarly, Yan et al. [26] classified teacher-student interactions by spatial proximity of less than 1 m for longer than 10 s. Yan et al. [25] used heuristics to determine distance thresholds between students and teachers to detect social interactions based on [6]. The distances were classified into intimate (0 – 0.46 m), personal (0.46 – 1.22 m), social (1.22 – 2.10 m), and public (2.10 m and above). Yan et al. [25] acknowledge that further validation work is desirable to assess social interactions through triangulations with more data sources.
2.2 Applications of spatial analytics in educational data mining
We identify three common use cases of spatial analytics in educational data mining. First, spatial analytics can be used to derive features for learning outcome inference. Yan et al. [28] used position data of healthcare students to assess tasks and collaboration performance in simulation-based learning and demonstrate the feasibility of using these analytics to distinguish between different levels of student performance. Yan et al. [26] used Markov chains of student interaction sequences with student and teacher as well as individualized studying primary school to model learning over eight weeks and demonstrate the feasibility of these analytics to detect low-progress students. Second, spatial analytics can guide teacher reflection and strategy. Yan et al. [27] engineered features from teacher position logs to encode proactive or passive teacher interactions. They also demonstrate the feasibility of linking these spatial analytics to different classroom spaces relating to different pedagogies [13]. Third, spatial analytics can inform instructor dashboards and in-the-moment teaching support. Fernandez-Nieto et al. [4] used epistemic network analysis to enact student movements for instructors in nursing education. They find that these enactments were consistently interpreted across multiple instructors. Similarly, Saquib et al. [18] demonstrate that position sensors worn in students’ shoes in early-childhood classrooms can help teachers better plan individualized curriculums and identify student interaction needs.
2.3 The present study
Methodological choices in stop detection have mainly relied on heuristics and ad hoc decisions. Given the increasing use of stop detection and spatial analytics in educational data mining, there is a need to adapt stop detection to different classroom contexts concerning their size, spatial layout, and teaching context. Addressing this gap, this study follows three steps. First, we describe an extended algorithm for stop detection to infer teacher visits based on Martínez-Maldonado et al. [16] to account for dense classroom seating layouts in which teacher visits can relate to multiple students simultaneously. Second, we describe a reproducible procedure to optimize the parameters of that stop detection algorithm given human-coded ground-truth observations in a K-12 classroom working with an intelligent tutoring system. Third, we evaluate the accuracy of our algorithm given different thresholds for the precision of stop detection and discuss the challenges and affordances of our procedure concerning research aims and future work.
3. METHODS
3.1 Data
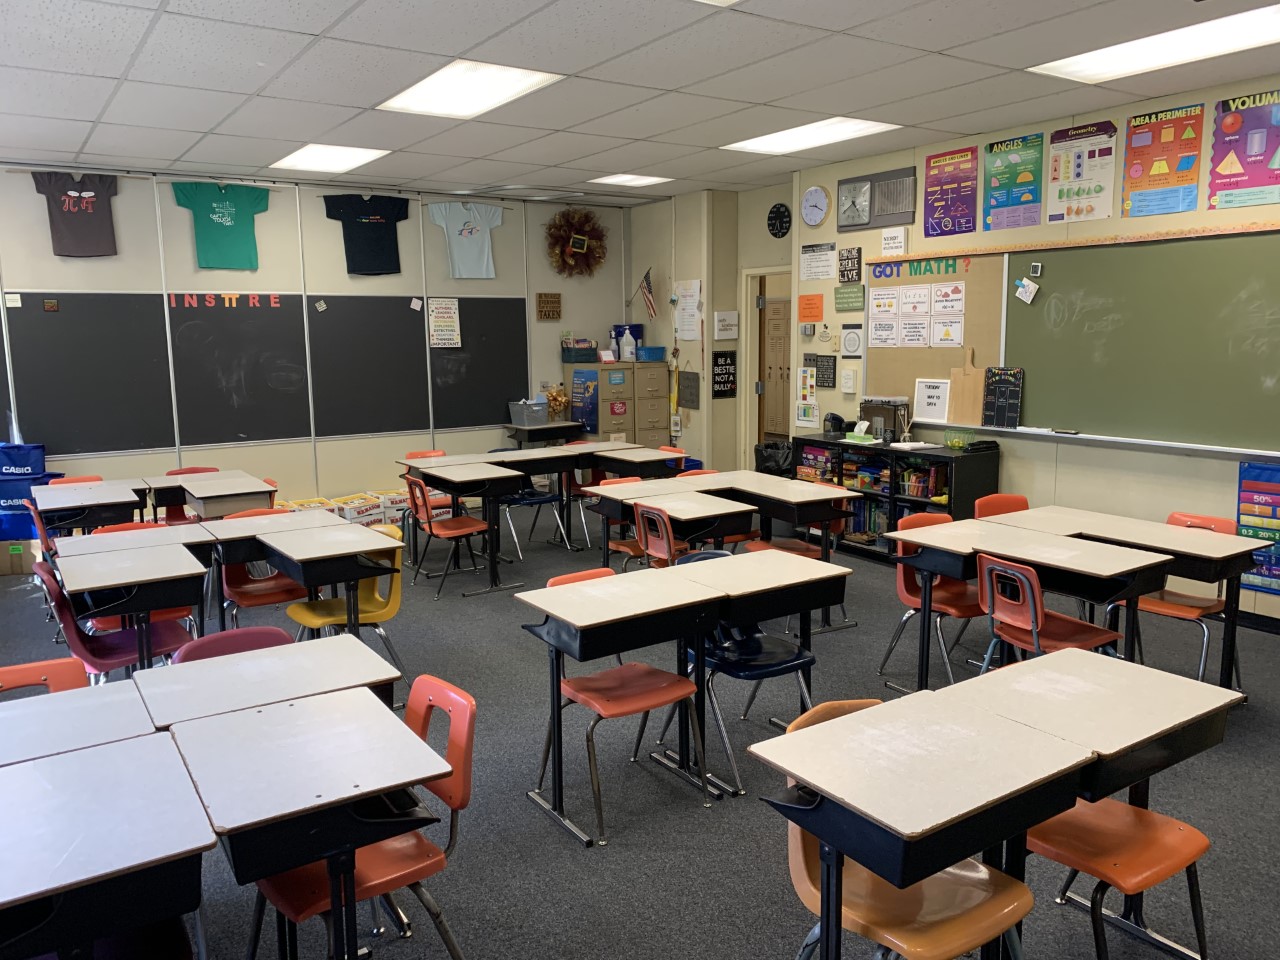
We collected training data for our stop detection algorithm on eighty-five 7th graders and one teacher in a public school in the United States, where we have obtained IRB (i.e., ethics board) approval for data collection. The data included 1) the teacher’s position in the classroom, 2) classroom observation in five distinct classes across three days, and 3) student seating coordinates in the classroom, which were constant throughout the study. Each class held one session daily, and all sessions focused on algebraic equation solving. Figure 1 is a visual of the data collection site.
During all classroom sessions, students worked with an AI tutor, Lynnette [14, 24]. Lynnette is an intelligent tutoring system specialized in equations solving practice for K-12. During practice, the teacher moved around the classroom to support students. According to our classroom observations, students sometimes raised their hands and proactively asked for the teacher’s attention when Lynnette’s hints were insufficient.
To gather teacher position data, we used Pozyx. Pozyx is a positioning system that provides real-time location information based on automated sensing. We placed six anchors as a 2 x 3 matrix in the four borders of the classroom. All timestamped position coordinates, recorded at a one-second sampling rate, included X and Y coordinates in a 2D plane representing the classroom. Tracking tags were used to measure the coordinates of all the major objects in the classroom, including each student’s desk, teacher’s desk, blackboard, window, and door. These reference points were used to track teacher positions concerning students and relevant objects in the classroom.
Following procedures described in Holstein et al. [7], one observer took notes at the back of the classroom during data collection. The observer recorded teacher actions, including “monitoring class” and “helping student #1” and took notes of students’ behaviors like “raising hand”. The observer also noted which student a teacher interacted with. All observations were logged in real-time with time stamps using the “Look Who’s Talking” software. Activities logged as on-task and off-task conversations with students or groups of students (referred to as teacher visits) served as training data for stop detection.
3.2 Stop detection setup and algorithm
To generate accuracy measures for our stop detection algorithm, we match human observations of the teacher visiting particular student(s) to X-Y coordinates of teachers. These timestamped observation logs of teacher visits to particular students(s) serve as ground-truth for algorithm training. We then create estimates of teacher visits based on teacher X-Y coordinates and compare these to the ground-truth stops. Notice that both observer-generated and stop detection-generated teacher visits are accompanied by student subject(s), which can relate to multiple students simultaneously. A preview of the data set for stop detection algorithm optimization is in Table 1.
Martínez-Maldonado et al. [16] proposed a stop detection algorithm based on \(duration\) and \(radius\). The algorithm iterates through the teacher’s position coordinates. A stop is established if the teacher’s X-Y coordinates are within a circle defined by \(radius\) for a pre-defined time (\(duration\)). Extending on this stop detection algorithm, we propose a new method to identify the student(s) visited by the teacher during a teacher’s stop. This extension is motivated by more dense classroom layouts in K-12 classrooms (including the classroom of our data collection), where students usually sit in groups, and the teacher may stand close to and interact with multiple students simultaneously. We define another parameter called “range”. At the time of the stop, students seated within a circle with radius \(r = range\) of the inferred stop are added as subjects of that particular teacher visit. Algorithm 1 describes the algorithm’s implementation.
![Data: Teacher position data: X-Y coordinates with
timestamp; given duration, radius, and range
parameters
Input: arr,result
ORuetspulutt:: r Teesauchletr Visit Intervals
tl ← 0;
stops← List();
while t< tfinal do
|tr ← tl+ 1;
|while WithinRadius(position[tl,tr],radius) do
| tr + +;
|einfd t − t< duration then
| | rtl+l+;
|else
| | studSet = NearbyStuds((tl,tr), range);
| | stops.append((tl,tr,studSet));
tl ← tr;
end
return stops;
Algorithm 1: Stop detection algorithm proposed in this
study](./tmp-make4ht1x.svg)
Our implementation of stop detection via required proximity over a minimal duration features a moving window bounded by two timestamps, \(t_l\) and \(t_r\). The two boundaries move according to the following rules:
-
If the coordinates within the time window are within a certain radius distance relative to a point coordinate, the right-side boundary \(t_r\) will increase by one second;
-
Otherwise, and if \(t_r - t_l \geq duration\), the interval \([t_l, t_r]\) will be denoted as a teacher visits; the visit’s corresponding coordinate centroid will also be stored; and \(t_l\) will be updated to be \(t_l \leftarrow t_r\);
-
If \(t_r - t_l < duration\), let \(t_l\) increment by one second and continue.
3.3 Cross-validation method
Cross-validation is employed to investigate the robustness and generalizability of our stop detection algorithm. Since the dataset contains five class periods (see Section 3.1), splitting the training data into five folds and by class period is natural. There are two reasons behind this decision. First, random student splits may cause data leakage, as the stop detection error on students in the vicinity is expected to be correlated. Second, creating folds based on class period puts our algorithm to the test of accounting for differences in teacher behavior across periods. For example, one of the periods is an honors class, where students’ academic performance is high.
Period-level cross-validation is conducted in five steps. First, the dataset is split into five folds by class period. Second, we define fold \(\#n\) as including period \(\#n\)’s data as testing set and other periods’ data as training set. Third, a full parameter sweep (see Section 4.1) is conducted on each fold’s training data. Fourth, the best-performing parameters is selected for each fold based on the evaluation metrics described in the Evaluation Section. Fifth, the selected parameters are evaluated on each fold’s test set, and evaluation metrics (precision, recall, and \(F_1\) score) are reported.
4. PROPOSED OPTIMIZATION PROCEDURE
To better quantify the values of the three parameters, \(duration\), \(radius\), and \(range\), in more diverse classroom layouts, we present a novel parameter search algorithm based on grid search to optimize the stop detection algorithm.
Grid search takes a pre-defined parameter search space and evaluates each parameter candidate to find a global optimum. The relatively small size of our position data (\(N = 19{,}073\) recorded teacher position records) also enables us to run a grid search within a reasonable time, not requiring complex optimization procedures such as gradient descent. We define the search space of the three parameters via lower and upper bounds, including a step size. The step size designates the value by which the lower bound is incremented for trialing the next parameter value until the upper bound is reached. The search bounds for range and radius were based on estimations of the minimal and maximal distance between students observed in our classroom layout. In addition, the minimal duration was based on the coder’s experience of teacher movement in the classroom, which would entail brief stops for spatial orientation of below 3 s. In contrast, the maximum duration was based on not exploring minimal durations three times as long as those used in prior work (cf. [16]), which we deemed not meaningful. Our search space was \(duration\): \([3, 30)\) where the step size is three and the unit is second, \(radius\): \([200, 2000)\) where the step size is 200 and the unit is millimeter, and \(range\): \([100, 2000)\) where the step size is 200 and the unit is millimeter.
To compare teacher visit detection accuracy across different parameter combinations, we define three metrics for evaluation: hits, misses, and false alarms. We further describe these measures in the next section.
4.1 Evaluation
By treating observation logs as the ground truth, we introduce a function, Evaluate, that outputs three metrics, hits, misses, and false alarms, to describe the alignment between these ground truth representations of teacher visits and the inferred subjects of our stop detection algorithm.
Suppose an arbitrary teacher visit documented in the observation log is \(v_i\), and its corresponding timestamp is \(t_i\). During \(v_i\), a set of student subjects, \(S_i\), were visited. \(S_i\) is the ground truth subject set corresponding to ground truth visit \(v_i\). For each ground-truth observation, compute a timeframe between time stamp \([t_i - 5, t_i + 5]\), which is a 10-second window. We are examining a time frame instead of a single time point because classroom observations of teacher visits include a natural degree of imprecision. The human coder described their time stamp recording of teacher visits and the time of the actual visit to differ by up to 10 s, the size of or timeframe window. In other words, the observation record may be entered a few seconds earlier or later than the true starting time of an event, with \(\pm 5\) seconds being a reasonable estimate as reported by the observer. By filtering variables posStops and inferredSubj with only entries in time frame \([t_i - 5, t_i + 5]\), we can obtain an inferred subject set \(G_i\). We define \(hit_i = | S_i \cap G_i |\), \(miss_i = | S_i \setminus G_i |\), and \(falseAlarm_i = | G_i \setminus S_i |\).
A hit is an element \(S_i\) and \(G_i\) have in common: a correctly inferred student subject that was stopped at. Miss counts the true subjects our stop detection fails to capture, while false alarm keeps records of incorrect subjects tagged by stop detection.
Recall all calculations are based on iterating through the observation log while gathering algorithm-extracted teacher visits within time frame \(\bigcup _{i}[t_i - 5, t_i + 5]\) with \(i\) being in stop index in the observation log. This does not account for incorrectly inferred teacher visits which were never gathered within time frames. We call this collection of unchecked detected stops \(V\). Suppose an arbitrary visit in \(V\) is \(v_j\), and its corresponding inferred subject set \(G_j\). We can also treat these inferences as false alarms: \(falseAlarm_j = | G_j |\). Notice this subscript \(j\) is different from the previous \(i\). We call these false alarm counts to be “outside” since they are outside the unionized time frames. Conversely, \(falseAlarm_i\) represents “inside” false alarms. We evaluate all algorithms based on false alarms inside and outside designated time frames. Still, we note that for some applications, an evaluation of inside false alarms only might be more desirable. To evaluate algorithmic accuracy, we sum the total number of hits, misses, and false alarms for a given parameter combination. We introduce measures that combine these three metrics for optimization, namely precision and recall, which are analogous to precision and recall in machine learning classification tasks:
\begin {equation} recall = \frac {hit}{hit + miss} \end {equation} \begin {equation} precision = \frac {hit}{hit + falseAlarm} \end {equation}
While precision designates the probability of an inferred teacher visit to be correct according to observation logs, recall is the probability of any given observation log teacher visit to be detected via stop detection. We select optimal parameter combinations for stop detection on a global maximization of precision and recall by evaluating all parameter combinations in a grid search based on our search space. For larger data, less extensive optimization algorithms, such as gradient descent, may be preferable.
The following algorithms (Algorithm 2) demonstrate how the grid search is carried out together with Evaluate (Algorithm 3) that implements the aforementioned set calculation:

![seenStops← List();
for obsStop in obsLog do
|t ← obsStop.time;
|stops← posStop[t− 5,t+ 5];
|seenStops.append(stops);
|S ← SubjectOf (obsStop);
|Ghi←t, mSiusbsje,c FtAOf(←stoSpest);Ops(S,G);
|hiti,miss,iFA ← ihit+ hiti,miss+ missi,F A+ FAi;
end
for stop in posStops and stop not in seenStops do
|F Aj+ = |SubjectOf(stop)|;
F A+ = FAj;
end
return hit, miss, F A;
Algorithm 3: Evaluate function body](./tmp-make4ht3x.svg)
5. RESULTS
5.1 Parameter sweep results
We tune stop detection algorithm parameters with respect to precision and recall. As a first step, to gauge the overall performance of our algorithm given different parameter settings, we visualize precision and recall for all of our parameter combinations in Figure 2.
Based on Figure 2, we find that recall deteriorates faster with increasing precision than precision deteriorates with increasing recall. This means that improving precision in our algorithm concerning our training data comes with a relatively high recall cost.

Based on this finding, we identify two ways of sampling an optimal set of parameters for precision and recall. The first set of parameters is derived from maximizing the average of precision and recall (referred to as “absolute maximization”). The resulting set of parameters is \(duration = 6\), \(radius = 1800\), and \(range = 1900\). The radius and range are close to the upper bound of our search space. This may be due to the relatively fast deterioration of recall over precision, overemphasizing recall when averaging precision and recall, and leading to very liberal stop detection. Therefore, we select the second set of parameters based on a minimally required precision cutoff (referred to as “conditional maximization”). We set this cutoff to be \(precision > 0.2\). This selection strategy’s resulting parameters are \(duration = 21\), \(radius = 600\), and \(range = 700\). Notice that the higher the precision cutoff, the lower the number of detected stops will be. Therefore, one way of resolving the precision-recall tradeoff is to set the precision cutoff low enough to obtain a sample size sufficiently large for a given study design. For example, if the study design includes a two-sided \(t\)-test of whether teacher visits are, on average, longer for low- than high-prior knowledge students, a sufficiently large number of stops assuming a power of \(1-\beta = 0.8\) and effect size \(d = 0.3\) would be around \(N = 175\) stops.
5.2 Parameter weights
We fit an ordinary least square (OLS) regression inferring the average of precision and recall to approximate the relative feature importance of our three parameters (i.e., duration, radius, and range) on teacher visit detection accuracy. To compare effect sizes, we \(Z\)-standardize all three parameters to a mean of 0 and a standard deviation of 1. We report the result of the regression in Table 2.
According to Table 2, while all three parameters had a significant association with the average of precision and recall, range had the largest standardized effect size (\(\beta = 0.06\), \(p < .001\)).
5.3 Cross-validation
Given the tradeoff between precision and recall described in Section 5.1, we report cross-validation results broken out by absolute and conditional maximization. Table 3 reports the chosen parameters by fold compared to those chosen by running parameter sweep on all position data.
The parameters chosen for each fold are comparable to the optimal parameters when fitting parameters to the full training data set. Table 4 displays the means and standard deviations of the three performance metrics (\(F_1\), precision, and recall) across the five folds.
Conditional maximization yielded an average \(F_1\) score twice as large as absolute maximization (0.18 compared to 0.09). Moreover, absolute maximization corresponded to liberal teacher visit detection (i.e., low precision at high recall), while conditional maximization led to more balance between precision and recall.
6. DISCUSSION AND CONCLUSIONS
Stop detection and spatial analytics receive increasing attention in educational data mining. Yet, with past stop detection parameter settings being based on heuristics, there is a need to evaluate and optimize stop detection in diverse classroom settings and layouts. In this study, we extended a popular stop detection algorithm to detect teacher visits to particular student(s) in a K-12 math classroom working with intelligent tutoring systems. We introduced metrics to evaluate the algorithm’s accuracy against ground truth human observations of teacher visits. Our three main findings are as follows:
First, we find a large variability in stop detection accuracy given different parameter choices. This is important as past work has primarily relied on ad hoc or heuristic parameter settings in stop detection [16, 25, 26]. As an implication for research, spatial features other than inferred teacher visits may afford similar validation work and adaptation to diverse classroom contexts as presented in this study. Potential outcomes of interest include the total time teachers spent attending to different students, the average visit duration, and the dispersion, or entropy, of visits to students [15]. Our proposed optimization procedure may be readily extended to infer these spatial features.
Second, we establish a benchmark for teacher visit detection accuracy that future research may pick up. To improve accuracy, we contribute a reproducible procedure to adapt our algorithm to diverse classroom layouts and contexts. We described strategies to weight precision and recall to derive meaningful sets of teacher visits for research. Importantly, our results indicate that setting a precision threshold during parameter fitting yields superior cross-validation accuracy. More generally, we find a precision-recall tradeoff in detecting teacher visits that favors recall over precision, as precision came with a higher cost in the tradeoff. This might be due to the nature of our data set, as our classroom layout included dense groups of students compared to previous studies using open learner spaces [16]. Teachers may have interacted only with a subset of students sitting in a group, leading to larger ranges for satisfactory recall at an excess of false positives and diminishing precision. Coding teachers’ proximity to groups rather than teacher-student interactions might be a more tractable prediction task based on position coordinates alone in dense classroom layouts. For the detection of teacher visits, the high cost of precision in dense classrooms may result in lower statistical power through smaller sample sizes of resulting visits as the number of detected visits diminishes with increasing precision. Researchers may adjust precision thresholds accordingly. We note, however, that with lower precision, statistical associations might be less likely to be detected as the false positive teacher visits introduce noise to features. Therefore, we recommend future research to estimate the expected number of stops during classroom sessions ahead of the data collection to plan sample sizes accordingly. Multiplying estimates of the number of expected stops with stop detection precision could yield an estimate for the number of detected stops for power analyses.
Third, we find that range (i.e., the minimally required distance of students to the teacher during visits) had the largest association with teacher visit detection accuracy. Notice that range was the new parameter we defined to detect multiple students in proximity to the teacher during stops to account for dense classroom layouts. This suggests that the largest improvement to our algorithm might be achieved through optimizing the decision rules for tagging groups of students in proximity to the teacher. One such improvement might be approximating the teacher’s orientation during the visit based on past movement trajectory. Future work may test whether excluding students not faced by the teacher (e.g., seated behind their back) from stop detection improves accuracy. Finally, further improvements of the range parameter appear desirable, particularly for dense classroom layouts with groups of students, such as K-12 classrooms.
6.1 Limitations and future work
We acknowledge limitations to our current methodology that future research may improve upon. First, limitations may emerge from how our ground truth observation data of teacher visits were coded. In particular, manual coders could only code visits to an accuracy level of a time frame of 10 s. Future work may improve training data quality by using more coders and establishing inter-rater reliability for the coding of visits or other means of automatically generating observation logs during classroom sessions, for example, by recording observations verbally with a microphone rather than typing them into a laptop. More accessible tools for coding may reduce the time lag in human coding during model optimization and improve overall stop detection accuracy. We note that the quantitative definition of stops may differ based on the research context. Hence, future work may refine coding schemes for coders to capture spatial attributes of different research contexts (e.g., coding 1-to-1 interactions between teachers and students compared to group visits). In both cases, our optimization procedure allows for adapting stop detection to such complexities for more nuanced explorations in offline analyses.
Second, our algorithm may require more sophisticated decision rules to achieve better accuracy. Based on our evaluation, inferring teacher visits may benefit from additional spatial features for algorithm training other than the teacher’s spatial position only (e.g., information about the teacher’s movement trajectory before a visit). Our relatively low cross-validation \(F_1\) score of 0.18 may relate to the challenge of inferring teacher visits to particular students when the students of interest sit close to others not visited. Next to teacher visits, teacher proximity may also encode teacher attention effects on student learning, such as motivational and performance differences through mere presence [2, 5]. Future extensions of our algorithm could also consider specific teacher movement strategies. For example, models could calibrate to the usual distance of teachers when interacting with students. Teachers may have different distances from different students (e.g., due to some students sitting in the back of the classroom). Fitting a parameter to student characteristics to adjust the distance in stop detection may improve accuracy while being sufficiently generalizable to new students. Similarly, future research may also consider fitting the stop detection parameters as a function of spatial attributes instead of being static. Under a dynamic set of parameters, the detection algorithm may be better able to differentiate between teacher standing at the periphery of the classroom observing and actually visiting students in the middle of the classroom.
Third, the cross-validation indicates that our stop detection algorithm and optimization procedure are generalizable across different class periods. However, this study only explored one classroom layout setting: a dense layout with grouped seating typically found in US K-12 classrooms. More research is needed to gauge the performance of our algorithm and optimization procedure for other seating arrangements.
We see two central use cases of our proposed stop detection algorithm and optimization procedure. First, future research could use our adaptive algorithm to more accurately mine stops and investigate teachers’ attention distribution at a lower cost. Our algorithm can learn relevant stop detection parameters from human-coded examples of teacher visits and automatically generate a teacher visit distribution from optimized parameters, facilitating data collection. Second, our stop detection algorithm can be incorporated into teacher-facing reflection and orchestration tools, where stop detection can serve as a feature for teacher-facing analytics. These applications can help facilitate the study of the interplay of teacher behavior and student learning.
7. REFERENCES
- P. An, S. Bakker, S. Ordanovski, C. L. Paffen, R. Taconis, and B. Eggen. Dandelion diagram: aggregating positioning and orientation data in the visualization of classroom proxemics. In Extended Abstracts of the 2020 CHI Conference on Human Factors in Computing Systems, pages 1–8, 2020.
- R. Bdiwi, C. de Runz, S. Faiz, and A. Ali-Cherif. Smart learning environment: Teacher’s role in assessing classroom attention. Research in Learning Technology, 27, 2019.
- V. Echeverria, R. Martinez-Maldonado, T. Power, C. Hayes, and S. B. Shum. Where is the nurse? towards automatically visualising meaningful team movement in healthcare education. In International Conference on Artificial Intelligence in Education, pages 74–78. Springer, 2018.
- G. M. Fernandez-Nieto, R. Martinez-Maldonado, K. Kitto, and S. Buckingham Shum. Modelling spatial behaviours in clinical team simulations using epistemic network analysis: methodology and teacher evaluation. In LAK21: 11th International Learning Analytics and Knowledge Conference, pages 386–396, 2021.
- B. Guerin. Mere presence effects in humans: A review. Journal of Experimental Social Psychology, 22(1):38–77, 1986.
- E. T. Hall. The Hidden Dimension. Anchor, 1966.
- K. Holstein, B. M. McLaren, and V. Aleven. Spacle: investigating learning across virtual and physical spaces using spatial replays. In Proceedings of the Seventh International Learning Analytics & Knowledge Conference, pages 358–367, 2017.
- K. Holstein, B. M. McLaren, and V. Aleven. Student learning benefits of a mixed-reality teacher awareness tool in ai-enhanced classrooms. In International Conference on Artificial Intelligence in Education, pages 154–168. Springer, 2018.
- Y. Jin, G. Suzuki, and H. Shioya. Detecting and visualizing stops in dance training by neural network based on velocity and acceleration. Sensors, 22(14):5402, 2022.
- S. Karumbaiah, C. Borchers, T. Shou, A.-C. Falhs, P. Liu, T. Nagashima, N. Rummel, and V. Aleven. A spatiotemporal analysis of teacher practices in supporting student learning and engagement in an AI-enabled classroom. In AIED23: 24th International Conference on Artificial Intelligence in Education, 2023.
- A. Kessler, M. Boston, and M. K. Stein. Exploring how teachers support students’ mathematical learning in computer-directed learning environments. Information and Learning Sciences, 2019.
- A. Kwok. Classroom management actions of beginning urban teachers. Urban Education, 54(3):339–367, 2019.
- F. V. Lim, K. L. O’Halloran, and A. Podlasov. Spatial pedagogy: Mapping meanings in the use of classroom space. Cambridge Journal of Education, 42(2):235–251, 2012.
- Y. Long and V. Aleven. Gamification of joint student/system control over problem selection in a linear equation tutor. In S. Trausan-Matu, K. E. Boyer, M. Crosby, and K. Panourgia, editors, Intelligent Tutoring Systems, pages 378–387, Cham, 2014. Springer International Publishing.
- R. Martinez-Maldonado, V. Echeverria, J. Schulte, A. Shibani, K. Mangaroska, and S. Buckingham Shum. Moodoo: indoor positioning analytics for characterising classroom teaching. In International Conference on Artificial Intelligence in Education, pages 360–373. Springer, 2020.
- R. Martinez-Maldonado, J. Schulte, V. Echeverria, Y. Gopalan, and S. B. Shum. Where is the teacher? digital analytics for classroom proxemics. Journal of Computer Assisted Learning, 36(5):741–762, 2020.
- R. Martínez-Maldonado, L. Yan, J. Deppeler, M. Phillips, and D. Gašević. Classroom analytics: Telling stories about learning spaces using sensor data. In Hybrid Learning Spaces, pages 185–203. Springer, 2022.
- N. Saquib, A. Bose, D. George, and S. Kamvar. Sensei: sensing educational interaction. Proceedings of the ACM on Interactive, Mobile, Wearable and Ubiquitous Technologies, 1(4):1–27, 2018.
- V. Servizi, F. Pereira, M. Anderson, and O. Nielsen. Mining user behaviour from smartphone data, a literature review. 12 2019.
- M. Sousa, D. Mendes, D. Medeiros, A. Ferreira, J. M. Pereira, and J. Jorge. Remote proxemics. In Collaboration Meets Interactive Spaces, pages 47–73. Springer, 2016.
- J. B. Stang and I. Roll. Interactions between teaching assistants and students boost engagement in physics labs. Physical Review Special Topics-Physics Education Research, 10(2):020117, 2014.
- A. van Leeuwen, N. Rummel, and T. Van Gog. What information should cscl teacher dashboards provide to help teachers interpret cscl situations? International Journal of Computer-Supported Collaborative Learning, 14(3):261–289, 2019.
- K. VanLehn, H. Burkhardt, S. Cheema, S. Kang, D. Pead, A. Schoenfeld, and J. Wetzel. Can an orchestration system increase collaborative, productive struggle in teaching-by-eliciting classrooms? Interactive Learning Environments, 29(6):987–1005, 2021.
- M. Waalkens, V. Aleven, and N. Taatgen. Does supporting multiple student strategies lead to greater learning and motivation? investigating a source of complexity in the architecture of intelligent tutoring systems. Computers & Education, 60(1):159–171, 2013.
- L. Yan, R. Martinez-Maldonado, B. G. Cordoba, J. Deppeler, D. Corrigan, G. F. Nieto, and D. Gasevic. Footprints at school: Modelling in-class social dynamics from students’ physical positioning traces. In LAK21: 11th International Conference on Learning Analytics and Knowledge, pages 43–54, 2021.
- L. Yan, R. Martinez-Maldonado, B. Gallo Cordoba, J. Deppeler, D. Corrigan, and D. Gašević. Mapping from proximity traces to socio-spatial behaviours and student progression at the school. British Journal of Educational Technology, 2022.
- L. Yan, R. Martinez-Maldonado, L. Zhao, J. Deppeler, D. Corrigan, and D. Gasevic. How do teachers use open learning spaces? mapping from teachers’ socio-spatial data to spatial pedagogy. In LAK22: 12th International Learning Analytics and Knowledge Conference, pages 87–97, 2022.
- L. Yan, R. Martinez-Maldonado, L. Zhao, S. Dix, H. Jaggard, R. Wotherspoon, X. Li, and D. Gašević. The role of indoor positioning analytics in assessment of simulation-based learning. British Journal of Educational Technology, 2022.
1github.com/Sho-Shoo/stop-detection-optimization-edm23
© 2023 Copyright is held by the author(s). This work is distributed under the Creative Commons Attribution-NonCommercial-NoDerivatives 4.0 International (CC BY-NC-ND 4.0) license.