ABSTRACT
The use of Bayesian Knowledge Tracing (BKT) models in predicting student learning and mastery, especially in mathematics, is a well-established and proven approach in learning analytics. In this work, we report on our analysis examining the generalizability of BKT models across academic years attributed to "detector rot." We compare the generalizability of Knowledge Training (KT) models by comparing model performance in predicting student knowledge within the academic year and across academic years. Models were trained on data from two popular open-source curricula available through Open Educational Resources. We observed that the models generally were highly performant in predicting student learning within an academic year, whereas certain academic years were more generalizable than other academic years. We posit that the Knowledge Tracing models are relatively stable in terms of performance across academic years yet can still be susceptible to systemic changes and underlying learner behavior. As indicated by the evidence in this paper, we posit that learning platforms leveraging KT models need to be mindful of systemic changes or drastic changes in certain user demographics.
Keywords
1. INTRODUCTION
Modeling student knowledge and mastery of particular skills is a foundational problem to the domain of learning analytics and its intersections with education and artificial intelligence. The first proposed solution to the Knowledge Tracing (KT) problem, dubbed Bayesian Knowledge Tracing (BKT) by its creators [3], modeled knowledge as the mastery of multiple independent knowledge concepts (KCs, or skills) and estimated mastery through the use of a latent variable in a Hidden Markov Model. Student mastery of a skill is assumed to be a noisy representation of this latent variable, moderated by four parameters: a student’s prior knowledge, the likelihood of mastering the skill through attempting a problem, the chance a student answers correctly by guessing, and the chance a student answers incorrectly by mistake. Future work augmenting BKT attempted to improve model performance by modifying the assumptions of the initial model. For example, classical BKT models assume the acquisition of knowledge is unidirectional, from a state of non-mastery to a state of mastery. Relaxing this assumption and allowing for student knowledge to move bidirectionally between mastery and non-mastery resulted in models that more accurately predict student performance, and thus more accurately model student knowledge [14]. Further model extensions include allowing individual students to have personal prior knowledge rates [10] and giving individual questions their own guess and slip rates [11]. While other statistical models such as Performance Factors Analysis [12] showed initial promise, later advances in the domain of machine learning resulted in the creation of deep learning models to solve the problem of KT, utilizing a recurrent neural network in Deep Knowledge Tracing (DKT) [13] and self-attention in Self Attentive Knowledge Tracing (SAKT) [9]. However, BKT still serves as a useful way of modeling student knowledge due to the model’s interpretability, especially in comparison to larger models [6]. BKT models require far fewer parameters to train in comparison to the deep-learning models even when BKT models incorporate the available extensions. If the performance of the model is a priority and the generalizability of the model is not guaranteed, then training new models in response to some population shift is advisable. Indeed, this is a common practice in online learning platforms when such shifts occur, such as the beginning of a new school year or the integration of a new curriculum. However, how do we know how often our KT models should be retrained?
More precisely, we wish to examine the performance of BKT models across time. Our analysis was guided by the following research questions:
- Do BKT models lose predictive power with time?
- Does the complexity of a KT model impact its generalizability through time?
- Do sudden shifts in student populations or behavior impact model performance?
To answer these questions, we gathered data collected through the ASSISTments platform across four school years from 2018-2022. We then compare model performance on data from the same year as training with model performance across years. Additionally, we posit that the COVID-19 pandemic caused a shift in student and teacher perception of technology for learning as there were no alternatives available to adopting technology in classrooms. As such we examine the shift in the learner behavior by examining the generalizability KT models trained on pre-pandemic data to predict learning during the pandemic and vice versa. We begin by discussing the challenges to education posed by the COVID-19 pandemic, focusing on the rapid adoption of online learning tools during the pandemic. Next, we describe the data generation and sampling process for our analysis. The student data available from ASSISTments across the four academic years establish a fair comparison of the KT models that is not susceptible to the size of the dataset since different academic years had varying number of users. We then describe the KT models used in our analysis and the approach we took in examining the generalizability of KT models. We compare model performance of classical BKT and BKT with forgetting models within the same academic year, across different academic years, and across the beginning of the pandemic, along with the impact of the forgetting parameter on model generalizability. We then discuss the implications of our findings on the implementation of KT models, and discuss the limitations of our analysis and their implications for future research.
1.1 COVID-19 Pandemic
The COVID-19 pandemic has presented many challenges to the delivery of education to students [4]. As many schools closed their doors, students were required to attend classes and complete coursework using online tools. This resulted in the rapid adoption of online learning platforms leading to a significant growth in the user base of platforms such as ASSISTments. This influx of new users likely introduces a more diverse group of students into school populations, since schools integrated various learning tools to support their students. Additionally, the sudden shift in the perception of technology and its use in teaching for many schools also present an interesting opportunity to explore the robustness and generalizability of KT models.
Given the wide-reaching changes to education caused by the COVID-19 pandemic, the impact these changes had on student learning requires more investigation. For the purposes of our analysis, we divided data gathered into two meta-groups: pre-pandemic and post-pandemic, with "post-pandemic" data merely denoting data that was gathered after the initial transition into online learning in mid-March 2020.
2. RELATED WORK
Analysis of more complex inferential models used by MATHia found that models intended to detect “gaming the system” behaviors [2] trained on older data were significantly less precise on newer data [7]. It was found that more contemporary machine learning models designed to detect gaming experienced a greater performance decrease than classical, computationally simpler models. This phenomenon was called "detector rot" by its authors in reference to a similar phenomenon called "code rot" in which code performance decreases over time [5]. The analysis provided by [7] featured a comparison of models trained on data collected more than a decade apart, with models trained to solve a complex problem with a large feature space. We aim to contribute to the understanding of detector rot by examining model performance along more granular time steps, across dramatic population shifts, and with models solving a problem with a much smaller feature space.
3. METHODS
3.1 Data Collection
Data for each school year was gathered from problem logs between the dates of September 1st and June 1st. Summer months were excluded as the student population during the summer can vary more drastically from year to year. The student cohort during some summers primarily consists of students requiring additional work to reach their credit requirements while other summers are filled with high achieving students working on extra credit. Problem level data from the typical academic year was then filtered based on several criteria in order to ensure different academic years were able to be directly compared. Comparison between two populations with little intersection in the skills being assessed would result in poor model generalizability based solely on underfitting. To ensure direct comparisons were possible and appropriate, we limited our underlying populations to problems sourced from the two most popular open-source math curricula available through OER [8] on the ASSISTments platform: EngageNY/Eureka Math and Kendall Hunt’s Illustrative Mathematics. From these two curricula, we calculated the top five hundred most commonly assigned problem sets across all four of our target years. The final populations we constructed before sampling were filtered by these top five hundred common problem sets, with the exception of the 2018-2019 school year. Data from this year was significantly more sparse than other years due to the introduction of a new implementation of the ASSISTments tutor, and as such we only applied the curriculum filter to this year. Since the introduction of the new tutor experience, student behavior has been logged in a consistent fashion.
| Year | Total Rows | Total Assignments | Unique Students | % Correct |
|---|---|---|---|---|
| 2018-2019 | 291,437 | 31,930 | 4,425 | 0.534 |
| 2019-2020 | 521,781 | 130,173 | 47,595 | 0.526 |
| 2020-2021 | 8,459,566 | 1,310,652 | 190,366 | 0.494 |
| 2021-2022 | 2,645,324 | 361,546 | 58,216 | 0.547 |
| Feature | Description |
|---|---|
| \(user\) | Unique student identifier |
| \(assignment\) | Unique identifier for an assignment |
| \(correct\) | 0 if the student incorrectly applies skill, 1 otherwise |
| \(start\_time\) | Timestamp of when the problem was started by the student |
| \(problem\) | Unique identifier for a problem |
| \(curriculum\) | Curriculum the problem originated from |
| \(skill\) | Skill being assessed by the current question |
| \(attempt\_number\) | Counts which attempt on the problem this row represents |
3.2 Student Modeling
Students in ASSISTments can make unlimited attempt when answering a problem until they answer it correctly, with the number of attempts a student takes to correctly answer a problem being recorded in problem-level data. The problem level data also includes information on the number of help requests and if the student requested for the answer to the problem. BKT attempts to predict student performance on attempts to apply a skill [3]. However, in the original problem level data, each student/problem interaction only has a single row. In an effort to encode information about how many attempts a student took to complete a problem, the original problem logs were used to create a dataset with each row representing a student’s attempt to apply a skill. Additionally, if a student’s final correct answer for a question came from a bottomed-out hint, explanation, or simply requesting the answer, the student’s final correct answer was treated as an incorrect application of the skill. Information about the amount of data available for each year at the end of the filtering and encoding process can be found in Table 1, while a description of the available features present in all datasets can be found in Table 2. Ten samples of 25,000 assignment level data per year were generated for each year of the data. To investigate the effect of additional model parameters on model generalizability, two models were trained at each step: one with forgetting and one without. Other than this additional parameter, all training parameters were initialized in the same way. Models were constructed using pyBKT, a Python library for creating BKT models described by [1]. For analysis of within-year performance, a five-fold cross-validation was performed on each sample from the 10 samples, resulting in fifty measurements of AUC being taken for exploring model performance within the training year. For the inter-year performance analysis, the models were trained on one of the 10 random samples from a target year and evaluated on the other corresponding random samples from the other three years. This resulted in the generation of thirty measurements of AUC, since the model for each year was trained on 10 random samples and tested on 10 random samples from other three years resulting in 30 data points for the across year generalizability analysis. Finally, data from the 18-19, 19-20, and 20-21 years was split around the beginning of the COVID-19 pandemic (the precise date was March 12, 2020) and ten samples each containing 50,000 assignment level data were generated on each side of this split. The same process of five-fold cross-validation followed by a cross-year train/test analysis was performed on these pandemic samples.
4. RESULTS
4.1 Robustness Over Time (RQ1)
| 18-19 Data | 19-20 Data | 20-21 Data | 21-22 Data | Training Year Avg | |
|---|---|---|---|---|---|
| 18-19 Model | 0.669 | 0.672 | 0.678 | 0.673 | |
| 19-20 Model | 0.682 | 0.729 | 0.714 | 0.709 | |
| 20-21 Model | 0.686 | 0.726 | 0.734 | 0.715 | |
| 21-22 Model | 0.690 | 0.724 | 0.748 | 0.721 | |
| Testing Year Avg | 0.686 | 0.706 | 0.716 | 0.709 |
| 18-19 Data | 19-20 Data | 20-21 Data | 21-22 Data | Training Year Avg | |
|---|---|---|---|---|---|
| 18-19 Model | 0.687 | 0.683 | 0.694 | 0.688 | |
| 19-20 Model | 0.686 | 0.740 | 0.730 | 0.719 | |
| 20-21 Model | 0.706 | 0.739 | 0.757 | 0.734 | |
| 21-22 Model | 0.708 | 0.736 | 0.766 | 0.735 | |
| Testing Year Avg | 0.700 | 0.721 | 0.730 | 0.727 |
Data gathered from our evaluations across academic years can be found in Tables 3 and 4, while the resulting means from our five-fold cross-validations plotted along with their 95% confidence intervals can be found in Figure 4.2. Rather unsurprisingly, the within year generalizability of the BKT models was high with the BKT + forgetting model always outperforming the classical BKT model. However the model generalizability when trained on one year and applied to other years varied across academic years: by comparing the training year averages provided in Tables 3 and 4, models trained on the 20-21 and 21-22 school years had higher average AUCs, while the 18-19 school year produced the least generalizable models. Similarly, different years were easier to generalize to than others, with the 18-19 school year having a much lower testing year average for both model types.
4.2 Complexity (RQ2)
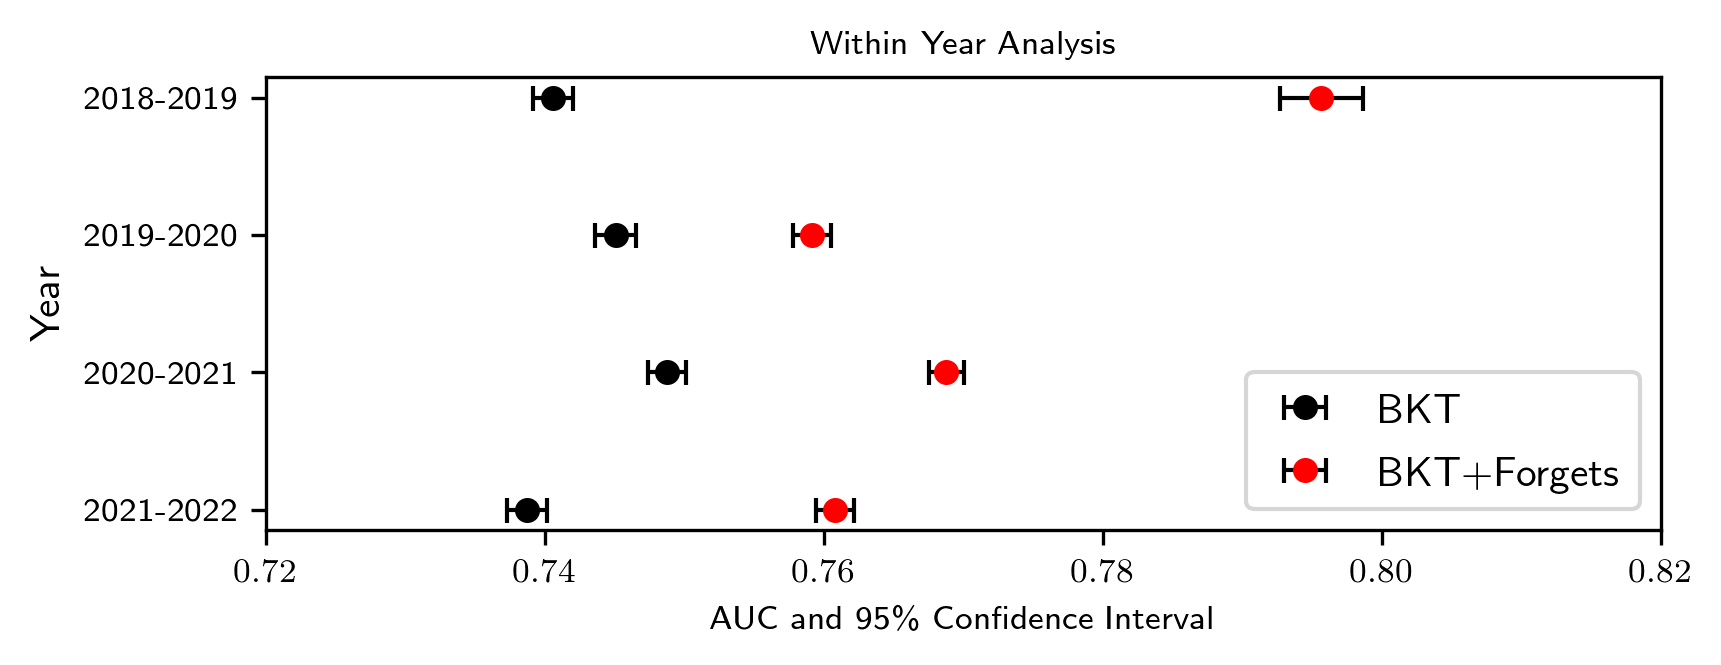
One general observation seen from each of the analyses is that BKT+Forgets consistently outperforms classical BKT in terms of its predictive power as measured by mean AUC. Our findings strongly suggest the introduction of a forgetting parameter for each skill can be done with little chance of significantly harming a model’s later generalizability.
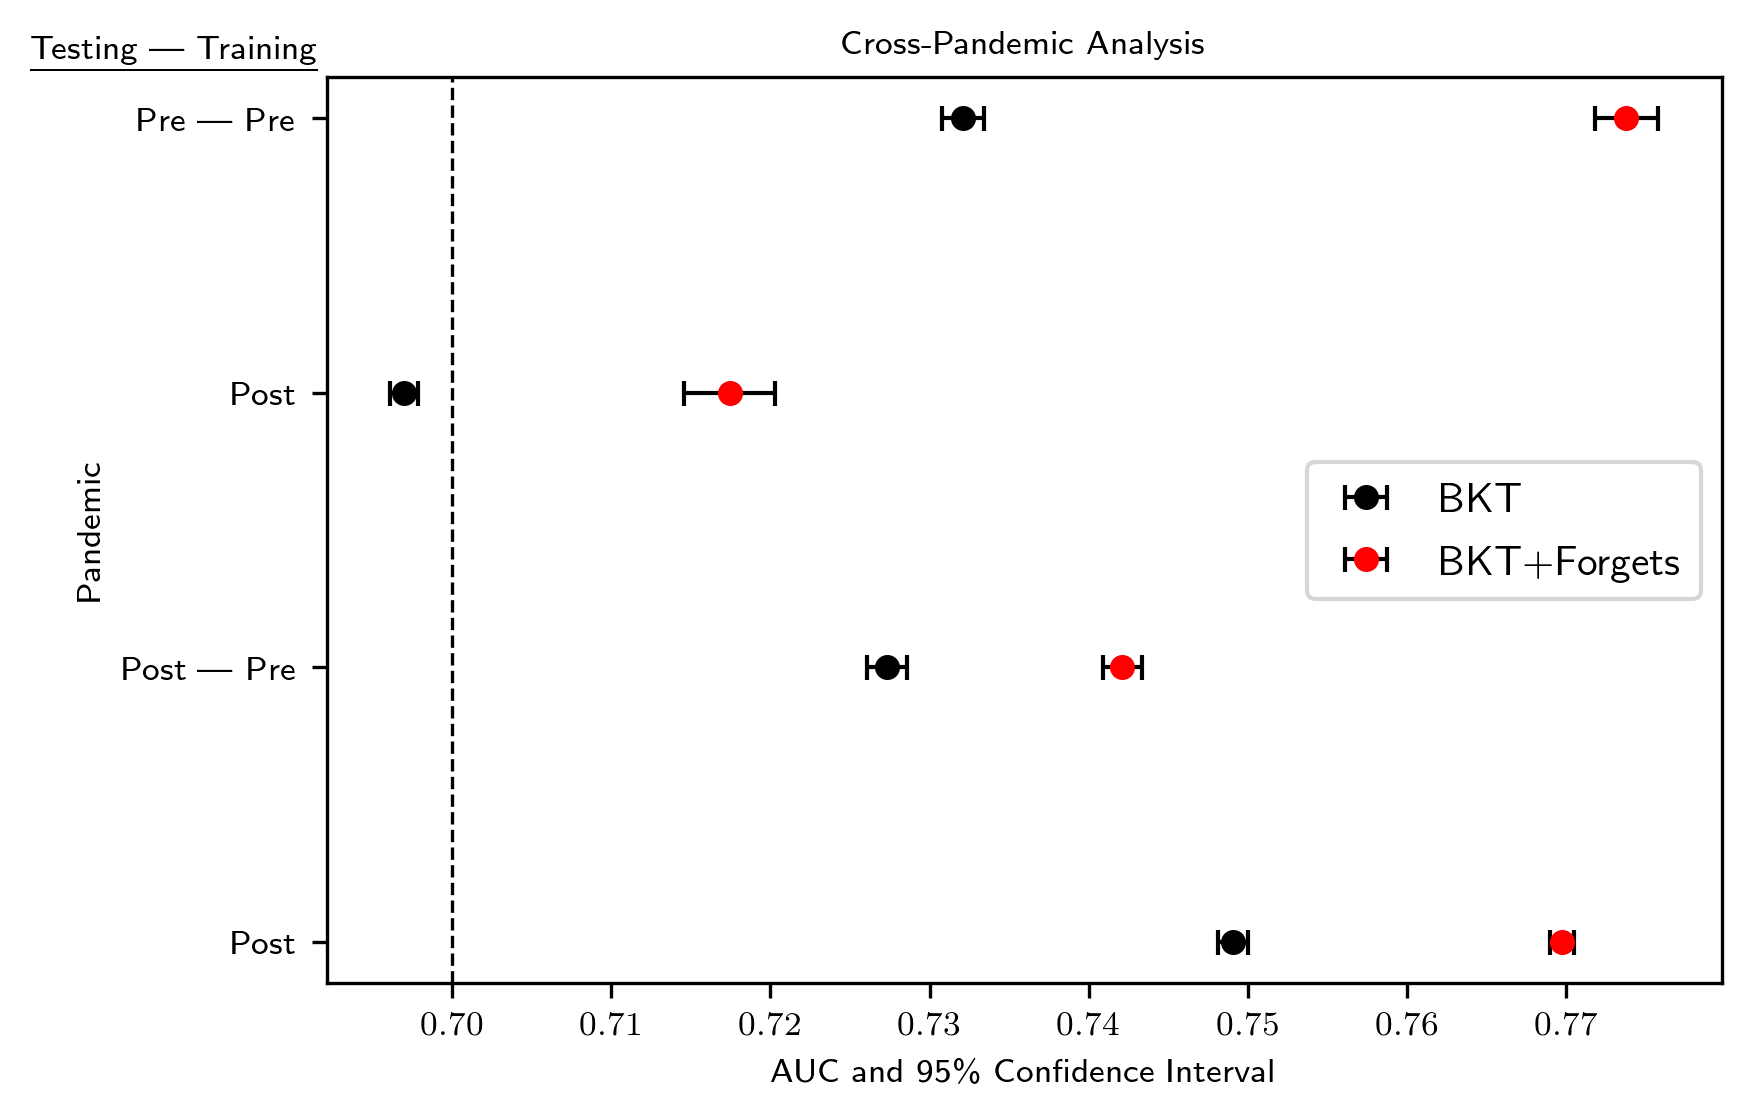
4.3 Sudden Shifts: Pandemic Analysis (RQ3)
Data gathered from training and evaluating models before and after the COVID-19 pandemic can be found in Table 5, while these means and relevant confidence intervals were plotted in Figure 4.3. Models trained on data gathered before the pandemic had difficulties generalizing to post-pandemic data. Consider models evaluated on the post-pandemic dataset. The delta means between models trained on pre-pandemic data and post-pandemic data were 0.022 for classical BKT and 0.028 for BKT + forgets. This generalization problem also occurs when considering models evaluated on the pre-pandemic data, suggesting that KT models are susceptible to losses in predictive power following major shifts in underlying user populations.
As was true with the year-by-year data, the addition of a forgetting parameter to the classical BKT model significantly improves performance, even across the population shift. The use of model additions may improve generalizability in a way that can withstand significant shifts in population and user behavior.
| Testing Period | Training Period | Model Type | Mean AUC | 95%CE |
|---|---|---|---|---|
| Pre-pandemic | Pre-Pandemic | BKT | 0.732 | [0.731,0.733] |
| BKT+Forgets | 0.774 | [0.772,0.776] | ||
| Post-Pandemic | BKT | 0.697 | [0.696,0.698] | |
| BKT+Forgets | 0.717 | [0.715,0.720] | ||
| Post-pandemic | Pre-pandemic | BKT | 0.727 | [0.726,0.729] |
| BKT+Forgets | 0.742 | [0.741,0.743] | ||
| Post-pandemic | BKT | 0.749 | [0.748,0.750] | |
| BKT+Forgets | 0.770 | [0.769,0.771] |
5. DISCUSSION
In this paper, we explored the generalizability of KT models within and across academic years. The concept of "detector rot" [7] is a recent addition to how we understand inferential models and their applications in online tutoring platforms. With this analysis of how KT models perform over time, we intend to further explore the concept as it applies to KT models. Our exploration began by collecting data in a way that ensured the set of skills in each year’s worth of data were comparable and then translating the raw problem level data into attempt-level representations of student performance. Models were evaluated both on the year in which they were trained (by a five-fold cross-validation), and on the other available years. We trained both classical BKT models and models with a forgetting parameter to investigate how adding model parameters impacts model generalizability. We also divided our available data around the beginning of the COVID-19 pandemic to investigate the impact of sudden shifts in population size on model generalizability. We have a few key findings to report from these investigations. (a) In contrast to more sophisticated models, BKT’s performance is relatively stable from year to year, indicating that the problem of detector rot is far less prevalent within the domain of KT. (b) The addition of forgetting parameters to BKT models consistently improves performance across multiple years of student population drift, and across more sudden changes of population. (c) Drastic changes in an online tutoring system’s user base can impact BKT models’ performance.
While our results indicate KT model stability over short-term population changes, our work is limited by several factors which future research could address. Our attempts to ensure each dataset contained a large overlap of skills could result in our models showing higher AUCs across time than comparable KT models would show in a product-scale system. Also, the 18-19 school year was particularly difficult for other models to generalize to. This is likely due to the sparsity of data for that year limiting our ability to filter by commonly assigned problem sets. Future work leveraging more data as ASSISTments continues to be used through time may give more insight as to why some years are easier for models to generalize to than others. Our analysis of RQ2 was also limited by only exploring how forgetting parameters impact generalizability. Future work incorporating more extensions to BKT, such as those described by [10] and [11], or utilizing more complex KT models like PFA [12] and DKT [13] is required to investigate trade-offs between model complexity and generalizability found in previous detector rot research [7]. Finally, while our analysis of RQ3 shows that BKT models had trouble generalizing across the beginning of the COVID-19 pandemic, the reasons for this could be numerous, including the sparsity of data pre-pandemic compared to post-pandemic or differences in student behavior after the pandemic began. Further analysis of how the COVID-19 pandemic impacted student behavior, possibly focusing on the transitional period from remote schooling back to in-person learning, could provide more insight into how student demographic changes affect KT models.
6. REFERENCES
- A. Badrinath, F. Wang, and Z. Pardos. pybkt: an accessible python library of bayesian knowledge tracing models. arXiv preprint arXiv:2105.00385, 2021.
- R. S. Baker, A. T. Corbett, K. R. Koedinger, and A. Z. Wagner. Off-task behavior in the cognitive tutor classroom: When students" game the system". In Proceedings of the SIGCHI conference on Human factors in computing systems, pages 383–390, 2004.
- A. T. Corbett and J. R. Anderson. Knowledge tracing: Modeling the acquisition of procedural knowledge. User modeling and user-adapted interaction, 4(4):253–278, 1994.
- W. E. Forum. The rise of online learning during the covid-19 pandemic | world economic forum, 2020.
- C. Izurieta and J. M. Bieman. A multiple case study of design pattern decay, grime, and rot in evolving software systems. Software Quality Journal, 21(2):289–323, 2013.
- M. Khajah, R. V. Lindsey, and M. C. Mozer. How deep is knowledge tracing? CoRR, abs/1604.02416, 2016.
- N. Levin, R. S. Baker, N. Nasiar, S. Fancsali, and S. Hutt. Evaluating gaming detector model robustness over time. In Proceedings of the 15th International Conference on Educational Data Mining, International Educational Data Mining Society, 2022.
- C. o. C. S. S. O. National Governors Association Center for Best Practices. Common core state standards (mathematics standards), 2010.
- S. Pandey and G. Karypis. A self-attentive model for knowledge tracing. arXiv preprint arXiv:1907.06837, 2019.
- Z. A. Pardos and N. T. Heffernan. Modeling individualization in a bayesian networks implementation of knowledge tracing. In International conference on user modeling, adaptation, and personalization, pages 255–266. Springer, 2010.
- Z. A. Pardos and N. T. Heffernan. Kt-idem: Introducing item difficulty to the knowledge tracing model. In International conference on user modeling, adaptation, and personalization, pages 243–254. Springer, 2011.
- P. I. Pavlik Jr, H. Cen, and K. R. Koedinger. Performance factors analysis–a new alternative to knowledge tracing. Online Submission, 2009.
- C. Piech, J. Bassen, J. Huang, S. Ganguli, M. Sahami, L. J. Guibas, and J. Sohl-Dickstein. Deep knowledge tracing. In C. Cortes, N. Lawrence, D. Lee, M. Sugiyama, and R. Garnett, editors, Advances in Neural Information Processing Systems, volume 28. Curran Associates, Inc., 2015.
- Y. Qiu, Y. Qi, H. Lu, Z. A. Pardos, and N. T. Heffernan. Does time matter? modeling the effect of time with bayesian knowledge tracing. In EDM, pages 139–148, 2011.
© 2023 Copyright is held by the author(s). This work is distributed under the Creative Commons Attribution-NonCommercial-NoDerivatives 4.0 International (CC BY-NC-ND 4.0) license.