ABSTRACT
Revision behavior in adaptive writing support systems is an
important and relatively new area of research that can improve
the design and effectiveness of these tools, and promote
students’ self-regulated learning (SRL). Understanding how
these tools are used is key to improving them to better support
learners in their writing and learning processes. In this paper,
we present a novel pipeline with insights into the revision
behavior of students at scale. We leverage a data set of two
groups using an adaptive writing support tool in an educational
setting. With our novel pipeline, we show that the tool was
effective in promoting revision among the learners. Depending
on the writing feedback, we were able to analyze different
strategies of learners when revising their texts, we found that
users of the exemplary case improved over time and that
females tend to be more efficient. Our research contributes a
pipeline for measuring SRL behaviors at scale in writing
tasks (i.e., engagement or revision behavior) and informs
the design of future adaptive writing support systems for
education, with the goal of enhancing their effectiveness in
supporting student writing. The source code is available at
https://github.com/lucamouchel/Understanding-Revision-Behavior.
Keywords
1. INTRODUCTION
Intelligent writing support tools (e.g., Grammarly, WordTune or Quilbot) offer new ways for learners to receive feedback and thus revise their texts [19]. These and other writing support systems bear the potential to provide learners with needed adaptive feedback on their writing exercises when educators are not present, (e.g., on grammatical mistakes [32], argumentation [26], empathy [29], or general persuasive writing [27]). They can help students in their self-regulated learning (SRL) process [9, 36], to organize their thoughts and ideas, reflect on their learnings, or simply receive feedback on frequently occurring grammar or argumentation mistakes. From an educational perspective, it is important to understand how these tools are used by learners in educational settings and how they improve the effectiveness of educational scenarios [7, 18]. Present research is largely focused on designing and building writing support systems [8, 20]. However, there are not many insights into the effects of the usage of these tools and their impact on students’ SRL processes [4, 25], which is why we contribute a novel pipeline analyzing and visualizing revision behavior to better understand how we can design, develop and improve existing systems to better support students. Techniques from the field of data mining are a solution to understanding revision behavior and explaining SRL. One such technique is Keystroke Logging (KL). KL allows us to use educational data mining to analyze user behavior in writing tasks [16, 35, 23]1. In this study, we model, inspect, and analyze quantitative data in learners’ writing interactions through KL by developing a novel pipeline. We use a keystroke log from an experiment, where users were divided into two groups. The first one was given adaptive feedback and the second one was not. A detailed description of our dataset and the experiment demographics and procedure are available in Fig. 1. To the best of our knowledge, no publicly available pipeline exists that focuses on processing the keystroke behavior of learners and helps analyze SRL characteristics such as engagement, revision, or visualize the learning path. We intend to first identify and visualize the differences between these two groups in their revision process and compare different user profiles and measure their engagement over time. We use an exemplary data set to build this pipeline and apply data mining in order to gain insights into the underlying process of this writing activity.
2. BACKGROUND
Research on Automatic Data Mining for Writing Behaviour
Research in writing process analysis can be traced to the 1970s [10, 24]. However, only more recently have studies been focusing theoretically on behavioral and cognitive processes of writing [14, 17]. In fact, Flower and Hayes [11] laid the groundwork for research on the psychology of writing. They propose that the act of writing is propelled by goals, which are created by the writer and grow in number as the writing progresses. Today, writing support tools need to support this cognitive process as it emphasizes writers’ intentions, rather than their actions [12]. It is important to understand what these tools help with, and how we may design new ones [12]. While prior works on text revision [8, 15, 20, 28] have proposed machine collaborative writing interfaces, they focus on collecting human-machine interaction data to better train neural models, rather than understanding the underlying processes of text revision. Several studies in the past have used KL as a technique to study revision [16, 23, 35] in different settings and some of the aims were to understand and evaluate keystroke log features in a writing task context. However, until now, KL has been scarcely used in the classroom [25]. One issue with keystroke loggers is their invasive nature. KL raises several ethical issues, most notably privacy violation [25], but in this study, participants gave their consent for the collection of their data, all the while preserving their privacy. Previous research has suggested that writing time and number of keystrokes, which are indicative of general writing fluency and effort, are related to writing quality [1, 33]. Another feature of interest is pause times, [34] found that under a certain timed-writing test condition, shorter pauses are preferred as that indicates an adequate understanding of the task requirements, more familiarity with the writing topic, and better task planning [23].
Self-Regulated Learning
To analyze revision behavior, we rely on the lens of self-regulated learning (SRL). SRL refers to the pro-active process that learners engage in to optimize their learning outcome [36]. According to Zimmerman’s model of SRL [36], there are three major phases: forethought, performance and self-reflection. The forethought phase includes task analysis, such as goal setting and strategic planning and self-motivational beliefs. The performance phase includes self-control processes, such as task and attention-focusing strategies. The self-reflection phase includes processes involving self-judgment and self-reaction [31]. SRL is essential in the context of studying revision behavior in writing support systems as it allows writers to take an active role in identifying and addressing their own writing weaknesses, rather than simply relying on the writing support system to automatically detect and correct errors. This can lead to a deeper understanding of the writing process.
3. METHOD
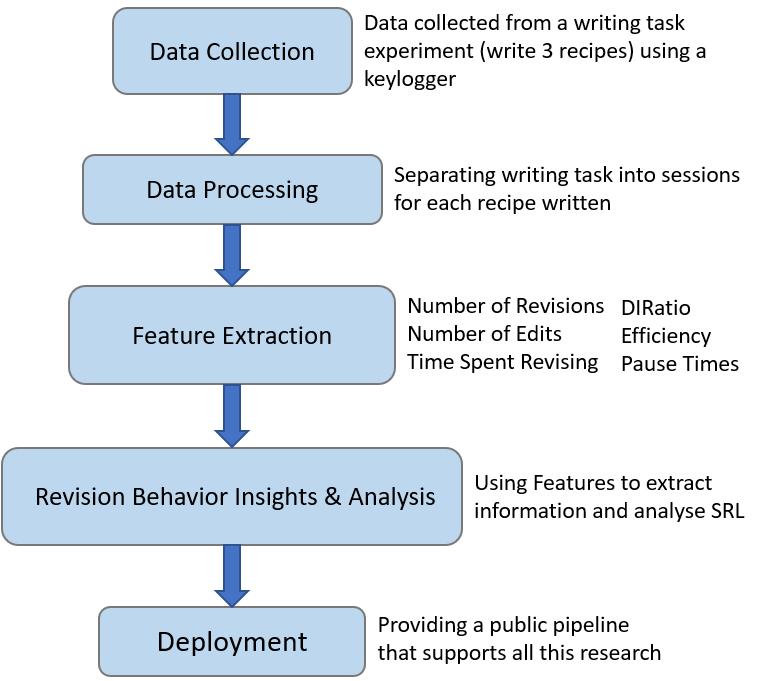
To investigate revision behavior in the writing process, we propose a pipeline for the automatic analysis of the SRL behavior of users during a writing task. Our work follows the Knowledge Discovery in Databases process by following the methodology in Fig. 1.
Demographics, Procedure & Dataset Description
With approval of the ethical board of our university, we collected data from a writing experiment which consisted of 73 users divided into two groups, as illustrated in Table 1.
The two groups of users were tasked with writing three
cooking recipes. Both groups were given a sample recipe as
reference. The first group (G1) received adaptive feedback
from the platform when they submitted their texts. The
second group (G2) did not receive any feedback. Once they
submitted their recipes to the system, users in G1 had the
option to reset and start a new recipe or revise their texts
based on the feedback. The same protocol was followed for
G2, but they did not receive feedback. Here are several
examples of the feedback the platform provided users: ’List
each ingredient separately.’, ’Enumerate the steps.’, ’How
can your recipe be more specific?’, ’Use stir, mix, or beat
instead of “add” to be more specific.’ or ’Indicate whether the
meat, poultry, or seafood is boned, skinned, or otherwise
prepared.’
With regards to the dataset, the entries of the log data we
collected consisted of user ids, event dates, the keystroke logs as
a JSON file and the final version of the text submitted at
that particular date. An example of an entry is as follows:
2023-01-01, 12:00:00, user1, [{’time’: 1, ’character’:
’a’}, ... }], "a) Cook ...".
Qualitative Perception
Following the experiment, users were tasked with answering
follow-up questions and we identified eight different topics
regarding the reported revisions, including, adding missing
ingredients, improving the clarity, not making any changes and
others. To do this, we used BERTTopic [13], a topic modeling
technique that clusters sentence embeddings generated by
Sentence-BERT [22], to perform qualitative analysis of
participants’ open responses about recipe revisions: (What did
you edit (add, remove or change) from the original text (the
recipe you wrote)?). We split the sentences into clusters based
on their relevance, assigned names to each cluster, and
computed the probability of each sentence belonging to a
cluster. We grouped the sentences by participant to obtain the
set of topics associated with their entire text answer. For
example, if a participant’s answer consisted of sentences with
assigned topics \(A\), \(B\), and \(C\), the set of topics associated with their
answer would be \(Z = \{A, B, C\}\).
Data Processing
Given that the logs consist of the users’ first attempts at writing one of the three recipes and their respective revision phases, it is important to separate them in order to focus only on the revision steps. We define sessions for a user as all the data collected from them for one recipe. To separate sessions, we use cosine distance to detect where the session ends and where the next one starts. One advantage of using cosine distance for text comparison is that it is relatively insensitive to the length of the strings. In contrast, other measures of distance such as Euclidean distance are sensitive to the length of the vectors and can be affected by the presence of common words that do not contribute significantly to the meaning of the strings. To map sentences to 50-dimensional vectors, we use a GloVe model [21], which is already trained on Wikipedia. First, we map each word to their embeddings and then compute the sum of the vectors component-wise. Formally, each text submitted \(t\) has a set of words \(\mathcal {W} = \{w_i\; |\; 1 \leq i \leq N_t\}\), where \(N_t\) is the number of words for text \(t\). Then, we map each \(w_i\) to their embeddings \(\tilde w_i\) which are 50-dimensional vectors. Now let \(\tilde {t}\) be the embedding of the text \(t\), then \(\tilde {t}= \sum _{i=1}^{N_t} \tilde w_i\). This allows us to capture each word of the text and this way, we can collect the set of all text embeddings in the dataset \(\mathcal {T} = \{\tilde t_1, \tilde t_2, ...\} = \left \lbrace \sum _{i=1}^{N_1} \tilde w_i, \sum _{i=1}^{N_2} \tilde w_i, ...\right \rbrace \). We use \(\mathcal {T}\) to run the recursive algorithm described in Section C on the recipes submitted and compute the cosine distance between the text embeddings of \(t_k\), \(t_{k+1}\), \(...\), starting at \(k=0\), until we find \(n>k\) \[1-\frac {\langle \tilde t_k, \; \tilde t_n \rangle }{\lVert \tilde t_k\rVert \cdot \lVert \tilde t_n \rVert } < 0.995\] When we do, we define \(n\) as the index of a new recipe in our data. Then, we repeat the process by starting at \(t_n\) and comparing \(\tilde t_{n}\) with the text embeddings \(\tilde t_{n+1}, \tilde t_{n+2}, ...\) to find the next index. This way, we collect the indices of new recipes in our dataset so that we can focus on the revision between these indices.
Moreover, to apply process mining techniques, we built event logs from the writing task. For each group, we collect the activities for each user, by looking at when they submit the first, second and third recipes and all the revision steps in between.
Feature Extraction
Different aspects of SRL have been researched extensively [18]. In a meta-analysis on online education, [6] found significant associations with academic achievement for five sub-scales of SRL: effort regulation (persistence in learning), time management (ability to plan study time), metacognition (awareness and control of thoughts), critical thinking (ability to carefully examine material), and help-seeking (obtaining assistance if needed)2. Based on these findings, we use the following dimensions to represent student behavior: effort regulation (Number of Revisions, Number of Edits, Time Spent Revising), time management (Time Spent Revising, Pause Times), metacognition (Efficiency, Pause Time), and critical thinking (DIRatio). A detailed description of these feature variables can be found in Section A, Table 3.
Building the Learning Path
Understanding revision behavior implies understanding the underlying process in the writing task (e.g., how long do users in a group take to revise on average or how many users revise). In order to understand this better, process mining, especially process discovery [5], can help us model and visualize the writing process for users in a group and design a learning path when using adaptive writing support systems [30]. In this study, we use Directly-Follows Graphs (DFGs) [3], which represent activities and their relationships3. This is useful for the field of SRL as it provides a way to visualize and analyze the steps involved in a process, especially revision. A formal definition of DFGs can be found in Section B.
4. RESULTS
Revision Strategies
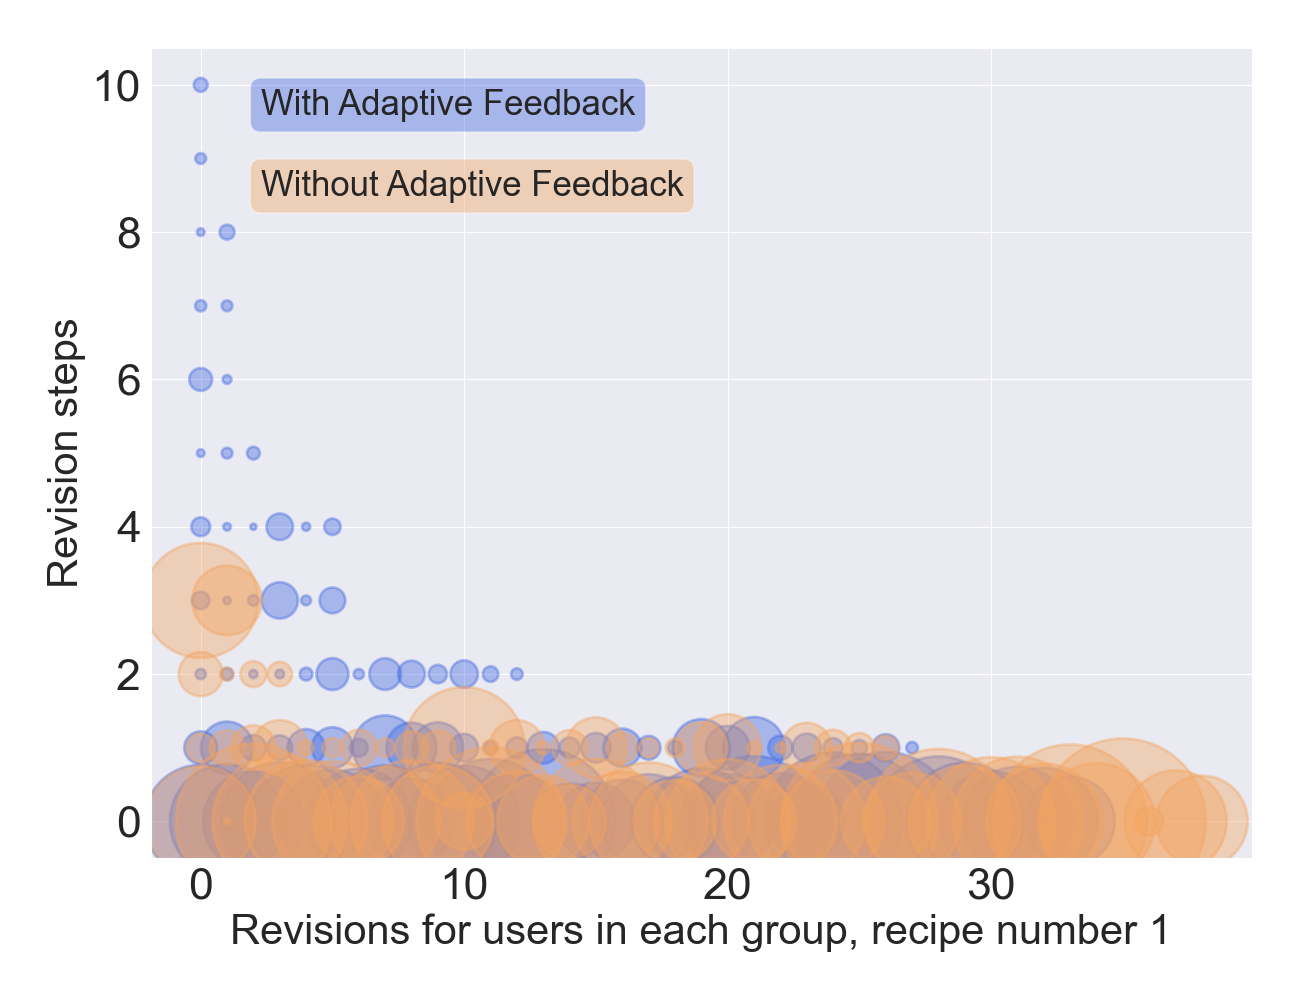
With this study, we find that users in different groups revise
their texts differently. Recall that G1 is given adaptive feedback
and G2 is not. By providing insightful feedback on what a user
can change in their writing, users tend to have more revision
steps with fewer edits at each step. However, users not receiving
feedback follow the opposite trend, they have fewer revision
steps, with a larger number of revisions at each step. This
phenomenon is visible in Fig. 2. In fact, for the first and
second texts (Section D, Tables 4 and 5), we find \(p\)-values <
0.05 for Number of Revisions using \(t\text {-tests}\), which indicates a
significant difference in the number of revisions. This is also
underlined by the mean number of revisions and edits. On
average, users in G1 tend to revise their texts more often,
with fewer edits at each step (Section D, Tables 4 to 6).
From the directly-follows graphs (Fig. 3), we see that users
spend approximately the same amount of time writing recipes
and the same amount of time revising at the first revision step.
However, we see that users in G2 revise much longer when
having consecutive revision sessions (6 min on average)
compared to G1 (56 s)(Fig. 3). This confirms that users in G1
have shorter revision sessions, whereas users in G2 have longer
revision steps.
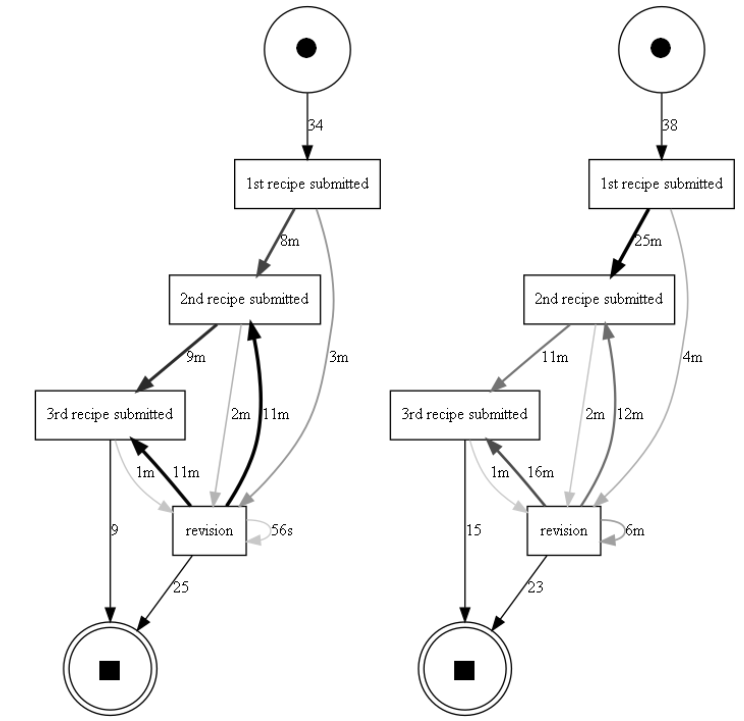
G1 (left) and G2
(right) automatically calculated and drawn by our pipeline
Engagement
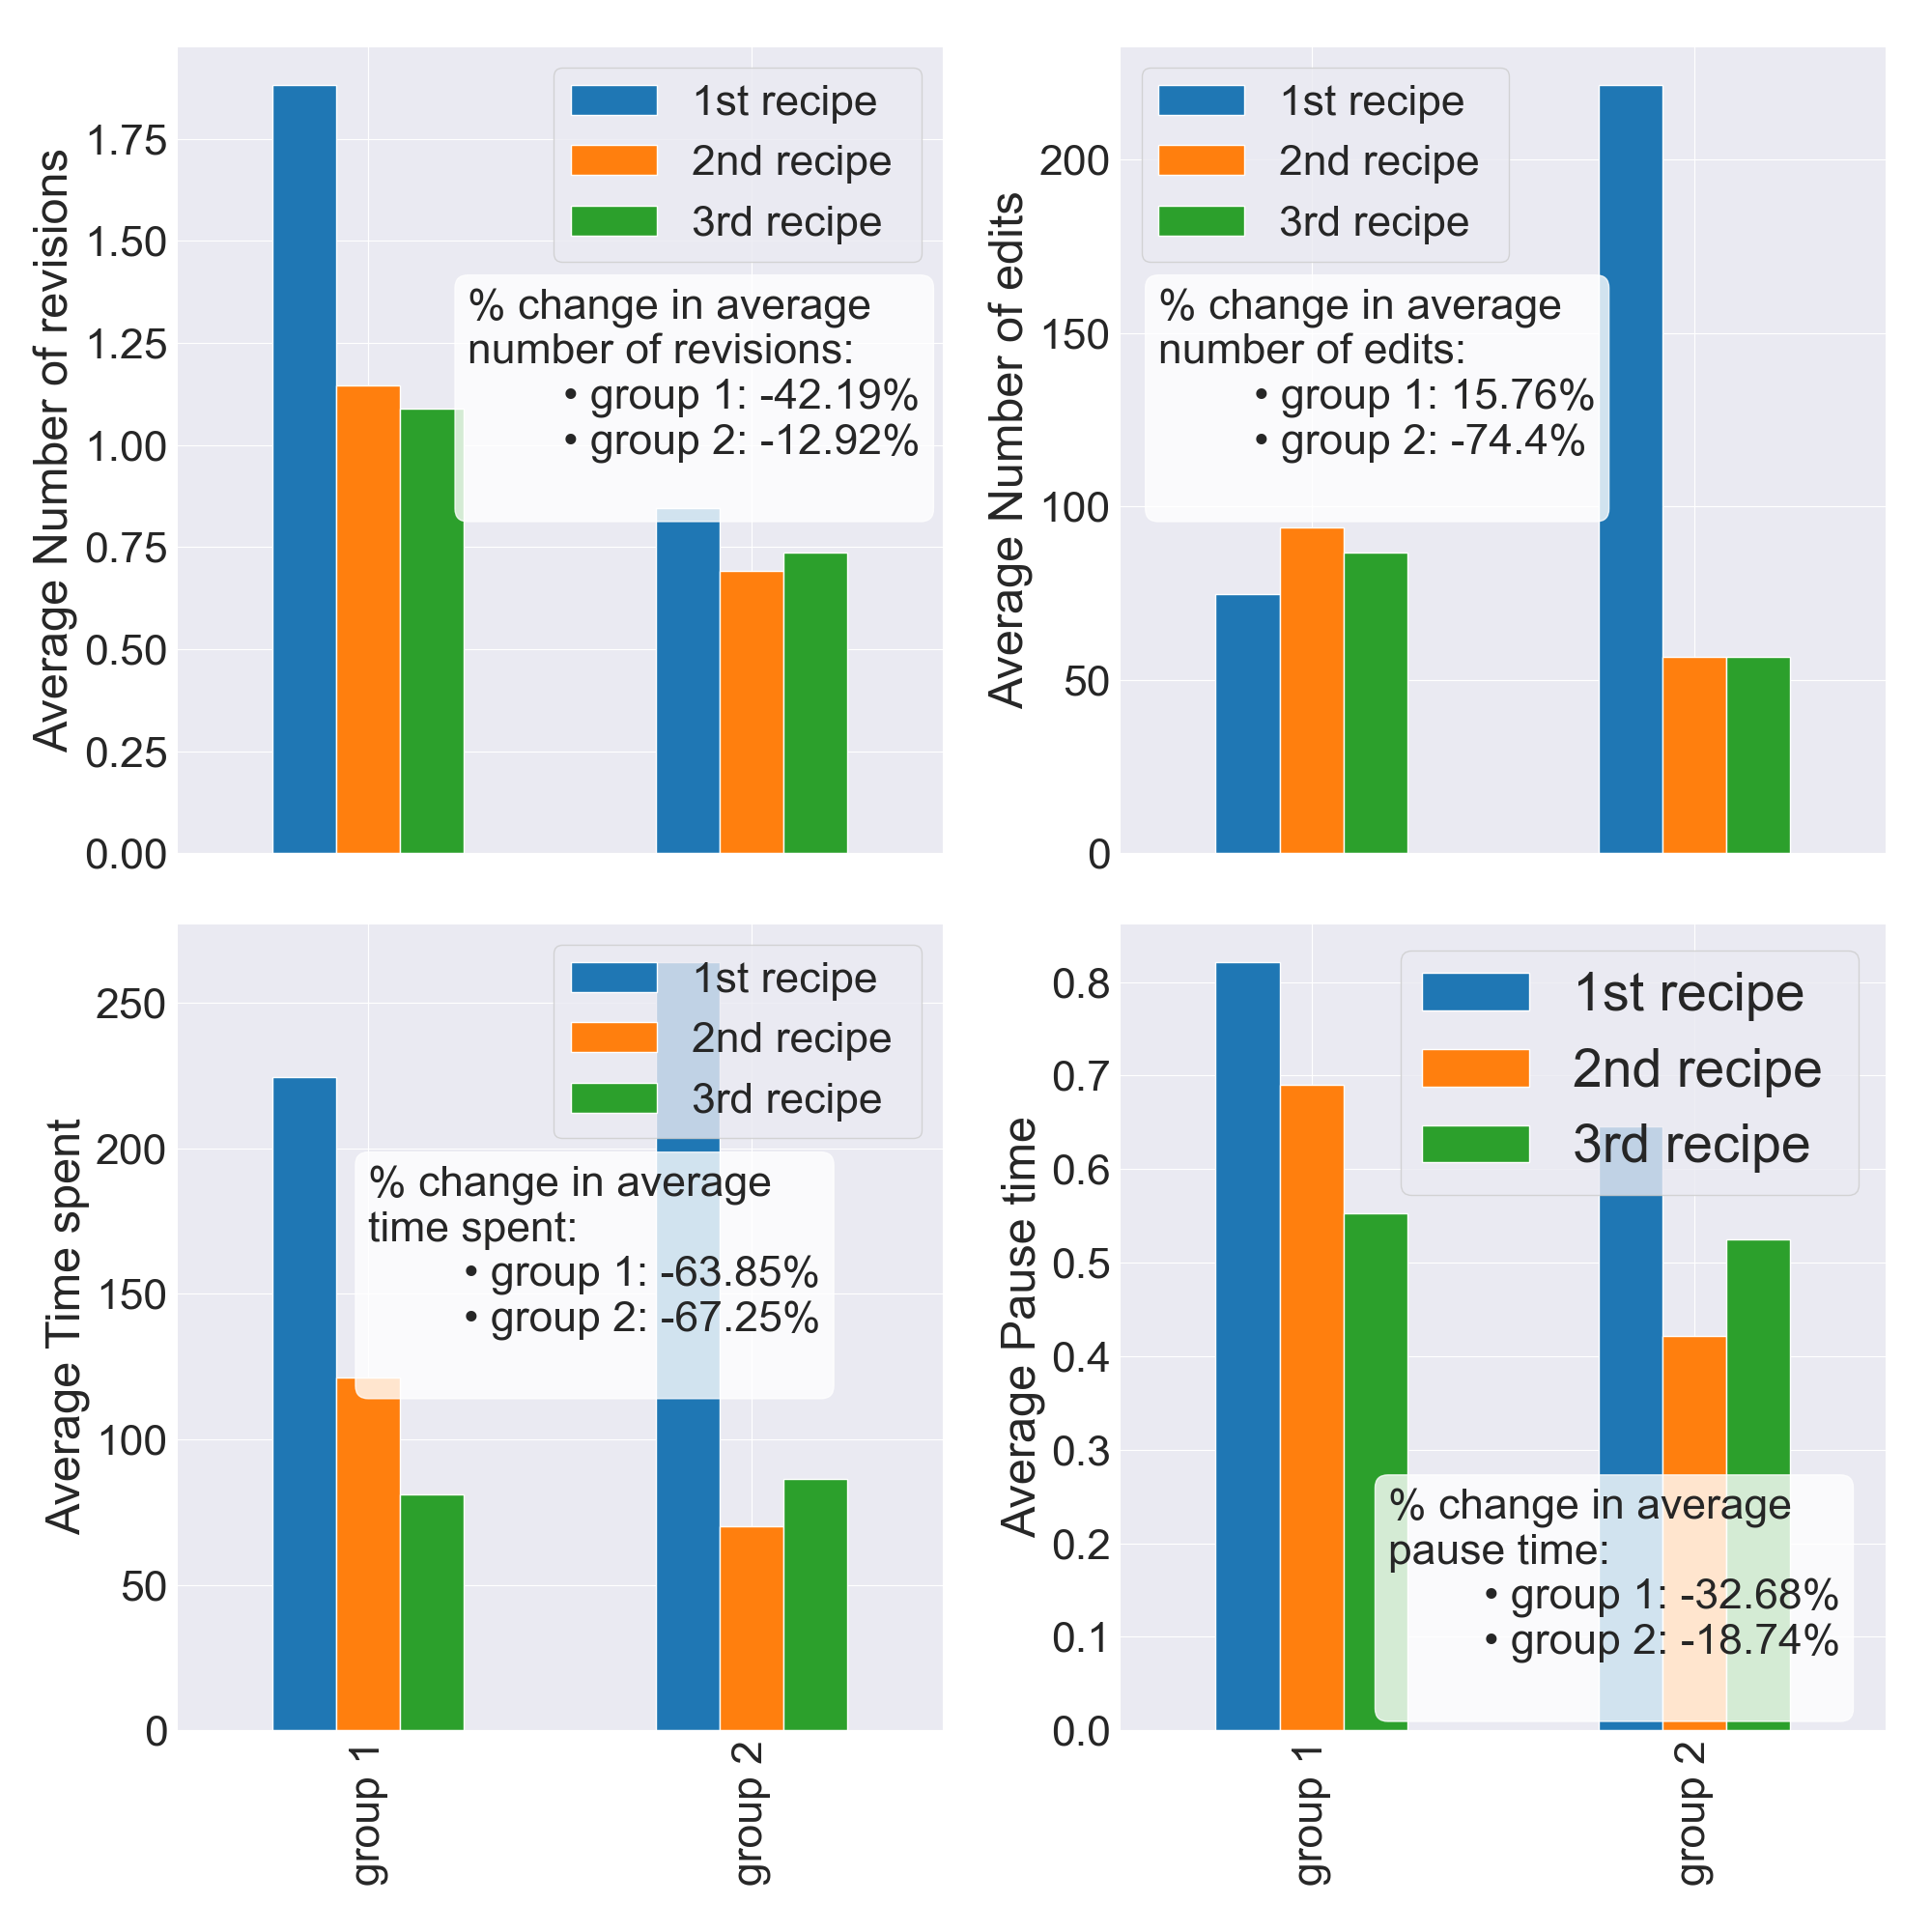
From the second recipe onwards, we find that users revise less
often, perform fewer edits, spend less time revising and type
faster (Fig. 4). This stems from users being less engaged in the
task at hand. In fact, users spend 67% less time revising in G2
(Fig. 4) (from 264 seconds on average for the first recipe to 86.5
seconds for the third one (Tables 4 and 6)) and 64% less in G1
(from 224 seconds to 81.2). In G2, users perform 74% fewer
edits between the first and last recipe (Fig. 4). Users in G2
performed on average 222 edits when revising for the first
recipe and only 57 for the third one (Tables 4 and 6). The
decrease in pause time for the two groups also declines
over time (0.822 to 0.553 seconds on average for G1 and
0.646 to 0.525 seconds for G2), even though participants in
G2 consistently maintain a smaller average pause time
when revising. This is one interpretation of the results and
Fig. 4, another one would be to consider users are improving
in this task. On average, pause time for G1 decreased by
32.7% and 18.7% for G2 (Fig. 4). Shorter pause times
indicate better understanding of the task requirements
and better task planning [34]. This is coherent with the
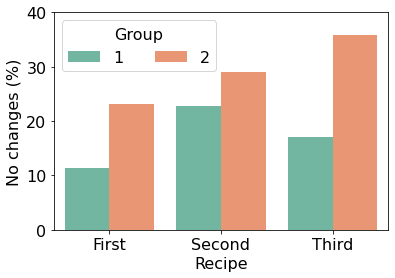
participants’ reported changes. As seen in Fig. 5, we found that
participants from G2 increasingly reported making no changes
to their recipes (36% for the third recipe). In contrast,
participants in G1 continued reporting making changes based
on the received adaptive feedback. Nevertheless, there
was also an increase in the participants in G1 that did
not edit the recipe, one participant noted I didn’t edit as
much this time as I remembered to add them the first time
around.
Gender Comparison
Research has often found that males tend to be more impaired
at composing text in comparison with women. The study in [35]
found that female students performed better than male students
on a number of levels. Females had higher scores, revised more,
and were more efficient: they revised more per unit of time,
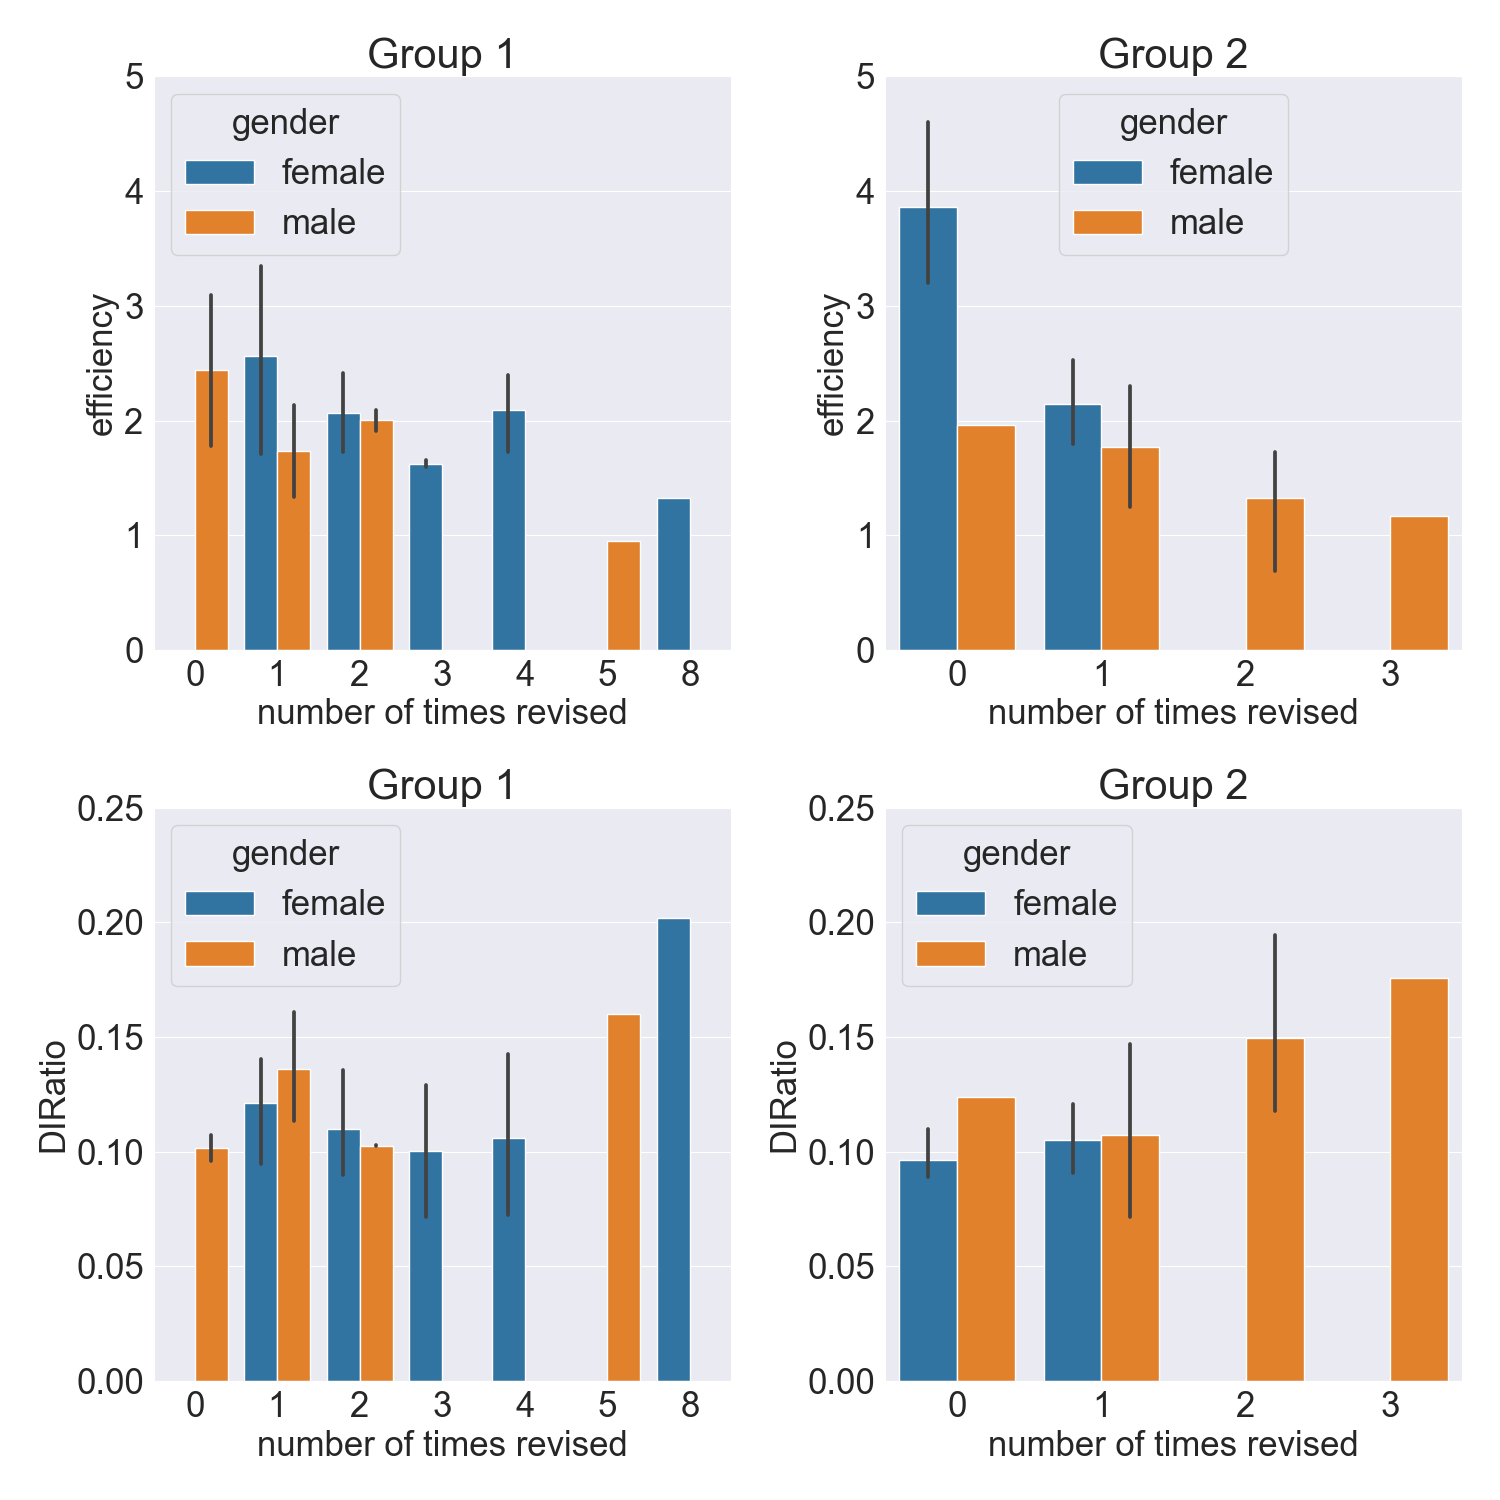
exhibiting greater writing fluency. In this study, we found that
there is a clear distinction in the writing capabilities between
males and females. Like [35], we find females are more
efficient in this writing task. They tend to have higher
efficiency scores (Fig. 6) and we find \(p=0.0038\) when comparing
efficiency scores in G2 (Table 2), which demonstrates the
disparity in efficiency distribution between the two groups.
Curiously, males revise less often when receiving feedback
(as seen on the x-axis by the number of times revised,
(Fig. 6)4).
On the contrary, when users do not receive feedback, females
revise once at most (because index 0 is not a revision phase,
Fig. 6). This also reinforces women’s abilities in their writing,
suggesting they feel less need for revision if they do not receive
feedback on what they can improve. Regarding the Delete-Insert
ratio (DIRatio), although we find there is no statistical
difference (Table 2), we find that males in G2 generally have
higher scores, especially in G2. Having higher DIRatio scores
means users delete a larger portion of their texts (over
15% for several male users in G2, Fig. 6). Looking back at
SRL, especially on the critical thinking aspect [6], which
is defined as the ability to examine material, we can see
males are more self-critical and delete a larger portion of
their texts compared to females when they do not receive
feedback.
5. DISCUSSION & CONCLUSION
With this research, we contribute to the field of understanding
the use of intelligent writing systems by learners. We do this by
gaining insights into their SRL by inspecting revision behavior.
From the log data we collected, we built and modelled a pipeline
to analyze and visualize user behavior in the revision phases of
the writing task, by observing different features extracted from
the revisions of G1 (with adaptive feedback) and G2 (without
adaptive feedback)(Figs. 2, 4 and 6). Our analysis revealed that
learners in different groups revise using different strategies.
Learners who were equipped with adaptive feedback revised
more often, with fewer edits at each revision step and users
without adaptive feedback followed the opposite trend. This
suggests that the support provided by the system may
influence revision behavior and how it is used. Additionally, we
found users seemed to be improving in the writing task as
demonstrated by the post-survey and the data, even though
they seem to be less engaged from the evolution of the feature
variables in Fig. 4. Finally, we concluded females were
more efficient than males in this experiment, by having
higher efficiency scores. While there has been research
on the effectiveness of such systems in improving writing
skills, there is a limited understanding of how users revise
their writing when using these tools. To evaluate users’
SRL, it is crucial to have a better understanding of how
they self-regulate, especially in writing activities, in order
to provide them with the correct tools to improve their
writing skills and understand the underlying writing process
[4, 31].
Regarding future directions, one can focus on clustering revision data in order to gain further insights into the revision behavior in a writing task. We have already done this, by identifying eight reported revisions, including adding more details, changing the structure, improving the clarity or not making any changes. Nevertheless, we focus on not making any changes, but analyzing other revision reports could help shed light on more differences between the groups. As such, clustering could be used for each group to identify the differences between the two groups or between learners in the same group, to see how users revise when receiving feedback or not.
In conclusion, our research on revision behavior in adaptive writing support systems has shed light on how users in different groups approach revision. The development of a pipeline to study this topic has allowed us to collect and analyze data on user writing and revision activity, leading to the discovery of important patterns and trends. Overall, our study has made a significant contribution to the field by providing a deeper understanding of revision behavior.
6. REFERENCES
- L. K. Allen, M. E. Jacovina, M. Dascalu, R. D. Roscoe, K. M. Kent, A. D. Likens, and D. S. McNamara. Entering the time series space: Uncovering the writing process through keystroke analyses. International Educational Data Mining Society, 2016.
- A. Augusto, M. Dumas, M. La Rosa, S. Leemans, and S. vanden Broucke. Optimization framework for dfg-based automated process discovery approaches. Software and Systems Modeling, 20:1–26, 08 2021.
- A. Berti, S. J. van Zelst, and W. M. P. van der Aalst. Process mining for python (pm4py): Bridging the gap between process-and data science. CoRR, abs/1905.06169, 2019.
- R. A. Bjork, J. Dunlosky, and N. Kornell. Self-regulated learning: Beliefs, techniques, and illusions. Annual review of psychology, 64:417–444, 2013.
- A. Bogarín, R. Cerezo, and C. Romero. A survey on educational process mining. Wiley Interdisciplinary Reviews: Data Mining and Knowledge Discovery, 8, 09 2017.
- J. Broadbent and W. L. Poon. Self-regulated learning strategies & academic achievement in online higher education learning environments: A systematic review. The Internet and Higher Education, 27:1–13, 2015.
- X. Chen, L. Breslow, and J. DeBoer. Analyzing productive learning behaviors for students using immediate corrective feedback in a blended learning environment. Computers Education, 117:59–74, 2018.
- A. Coenen, L. Davis, D. Ippolito, E. Reif, and A. Yuan. Wordcraft: a human-ai collaborative editor for story writing. CoRR, abs/2107.07430, 2021.
- J. de la Fuente, J. M. Martínez-Vicente, F. H. Santos, P. Sander, S. Fadda, E. Karagiannopoulou, E. Boruchovitch, and D. F. Kauffman. Advances on self-regulation models: A new research agenda through the sr vs er behavior theory in different psychology contexts. Frontiers in Psychology, 13, 2022.
- J. Emig. The composing processes of twelfth graders. 1971.
- L. Flower and J. R. Hayes. A cognitive process theory of writing. College Composition and Communication, 32(4):365–387, 1981.
- K. Gero, A. Calderwood, C. Li, and L. Chilton. A design space for writing support tools using a cognitive process model of writing. In Proceedings of the First Workshop on Intelligent and Interactive Writing Assistants (In2Writing 2022), pages 11–24, Dublin, Ireland, May 2022. Association for Computational Linguistics.
- M. Grootendorst. Bertopic: Neural topic modeling with a class-based tf-idf procedure. arXiv preprint arXiv:2203.05794, 2022.
- J. R. Hayes. Modeling and remodeling writing. Written communication, 29(3):369–388, 2012.
- M. Lee, P. Liang, and Q. Yang. CoAuthor: Designing a Human-AI Collaborative Writing Dataset for Exploring Language Model Capabilities. arXiv e-prints, page arXiv:2201.06796, Jan. 2022.
- M. Leijten and L. Van Waes. Keystroke Logging in Writing Research: Using Inputlog to Analyze and Visualize Writing Processes. Written Communication, 30(3):358–392, July 2013. Publisher: SAGE Publications Inc.
- D. McCutchen. A capacity theory of writing: Working memory in composition. Educational psychology review, 8(3):299–325, 1996.
- P. Mejia-Domenzain, M. Marras, C. Giang, and T. Käser. Identifying and comparing multi-dimensional student profiles across flipped classrooms. In Artificial Intelligence in Education: 23rd International Conference, AIED 2022, Durham, UK, July 27–31, 2022, Proceedings, Part I, page 90–102, Berlin, Heidelberg, 2022. Springer-Verlag.
- M. Nova. Utilizing grammarly in evaluating academic writing: A narrative research on efl students’ experience. Premise: Journal of English Education and Applied Linguistics, 7(1):80–96, 2018.
- V. Padmakumar and H. He. Machine-in-the-loop rewriting for creative image captioning. CoRR, abs/2111.04193:573–586, 2021.
- J. Pennington, R. Socher, and C. D. Manning. Glove: Global vectors for word representation. In Proceedings of the 2014 conference on empirical methods in natural language processing (EMNLP), pages 1532–1543, 2014.
- N. Reimers and I. Gurevych. Sentence-bert: Sentence embeddings using siamese bert-networks. In K. Inui, J. Jiang, V. Ng, and X. Wan, editors, Proceedings of the 2019 Conference on Empirical Methods in Natural Language Processing and the 9th International Joint Conference on Natural Language Processing, EMNLP-IJCNLP 2019, Hong Kong, China, November 3-7, 2019, pages 3980–3990. Association for Computational Linguistics, 2019.
- S. Sinharay, M. Zhang, and P. Deane. Prediction of Essay Scores From Writing Process and Product Features Using Data Mining Methods. Applied Measurement in Education, 32(2):116–137, Apr. 2019. Publisher: Routledge _eprint: https://doi.org/10.1080/08957347.2019.1577245.
- C. K. Stallard. An analysis of the writing behavior of good student writers. Research in the Teaching of English, 8(2):206–218, 1974.
- N. Vandermeulen, M. Leijten, and L. Van Waes. Reporting writing process feedback in the classroom using keystroke logging data to reflect on writing processes. Journal of Writing Research, 12(1):109–139, 2020.
- T. Wambsganss, A. Janson, and J. M. Leimeister. Enhancing argumentative writing with automated feedback and social comparison nudging. Computers Education, 191:104644, 2022.
- T. Wambsganss, T. Kueng, M. Söllner, and J. M. Leimeister. Arguetutor: An adaptive dialog-based learning system for argumentation skills. Proceedings of the 2021 CHI Conference on Human Factors in Computing Systems, 2021.
- T. Wambsganss, C. Niklaus, M. Cetto, M. Söllner, S. Handschuh, and J. M. Leimeister. AL: an adaptive learning support system for argumentation skills. In Proceedings of the 2020 CHI Conference on Human Factors in Computing Systems, pages 1–14.
- T. Wambsganss, C. Niklaus, M. Söllner, S. Handschuh, and J. M. Leimeister. Supporting cognitive and emotional empathic writing of students. In The Joint Conference of the 59th Annual Meeting of the Association for Computational Linguistics and the 11th International Joint Conference on Natural Language Processing (ACL-IJCNLP 2021), volume abs/2105.14815, 2021.
- T. Wambsganß, A. Schmitt, T. Mahnig, A. Ott, N. Ngo, J. Geyer-Klingeberg, J. Nakladal, and J. M. Leimeister. The potential of technology-mediated learning processes: A taxonomy and research agenda for educational process mining. 10 2021.
- J. Wong, M. Baars, B. B. de Koning, and F. Paas. Examining the use of prompts to facilitate self-regulated learning in massive open online courses. Computers in Human Behavior, 115:106596, 2021.
- Z. Yuan. Grammatical error correction in non-native English. Technical Report UCAM-CL-TR-904, University of Cambridge, Computer Laboratory, Mar. 2017.
- M. Zhang, J. Hao, C. Li, and P. Deane. Classification of writing patterns using keystroke logs. In L. A. van der Ark, D. M. Bolt, W.-C. Wang, J. A. Douglas, and M. Wiberg, editors, Quantitative Psychology Research, pages 299–314, Cham, 2016. Springer International Publishing.
- M. Zhang, D. Zou, A. Wu, P. Deane, C. Li, B. Zumbo, and A. Hubley. An investigation of the writing processes in timed task condition using keystrokes. Understanding and investigating response processes in validation research, pages 321–339, 2017.
- M. Zhu, M. Zhang, and P. Deane. Analysis of Keystroke Sequences in Writing Logs. ETS Research Report Series, 2019(1):1–16, 2019. _eprint: https://onlinelibrary.wiley.com/doi/pdf/10.1002/ets2.12247.
- B. Zimmerman. Becoming a self-regulated learner: An overview. Theory Into Practice, 41:64–70, 06 2002.
APPENDIX
A. FEATURES
Table 3 gives a detailed description of the features we study in this paper, extracted in our pipeline.
| Feature Variables | Description |
|---|---|
| Number Of Revisions | For each user, we count the amount of times they revise each time they write a recipe (i.e., when they submitted then re-edited their texts). This gives a sense of the effort put into the revision phase of the writing task. |
| Number of edits | The total number of insertions and deletions during a revision step. Insertions are counted as any characters that are typed including whitespaces, and deletions are counted as the number of times the user presses any of the Backspace or Delete buttons. |
| Time Spent Revising in seconds | We compute the average time users spend revising for each group, for each recipe. This allows us to compare the two groups and to estimate the effort put in by both groups. |
| Delete-Insert Ratio (DIRatio) | The average deletions over insertions ratio, which approximately captures the extent of editing and revision of any kind [35]. |
| Efficiency | Estimated by the number of insertions per second, which indicates a general writing speed. This feature is arguably an indicator of writing fluency [35]. |
| Pause Time during Revision in seconds | For each user, we collect the inter-key time interval and compute the mean of these intervals. This captures the average lag time between two adjacent keystroke actions [35]. This feature captures the effort and persistence level of users. |
B. DIRECTLY-FOLLOWS GRAPHS
In process mining, a Directly-Follows Graph is a directed graph that represents the sequence of activities in a process based on event logs. Formally, given a set of activities \(\mathcal {A}\), an event log \(\mathcal {L}\) is a multiset of traces \(t\in \mathcal {L}\), where \(t\) is a sequence of activities \(t=(a_1, a_2,\;..., a_n)\), with \(a_i\in \mathcal {A}\) \(1\leq i \leq n\) [2]. Given the event log \(\mathcal L\), the DFG \(\mathcal G\) is a directed graph such that \(\mathcal {G} = (V,E)\). \(V\) is the set of activities in \(\mathcal {L}\): \(V = \{a\in \mathcal {A}\;|\; \exists t\in \mathcal {L} \land a \in t \}\). \(E\) is defined as \(E=\{(u,v) \in V\times {V}\;|\; \exists t =(a_1, a_2, ..., a_n), \; t\in \mathcal {L} \; \land \; a_i = u \; \land \; a_{i+1}\}\) [2].
C. SEPARATING WRITING SESSIONS
Algorithm 1 describes our implementation of session separation. Each participant wrote a first version of their recipes, then revised it, before starting the next recipes. To focus on the revision sessions, we needed to implement a function which captures the indices in the dataset where participants started their recipes. First, we preprocess the submitted text by removing noisy characters, such as punctuation and return the list of sanitized words. Then we use the GloVe model to convert the words to vectors and return one 50-dimensional vector which is the sum of each word embedding. Then we recursively find the indices of new recipes using cosine distance. However, the algorithm is 91% accurate: this is because sometimes users submitted random strings or the revisions led to the algorithm detecting another recipe. We adjusted the missing indices by hand by looking at the dataset.
![Algorithm 1: Separating writing sessions using cosine dis-
tance
function separateSessions
model ← GloVeModel
function getVector (text)
p← preProcess(text) splits and sanitizes text
arr ← Initialize an empty list
for word∈ p do
enda fdodr model[word] to arr if word ∈ model
return np.sum(arr,axis= 0) uses numpy
end function
function computeIndices(startIndex,accumulator)
recipes← retrieve recipes from the dataset
size ← the total number of recipes
if starerttuIrnnd aexcc≥umsuizlea−tor1 then
end if
vec← getVector (recipes[startIndex])
for n← startIndex to size do
d← 1− cosineDist(vec,getVector(recipes[n]))
if d < 0.995 then
add n to the accumulator
endreifturn computeIndices(n, accumulator)
end for
end function
return computeIndices(0, empty accumulator)
end function](./tmp-make4ht1x.svg)
D. RESULTS
Detailed Results
Tables 4 to 6 report the mean, standard deviation of different feature variables for both groups, as well as \(p\)-values.
1Tools such as InputLog [16] or ETS [35] are examples of KL programs.
2The nature of our log data does not allow to represent help-seeking.
3Other data structures like Petri Nets could also be used. Petri Nets are commonly used to apply process mining [3].
4Some outliers were removed (e.g., users who spent over 10’000 seconds revising or users who have very low efficiency scores (few edits over a long period of time)).
© 2023 Copyright is held by the author(s). This work is distributed under the Creative Commons Attribution-NonCommercial-NoDerivatives 4.0 International (CC BY-NC-ND 4.0) license.