ABSTRACT
In this study, we analyze data from the National Assessment of Education Progress (NAEP) digital test to understand how digital tool usage relates to the efficiency of answering questions. Digital testing software provides students with on-screen tools such as calculators and scratchpads. We found that students who used digital tools in NAEP were slower in solving the problems but more accurate when the question demanded using the tool. We also found that when students used the tool when it was not needed, they were more likely to be incorrect. Overall, our findings suggest that students need to be trained on how to use the tools and when to use them to make the most use of their testing time.
Keywords
1. INTRODUCTION AND PRIOR WORK
The study focuses on the relationship between on-screen tool usage and the efficiency of students. The software used for online testing typically provides tools such as scratchpads and calculators to the students to help them think, and solve problems. Students’ usage patterns of these tools can help us model their behavior and help instructors to help students identify tool usage. Data from the NAEP (National Assessment of Educational Progress) used by the US Govt, was used. Computer-based tests are now standard in large-scale assessments.
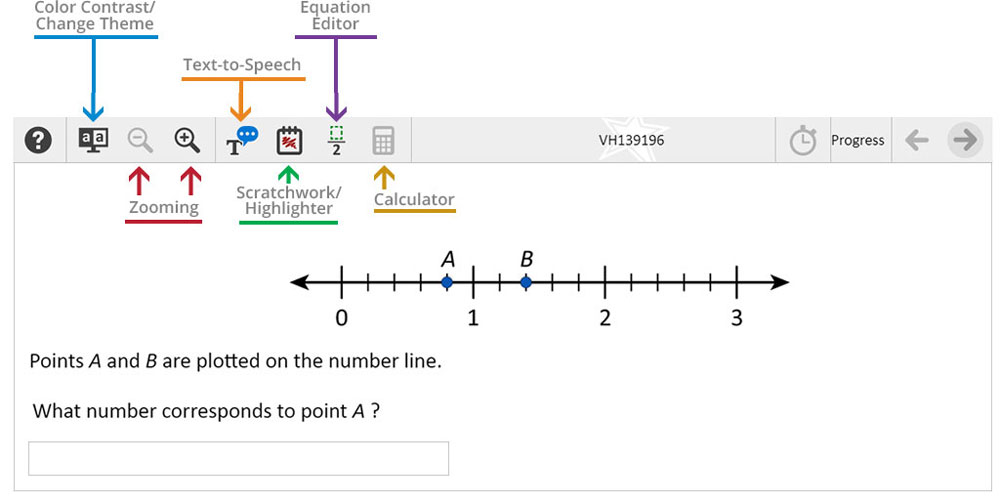
To ensure the digital competency of the test taker [1, 4] students are subjected to lab-based studies where they are recorded while interacting with the assessment interface [2]. NAEP test provides some tools for the students to aid in problem-solving. Students are provided with quick training before the test starts. Two key tools in the NAEP test are Calculator and Scratchpad. All students in the NAEP test have access to a physical calculator (they are given one if they don’t bring their own), and students can also request pencils and scratch paper if needed. The NAEP UI (shown in Figure 1) also has a digital Calculator and a digital Scratchpad that substitute for their physical versions.
Efficient test-takers show distinct digital patterns in the log data. Sahin used Latent Profile Analysis to look at how students allocated times to different test items in the NAEP [5]. They discovered four distinct groups in their sample that they described as 1) little time on the first (problem) visit, 2) balanced time (across problem visits and revisits), 3) little revisit with more time in the end, and 4) little revisit with less time in the end. The researchers found that these four groups differed in the average outcomes, with group 4 scoring the lowest (pg. 21, ibid). Another recent study [3] showed that in the NAEP test, students were more likely to use the digital calculator on calculation-heavy items. When it was used in an ideal way, students were also likely to score higher.
We analyzed the process data from the 2018 NAEP test and compared the students who did not use digital on-screen tools with the ones who did. All students in the NAEP test had access to physical tools, so we wanted to understand student preferences in using digital tools. In our analysis, we compared the time taken by students who used digital tools with those who did not.
2. DATA
We used a random sample from the 2018 NAEP Mathematics test for Grade 8. Our sample had data N = 1642 students. The digital Math assessment consists of two 30-minute blocks, and our sample had data from the first block. There were a total of 20 questions in the first block. The entire test-taking process of the students was captured by collecting data points for each interaction event. Each student interaction in the digital assessment system resulted in one observation in the dataset. Each observation had seven different variables. They are listed in Table 1 below.
| Variable | Description |
|---|---|
| STUDENTID | Unique identifier of the student |
| Block | Block of the NAEP test, A or B |
| AccessionNumber | Unique identifier of the question that the student is attempting |
| ItemType | Type of the question e.g. MCQ, Fill in the Blank, etc. |
| Observable | The name of the action that student took e.g. clicking, dragging, scrolling, typing, opening a calculator |
| ExtendedInfo | Metadata of the student action |
| EventTime | Time when the student interaction occurred |
There were forty-two unique types of actions (Observable column in the data). These actions were further coded by us into six different categories: Answer (responding to the item), Navigation (switching between items), Timer (looking at the remaining time), Calculator (using the digital calculator), Scratchpad (using the digital scratchpad), Equation Editor (using the equation editor), and Readability (adjusting the readability of the on-screen text). We considered Calculator, Scratchpad, and Equation Editor as Digital Tools. We calculated the time students spent doing each type of action, and the combined time students spent using Digital Tools on a question, used to categorize them into tool users and non-tool users. The non-tool users had no tool used for a given question, while the tool users had one or more events related to the digital tools. Once the students were categorized for their tool usage for each question, we compared the two groups for each question, in how quickly they responded to the question items.
We had accuracy data available for eight multiple-choice questions, calculated by looking at the latest option clicked by the students and comparing it with the answer key. Further, the accuracy data was used to compare students who did and did not use the digital tools.
3. RESEARCH QUESTIONS AND METHOD
Our objective was to understand how students who used the on-screen tools differed from those who did not. We wanted to know whether students who used the digital tools were faster at responding to the test items. We also wanted to understand whether the tool usage behavior was different across items and if there were any differences in the proficiency of the students using the tools versus not using the tools.
- RQ1: What are the differences in item response times for the students who use the digital tools versus those who do not?
- RQ2: Are the tool usage preferences similar or different across question items?
- RQ3: Are there any differences in the scores of students who can identify tool usage correctly compared to those who don’t?
For RQ1, we used the t-Test to compare the item response times of the groups of students who used the digital tools and those who did not. For RQ2, for each question, we compared the number of students who used digital tools for answering it with those who did not use the tools. Given that we had a random sample from the test, we expected that the student preference seen in our data would generalize to the target population. To answer RQ3, we used correctness data from the multiple choice questions of the test and calculated what proportion of the students using the tools were getting the items correct.
4. RESULTS
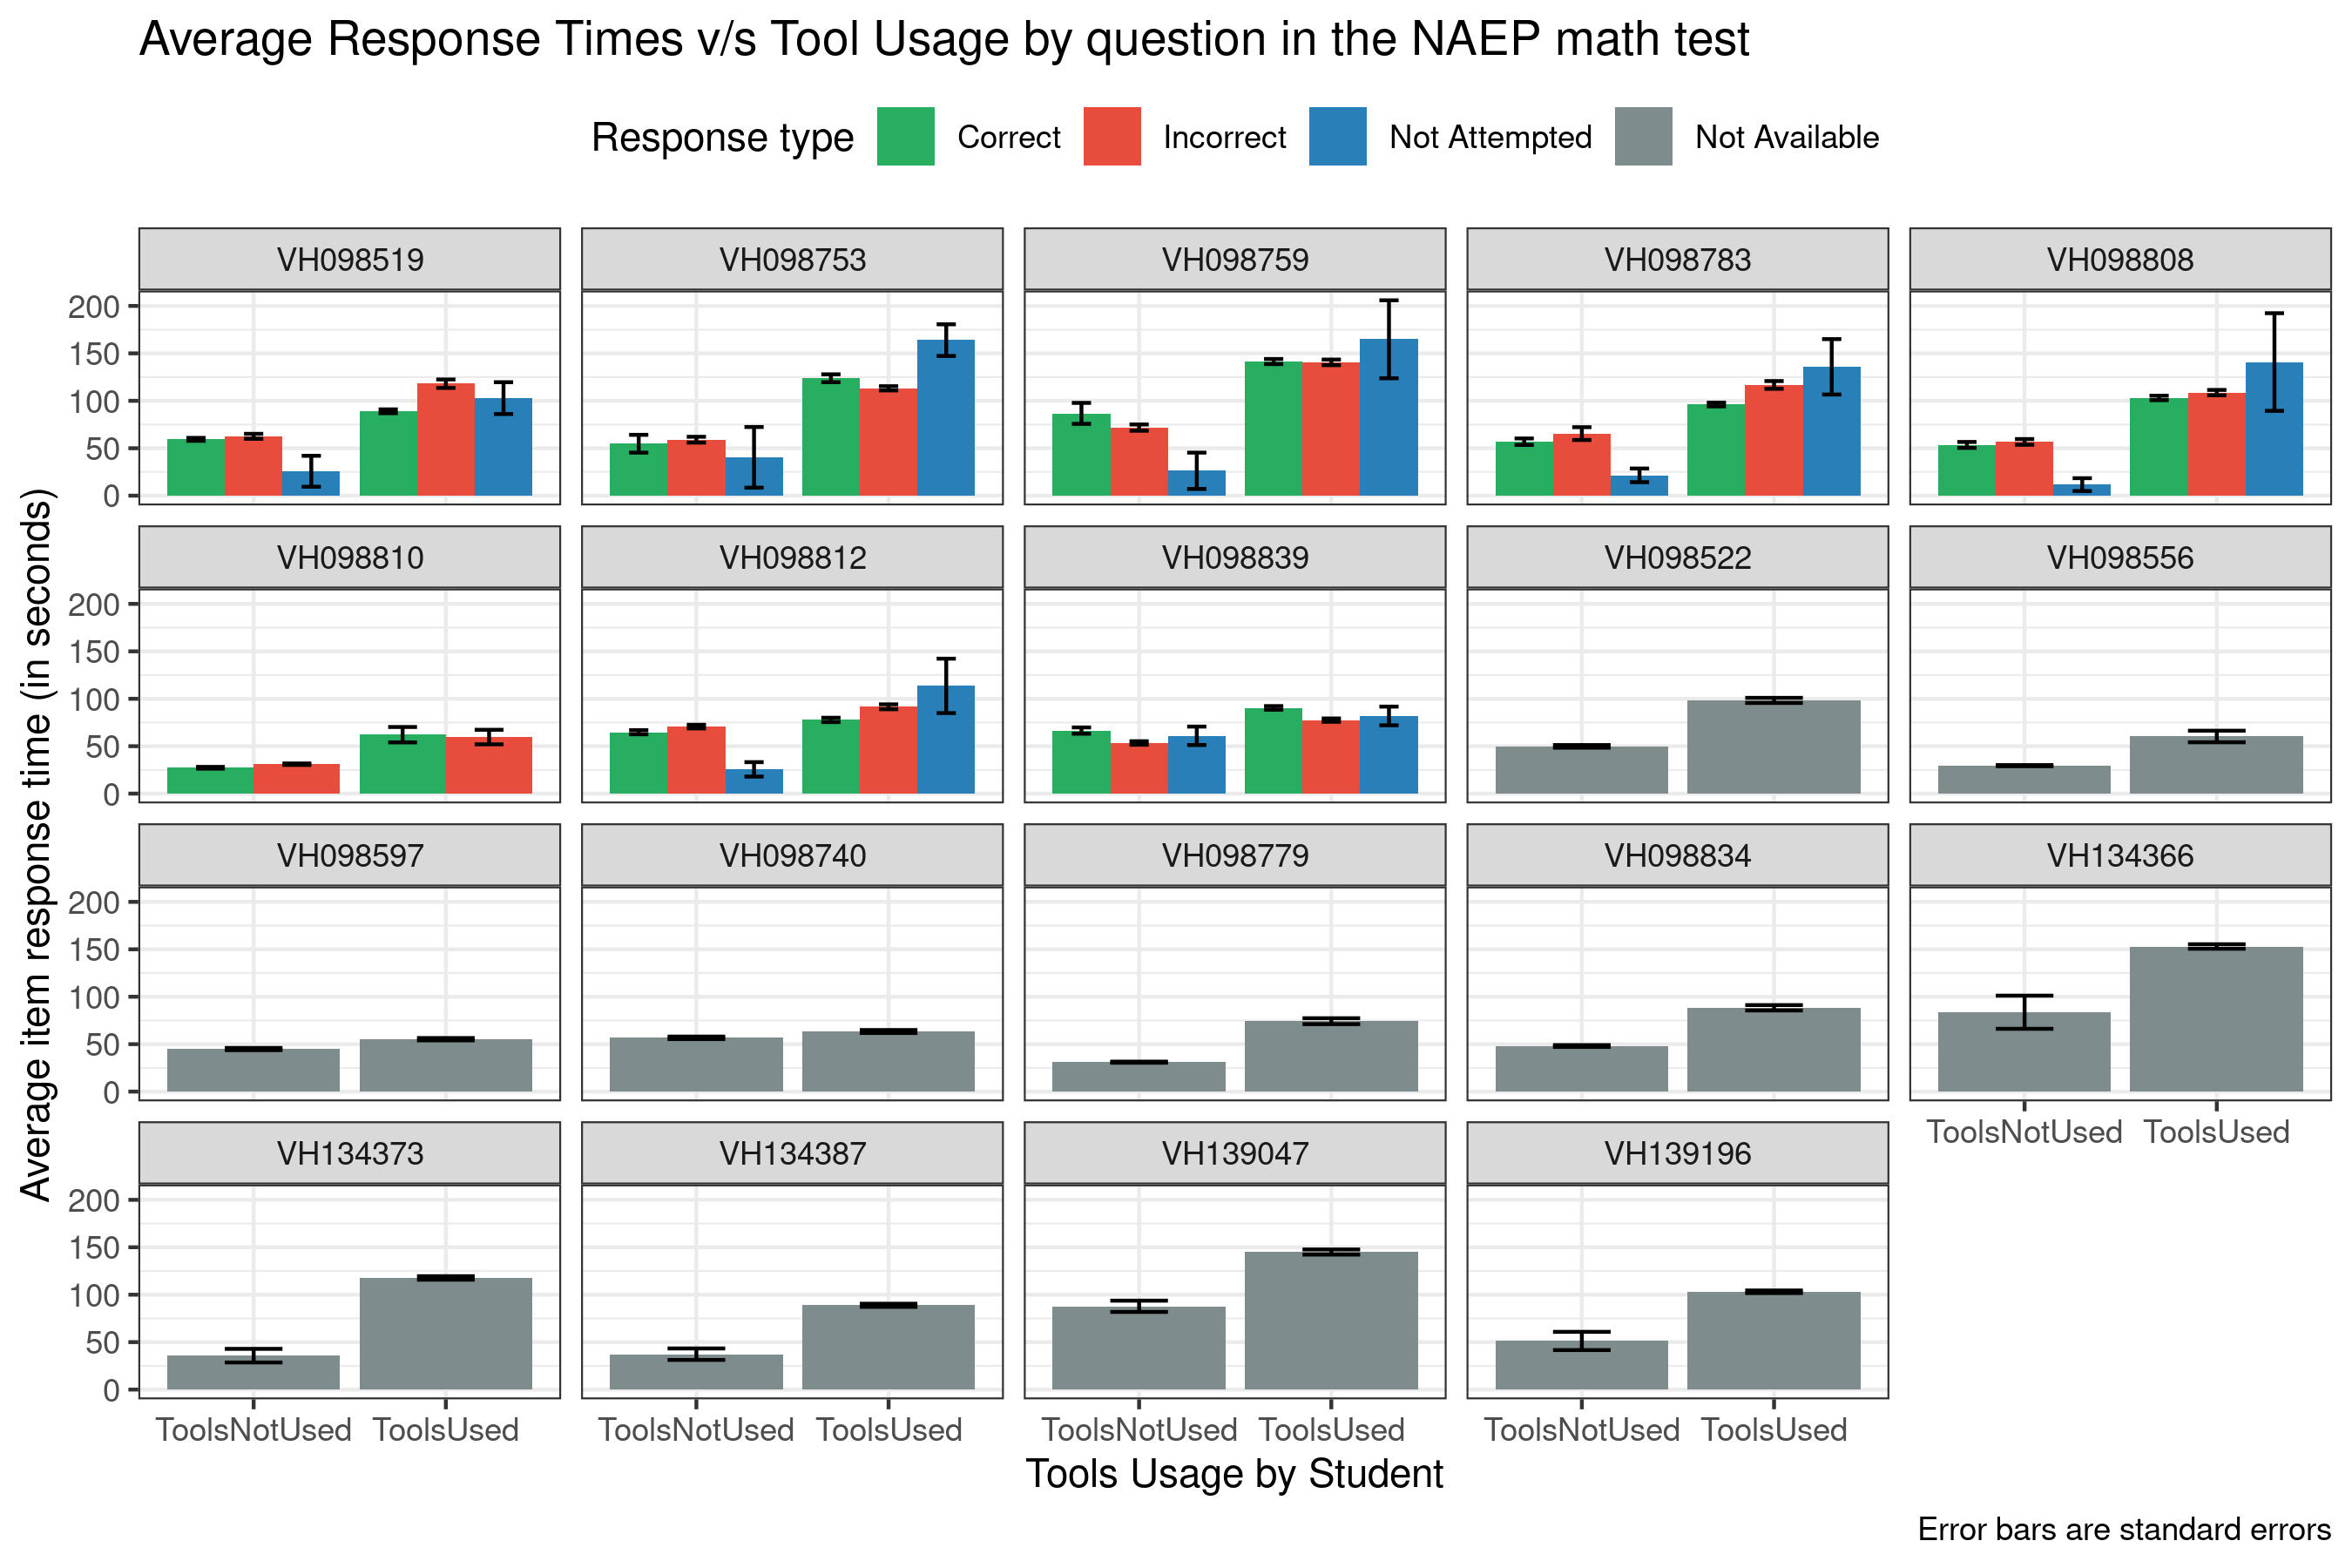
RQ1: We found that, on average, students who used the digital tools took more time to respond to the items than those who did not use the tools. Figure 2 summarizes our findings for each question. We can see that for some questions, the difference in the response time between non-tool and tool users is as much as double. We performed mean comparisons for items where we had correctness data for the correct, incorrect, and not attempted results. Appendix A contains the results of the t-Tests, where we see that most of the differences were statistically significant. This answers RQ1 and tells us that students who used the on-screen tools were slower than the ones who did not use the on-screen tools. We do not have precise data about what the non-tool users used. Maybe they did some guesswork (given the multiple-choice questions), or they used physical tools. Based on the content of the questions (provided in Appendix C), we can say that mental math may not be sufficient to solve most of the questions.
| Question | Tool Usage | Correct | Incorrect | Prop. |
|---|---|---|---|---|
| (N) | (N) | Correct | ||
| VH098519 | ToolsNotUsed | 246 | 462 | 65.25 |
| VH098519 | ToolsUsed | 251 | 665 | 72.60 |
| VH098753 | ToolsNotUsed | 221 | 29 | 11.60 |
| VH098753 | ToolsUsed | 1000 | 328 | 24.70 |
| VH098759 | ToolsNotUsed | 261 | 18 | 6.45 |
| VH098759 | ToolsUsed | 741 | 604 | 44.91 |
| VH098783 | ToolsNotUsed | 130 | 161 | 55.33 |
| VH098783 | ToolsUsed | 259 | 1049 | 80.20 |
| VH098808 | ToolsNotUsed | 146 | 173 | 54.23 |
| VH098808 | ToolsUsed | 653 | 657 | 50.15 |
| VH098810 | ToolsNotUsed | 697 | 876 | 55.69 |
| VH098810 | ToolsUsed | 39 | 30 | 43.48 |
| VH098812 | ToolsNotUsed | 483 | 318 | 39.70 |
| VH098812 | ToolsUsed | 461 | 324 | 41.27 |
| VH098839 | ToolsNotUsed | 322 | 79 | 19.70 |
| VH098839 | ToolsUsed | 637 | 438 | 40.74 |
RQ2: We found that students preferred to use tools in some questions and not use them in others. This is consistent with findings from [3], where they observed that calculator use was more in calculation-heavy items. Question 810, a recall question (shown in Appendix C), did not need a calculator at all, and we can see that out of the 1642 students, 1573 (95.8%) did not use any tool while answering this question. For Questions 753, 759, 783, and 808, more than 80% of the students preferred to use the tools (whether correct or incorrect). For Questions 812 and 519, the tool users were 49.5% and 56.4%, telling us that students did not clearly prefer to use tools for these questions. Looking at Appendix C, we can see that Question 812 may not require tool usage. In summary, Table 2 answers RQ2 and shows us that in some questions, tools were preferred, in some, they were not, and in others, there was mixed behavior.
RQ3: Overall, we found that the tool-using group of students scored more on average than the non-tool-using group. We can see in Table 2, students typically scored more in questions where tools were used. Appendix B shows where the students scored significantly more when using digital tools. The biggest difference was seen in Question 759, a question on calculating averages. Here, 44.9% of the tool users answered correctly, whereas only 6.5% of the non-tool users answered correctly. We do not know why so many students who did not use the tools got the question incorrect because, as per NAEP policy, they all had access to physical calculators. It may be possible that students’ digital tool use is an indicator of their other abilities. We know that students who answered without using the digital tools answered the question faster, though some of those responses could be guesses.
5. DISCUSSION
Based on the results, we can see that the students who did not use the tools provided in the NAEP digital interface were faster in answering the question - whether correct or incorrect. Since we did not have data on students’ outside activities, we cannot say anything about why the students not using the digital tools were faster. We also tried to sequence modelling on students, but the patterns were too complex for the scope of this poster (Appendix C).
For certain Questions tool usage was not required (based on the content of the question). These questions could be solved without tools, and it was seen that the proportion of correct and incorrect responses for non-tool users is statistically insignificant (Appendix B). For certain Questions which required calculation, we still found that the difference between correct and incorrect non-tool users was insignificant, which is interesting and should be investigated further. In all questions, students have to decide whether to use the tool, implying that student training needs to be conducted on not just how to use the tool but also when to use the tool. As the difference between incorrect and correct proportions when not using a tool is positive, it implies that many students were either hesitant to use the tools, inept at using them, or found the tools lacking.
Our analysis did not utilize the fine-grained process data provided by the NAEP system. The step-by-step data of student actions can show how they utilized the tools. To help students be more efficient while taking the test, we can provide personalized feedback based on their usage patterns. For the students who answered correctly, we can find tool usage patterns that were more efficient than theirs (if available) and provide the closest and fastest patterns as suggestions. This can guide the students in avoiding unnecessary steps while solving the problem and making the most of their time. It may be worthwhile to consider having practice tests where the digital test-taking interface disables access to tools for the questions when they are unnecessary. Appropriate tool usage can help students save time and have fewer digital distractions during the test.
6. CONCLUSION AND FUTURE WORK
Our study found that students taking the NAEP test differed in their on-screen tool usage behavior. Students who used the digital tools were typically slower in responding to the items than those who did not. If the question item demanded tool use, then students preferred to use the tools and also scored higher when they used the tools. Our findings show that when taking digital tests, students are better off if they know when to use the tools and when not to use them. A future study can analyze the nuanced processes of tool usage and compare efficient and inefficient digital tool usage. The process data can provide students with personalized recommendations on how to use the tools more efficiently and save time while taking the test. We could also look at the sequence of tool usage and non tool usage amongst students, attempting NAEP.
7. REFERENCES
- Antonio Calvani, Antonio Fini, Maria Ranieri, et al. Digital competence in k-12: theoretical models, assessment tools and empirical research. Anàlisi: quaderns de comunicació i cultura, pages 157–171, 2010.
- Richard P Duran, Ting Zhang, David Sanosa, and Fran Stancavage. Effects of visual representations and associated interactive features on student performance on national assessment of educational progress (naep) pilot science scenario-based tasks. American Institutes for Research, 2020.
- Yang Jiang, Gabrielle A Cayton-Hodges, Leslie Nabors Oláh, and Ilona Minchuk. Using sequence mining to study students’ calculator use, problem solving, and mathematics achievement in the national assessment of educational progress (naep). Computers & Education, 193:104680, 2023.
- Fanny Pettersson. On the issues of digital competence in educational contexts–a review of literature. Education and information technologies, 23(3):1005–1021, 2018.
- Füsun Şahin. Exploring the relations between students’ time management strategies and test performance. Paper presented at the Annual meeting of the National Council for Measurement in Education, 2019.
APPENDIX
A. RESPONSE TIME COMPARISON
A.1 For Correct Answers (T-value calculated by Time consumed by tool not used- tool not used)
| AccessionNumber | VH098519 | VH098753 | VH098759 | VH098783 | VH098808 | VH098810 | VH098812 | VH098839 |
|---|---|---|---|---|---|---|---|---|
| T-Value | -11.759 | -6.733 | -4.811 | -9.962 | -12.677 | -4.275 | -4.114 | -6.251 |
| P-value | <2.2e-16 | <2.2e-16 | <2.2e-16 | <2.2e-16 | <2.2e-16 | <2.2e-16 | <2.2e-16 | <2.2e-16 |
A.2 For Incorrect Answers (T-value calculated by Time consumed by tool not used- tool not used)
| AccessionNumber | VH0985\19 | VH098753 | VH098759 | VH098783 | VH098808 | VH098810 | VH098812 | VH098839 |
|---|---|---|---|---|---|---|---|---|
| T-Value | -10.689 | -14.246 | -15.657 | -6.507 | -12.565 | -3.711 | -6.49 | -9.497 |
| P-value | <2.2e-16 | <2.2e-16 | <2.2e-16 | <2.2e-16 | <2.2e-16 | <2.2e-16 | <2.2e-16 | <2.2e-16 |
A.3 For Unattempted Answers (T-value calculated by Time consumed by tool not used- tool not used)
| AccessionNumber | VH098519 | VH098753 | VH098759 | VH098783 | VH098808 | VH098812 | VH098839 |
|---|---|---|---|---|---|---|---|
| T-Value | -3.295 | -3.423 | -3.057 | -3.802 | -2.49 | -2.965 | -1.514 |
| P-value | 0.0046 | 0.0012 | 0.0121 | 0.0012 | 0.0472 | 0.0069 | 0.1355 |
B. CORRECTNESS PROPORTION FOR NON-TOOL USERS
| Question No. | Correct When Tool Not Used | Incorrect When Tool Not Used | Difference | Count Correct | Count Incorrect | Proportion | z-test | p-value | Sig |
|---|---|---|---|---|---|---|---|---|---|
| VH098519 | 0.410 | 0.495 | 0.085 | 1127 | 497 | 0.436 | 3.185 | 0.0025 | Yes |
| VH098753 | 0.081 | 0.181 | 0.100 | 357 | 1221 | 0.158 | 4.541 | 0.0000 | Yes |
| VH098759 | 0.029 | 0.260 | 0.232 | 622 | 1002 | 0.172 | 12.025 | 0.0000 | Yes |
| VH098783 | 0.133 | 0.334 | 0.201 | 1210 | 389 | 0.182 | 8.944 | 0.0000 | Yes |
| VH098808 | 0.208 | 0.183 | -0.026 | 830 | 799 | 0.196 | -1.307 | 0.1698 | No |
| VH098810 | 0.967 | 0.947 | -0.020 | 906 | 736 | 0.958 | -1.996 | 0.0544 | No |
| VH098812 | 0.495 | 0.512 | 0.016 | 642 | 944 | 0.505 | 0.638 | 0.3254 | No |
| VH098839 | 0.153 | 0.336 | 0.183 | 517 | 959 | 0.272 | 7.538 | <2.2e-16 | Yes |
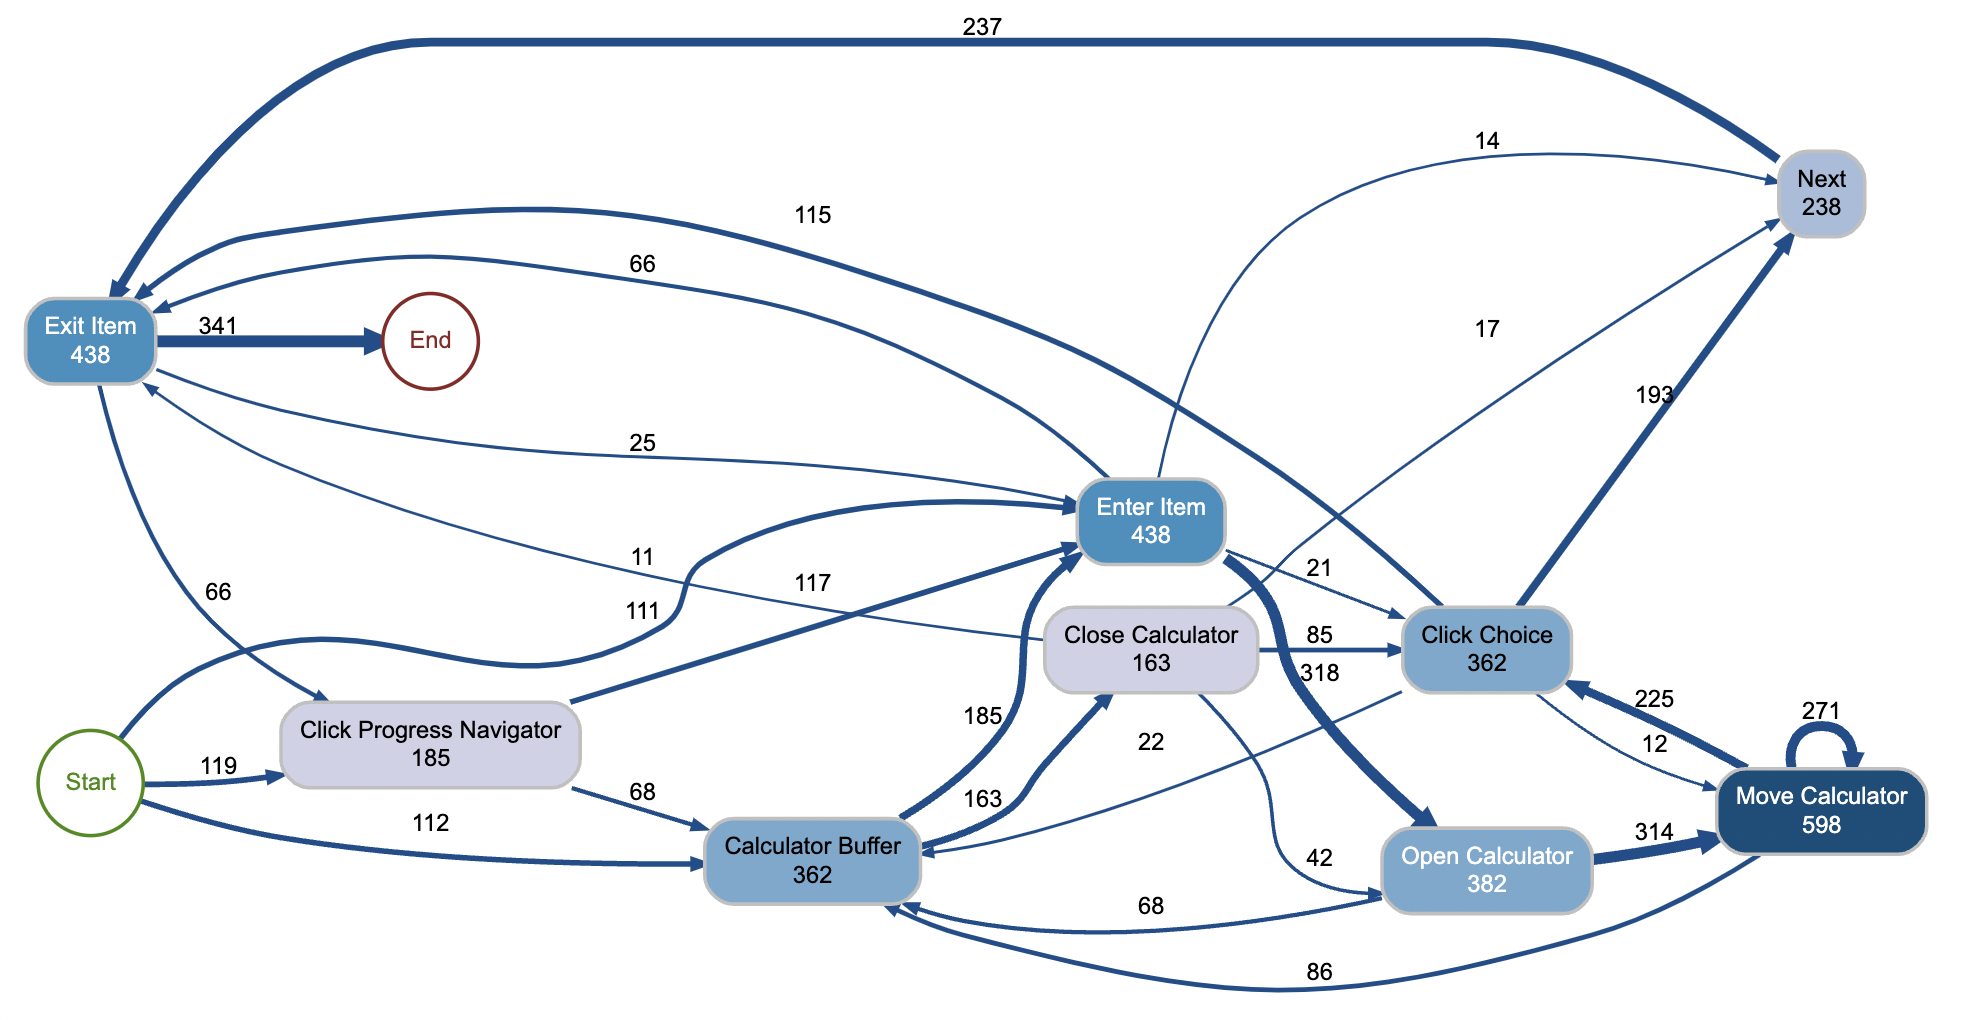
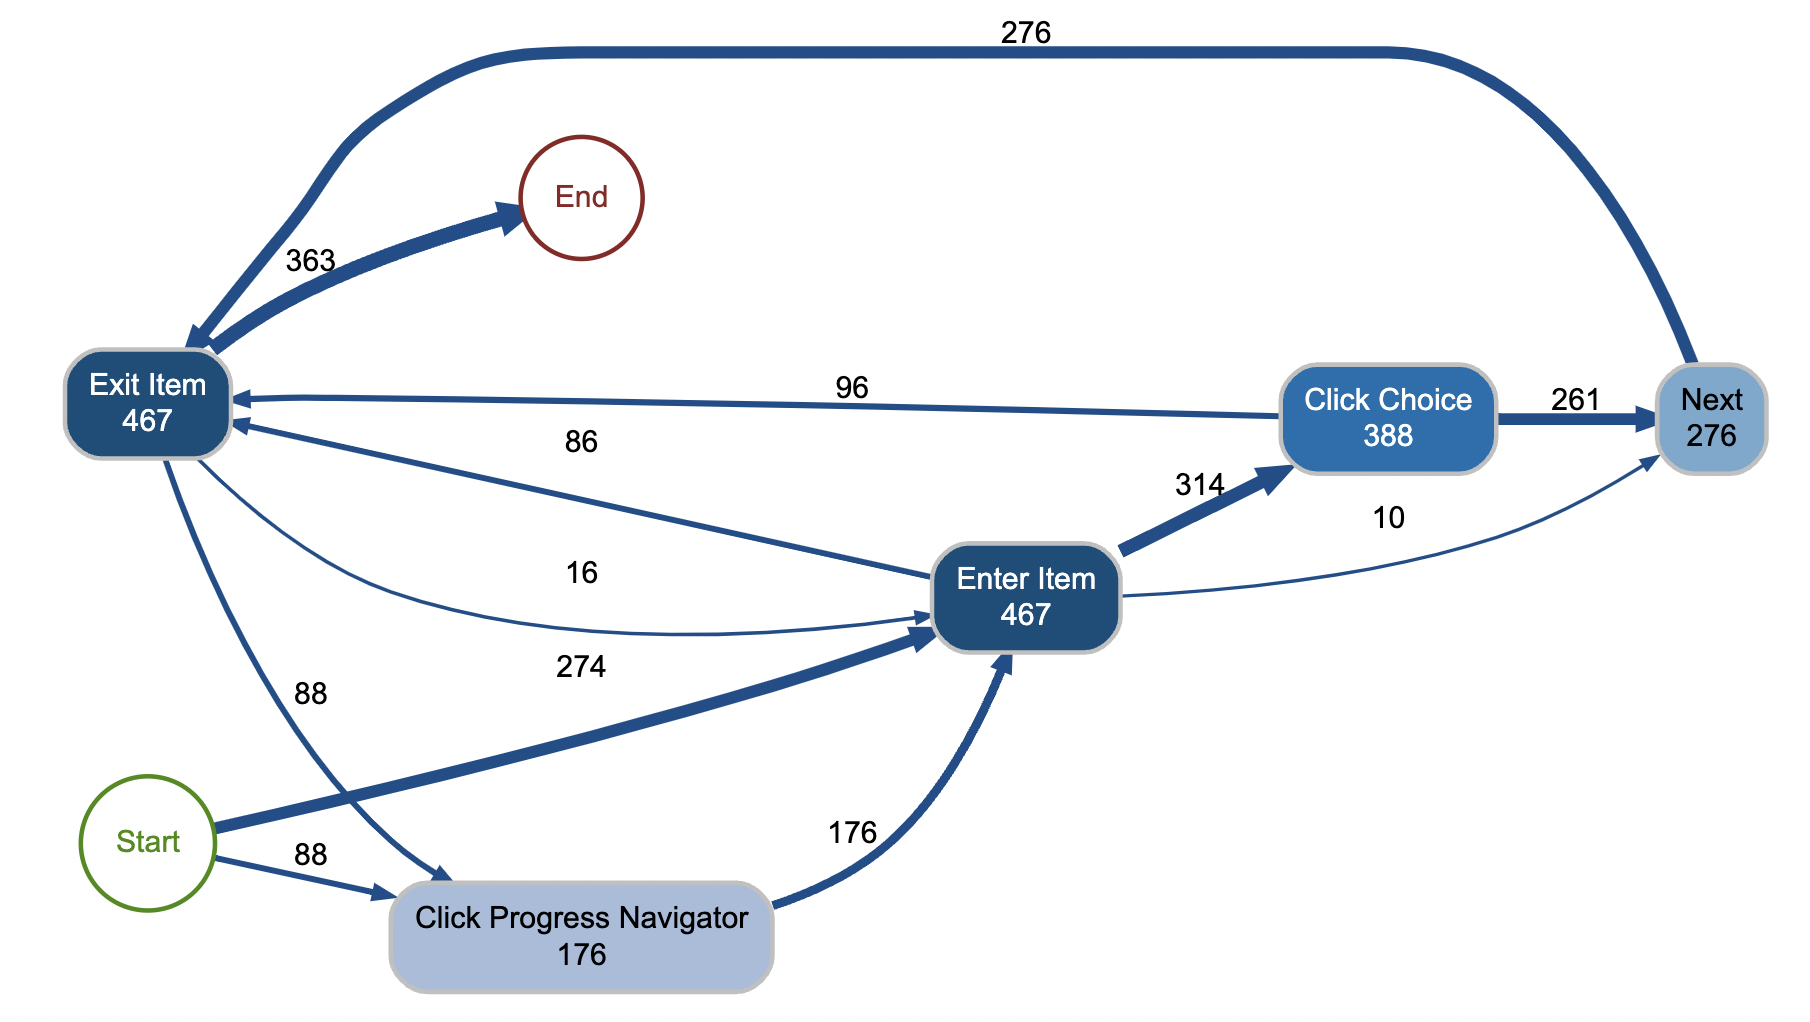
C. SEQUENCE MODELLING
C.1 Where Calculator was used
C.2 Where no tool was used
D. LINK FOR THE NAEP TEST
.png)
© 2023 Copyright is held by the author(s). This work is distributed under the Creative Commons Attribution-NonCommercial-NoDerivatives 4.0 International (CC BY-NC-ND 4.0) license.