ABSTRACT
Automated Essay Scoring (AES) tools aim to improve the efficiency and consistency of essay scoring by using machine learning algorithms. In the existing research work on this topic, most researchers agree that human-automated score agreement remains the benchmark for assessing the accuracy of machine-generated scores. To measure the performance of AES models, the Quadratic Weighted Kappa (QWK) is commonly used as the evaluation metric. However, we have identified several limitations of using QWK as the sole metric for evaluating AES model performance. These limitations include its sensitivity to the rating scale, the potential for the so-called “kappa paradox" to occur, the impact of prevalence, the impact of the position of agreements in the diagonal agreement matrix, and its limitation in handling a large number of raters. Our findings suggest that relying solely on QWK as the evaluation metric for AES performance may not be sufficient. We further discuss insights into additional metrics to comprehensively evaluate the performance and accuracy of AES models.
Keywords
1. INTRODUCTION
As the use of computer software tools for evaluating student essays becomes increasingly popular, researchers have turned to Automated Essay Scoring (AES) systems as a way to expedite the process and reduce costs. These systems, which are essentially machine learning models trained on datasets containing essay answers and their corresponding human-annotated scores, are designed to eliminate concerns about rater consistency and increase the speed of evaluation. To assess the performance of an AES system, the score predicted by an automated scorer is compared to the ground truth or the score assigned by human annotators.
One common metric used to measure the accuracy of a machine learning model is the percent agreement between the predicted score and the ground truth. However, this metric has been criticized for its inability to account for chance agreement, as pointed out by Jacob Cohen in 1960 [7]. In response, Cohen developed the concept of Cohen’s kappa, which takes into consideration the possibility that raters may guess certain variables due to uncertainty. To further address this issue, the variation of Cohen’s kappa known as weighted kappa considers the severity of disagreement between the predicted score and the ground truth. This is particularly important in applications where the consequences of misclassification may vary. Among the variations of weighted kappa, the quadratically weighted kappa is the most commonly used for summarizing interrater agreement on an ordinal scale [12]. This trend is also evident in the field of AES systems, where QWK is frequently employed as a standard evaluation metric, as noted in numerous studies [25, 21, 26, 22, 5, 20, 1, 28, 19].
We present a comprehensive examination of the utility of Quadratic Weighted Kappa (QWK) as an evaluation metric for automated essay scoring (AES) systems. To the best of our knowledge, this is the first work to specifically address the limitations of QWK in the context of AES. We acknowledge that some of the limitations we highlight in this paper may also apply to other fields. However, our paper specifically highlights the limitation of QWK in the AES context and emphasizes its implications for practical use, particularly with respect to the threshold for model acceptance, as discussed in [25]. Our work is motivated by the fact that previous research in AES has predominantly focused on maximizing QWK performance, and we aim to draw attention to the potential pitfalls of solely relying on QWK as a measure of model performance. We argue that the QWK score alone does not provide a complete picture of the model’s performance, and it is crucial to examine the agreement matrix to ensure that it does not fall into one of the limitations discussed in this study.
While kappa statistic has proven to be effective in many cases, it has been found to have some paradoxes in certain scenarios [24, 4, 18, 27]. In a study by Brenner and Kliebsch, the sensitivity of Quadratic Weighted Kappa (QWK) to ratings (based on a given rating scale) was identified as a notable characteristic of the metric [3]. This issue is of particular relevance in our work as we delve into the implications of this characteristic on the acceptance decision of an Automated Essay Scoring (AES) model. Specifically, we focus on the impact of score resolution methods in situations where two human raters are involved in the grading process. Standard methods for combining human scores include summing or averaging the scores. However, in the ASAP (Automated Student Assessment Prize) competition dataset, another score resolution method is employed for some prompts, which involves selecting the higher of the two scores. Our findings indicate that the treatment of human scores, despite the scores remaining unchanged, can affect the performance of the quadratic weighted kappa and ultimately influence the decision-making process regarding the acceptance or rejection of an essay scoring model. To address this issue, we also experiment with different weights on the kappa statistics in an effort to mitigate the impact of the rating scale on the kappa statistics. Additionally, we discuss how the kappa paradox could also produce undesirable effects when used in conjunction with acceptance rates of essay scoring models.
Furthermore, another paradox of kappa statistics is the impact of prevalence on kappa for 2x2 agreement table that has been investigated in prior literature, as demonstrated by Byrt et al. [4]. According to them, the value of kappa is affected by the relative probability of the classes, known as the Prevalence Index (PI). When the PI is high, kappa tends to decrease, potentially leading to an underestimation of the degree of agreement between raters. However, in the context of essay examinations, binary grading or scoring systems with only two levels are relatively uncommon. Instead, grading processes typically incorporate multiple levels or categories of assessment. While the prevalence of agreement matrices with a size of 2x2 has been previously studied, there is still a lack of a comprehensive formula for calculating the prevalence of matrices with a size of 3x3 or greater. In this paper, we aim to address this gap in the literature by proposing a formula for measuring the proportions of classes in raters’ agreement for agreement matrices with a size greater than 2x2.
Subsequently, our study found that the relationship between prevalence and kappa, as previously outlined by Byrt et al. [4], does not consistently hold true when applied to agreement matrices larger than 2x2. Specifically, when the prevalence index (PI) is high, the value of kappa can either decrease or increase depending on the position of the number in the diagonal of the matrix, which indicates the agreement between the two raters. It highlights the need for caution when interpreting kappa values in the context of larger matrices, such as those used to assess essay scores, as these values may not accurately reflect the true level of agreement. Our study contributes to the existing literature on the relationship between prevalence and kappa by providing new insights into the limitations of using kappa as a measure of inter-rater agreement in the context of matrices larger than 2x2.
Finally, it is crucial to consider the limitations of kappa statistics in situations involving multiple raters. Previous research has consistently emphasized the importance of involving two or more raters to increase the reliability of scores, particularly in high-stakes testing programs that include writing essays as a measured task [9]. However, it is crucial to note that kappa statistics are incapable of assessing inter-rater agreement in such situations.
The structure of the paper is as follows. In Section 2, we provide an overview of the concept of Cohen’s kappa and its various weighted forms, including QWK, and examine the interpretation of their values. In Section 3, we examine the quantitative performance acceptance criteria for AES models as outlined by Williamson et al. [25]. In Section 4, we describe the experimental setup, including the dataset, the training algorithms, and the textual features of essays used to create essay scoring models. In Section 5, we assess the performance of QWK as an evaluation metric in the context of AES in multiple scenarios. The experiment results are discussed in section 6, including all notable findings. Finally, the paper is concluded in the last section.
2. KAPPA AND WEIGHTED KAPPA
Cohen’s kappa and Weighted kappa are widely used measures of inter-rater agreement that account for chance agreement and have been applied in various research fields. In this section, we discuss the concept, formula, and interpretations of these two measures.
2.1 Cohen’s Kappa
Cohen’s kappa, also known as unweighted kappa, is a widely utilized statistical measure used to evaluate the agreement between two independent raters in their assessment of a particular set of items. This measure was first introduced by Jacob Cohen in 1960 [7] and has since become a widely accepted method for assessing the reliability of rating scales and classification models.
One of the key features of Cohen’s kappa is that it adjusts for chance agreement, meaning that it takes into account the possibility of two raters agreeing simply by chance rather than as a result of their independent assessments. This is particularly useful in situations where the raters may not have a high level of expertise or may be biased in their evaluations. By normalizing the agreement between the two raters at the baseline of random chance, Cohen’s kappa allows for a more objective and reliable assessment of their agreement.
Overall, the use of Cohen’s kappa allows for a more accurate assessment of the agreement between two independent raters and the performance of classification models. It allows for the reliable evaluation of the reliability of rating scales and the effectiveness of classification algorithms, providing valuable insights into the accuracy and reliability of the assessments being made.
Cohen’s kappa is calculated by taking into account both the observed agreement between raters and the expected level of agreement that would be observed by chance alone. By comparing these two values, Cohen’s kappa allows researchers to determine the degree to which the raters’ evaluations are reliable and consistent rather than merely the result of random chance.
Cohen’s kappa (unweighted) is formalized as follows: \begin {equation} \kappa = \dfrac {P_o - P_e} {1 - P_e} \end {equation}
In order to assess the reliability of the ratings given by the two raters, we calculated the percentage of actually observed agreement, denoted as \(P_o\), and the expected agreement, denoted as \(P_e\). \(P_o\) was calculated by dividing the number of ratings that were assigned the same category by both raters by the total number of ratings. This allowed us to determine the percentage of ratings that the two raters agreed upon. \(P_e\), on the other hand, was calculated based on the distribution of ratings across the categories. Specifically, it represented the probability that the two raters would agree on a rating by chance alone. This value was obtained by taking into account the frequency of each rating within the set of ratings given by both raters.
When the value of \(\kappa \) is 0, it signifies that the agreement between two raters is no greater than what would be expected by chance alone. This indicates a lack of consistency in the ratings provided by the two raters. On the other hand, a \(\kappa \) value of 1 indicates that the raters are in complete agreement, demonstrating a high level of consistency in their ratings. It is worth noting that in rare cases, the value of \(\kappa \) may be negative, indicating that the agreement between the two raters is actually lower than what would be expected by chance. Table 1 provides a guide for interpreting kappa values ranging from 0 to 1, as described in the work of Landis and Koch [16]. It is important to note that it is not possible to establish a single, universally accepted value for the statistic known as kappa. Instead, the appropriateness of any particular value of kappa depends on the level of accuracy demonstrated by the observers in question, as well as the number of codes being used to categorize the data.
| Kappa | Interpretation |
|---|---|
| < 0 | Less than chance agreement |
| 0.01 - 0.20 | Slight agreement |
| 0.21 - 0.40 | Fair agreement |
| 0.41 - 0.60 | Moderate agreement |
| 0.61 - 0.80 | Substantial agreement |
| 0.81 - 1.00 | Almost perfect agreement |
As an unweighted measure, Cohen’s kappa is particularly useful for evaluating the agreement between raters when there is no inherent hierarchy or relative importance among the categories being evaluated.
2.2 Weighted Kappa
The weighted kappa statistic is a measure of inter-rater reliability that takes into account the strength of the agreement between raters in addition to the presence of the agreement itself. In contrast, the unweighted kappa statistic simply counts the number of agreements without considering the magnitude of the difference between the ratings. The use of weighted kappa is particularly appropriate in situations where the categories being rated are not equally likely or important.
To compute weighted kappa, once the observed agreement (\(P_o\)) and expected agreement(\(P_e\)) have been calculated, they are multiplied by a weights matrix. The weights would be a decreasing function of the distance \(|i − j|\), such that disagreements corresponding to adjacent categories would be assigned higher weights than those corresponding to categories that are further apart [23].
There are many different ways to weigh the kappa statistic, depending on the specific situation and the type of data being analyzed. Some common weighting schemes include linear weight and quadratic weight. Given \(n\) as the number of rating categories, the formula of the linear weight for an agreement table with size \(n \times n\) is as follows: \begin {equation} w_{ij} = 1 - \dfrac {|i - j|} {n - 1}, \end {equation}
And, for the quadratic weight is as follows: \begin {equation} w_{ij} = 1 - \Big (\dfrac {i - j} {n - 1}\Big )^2, \end {equation}
with \(w_{ij} \in [0, 1]\) and \(w_{ii} = 1\) for \(i, j \in \{1, 2,..., n\}\).
Linear weighting schemes assign weights to the ratings or scores based on the difference between the ratings, with larger differences receiving lower weights. Quadratic weighting schemes, on the other hand, assign weights based on the square of the difference between the ratings, with even larger differences receiving even lower weights.
3. ACCEPTANCE OF AES MODEL
According to Williamson et al. in [25], there is an acceptance criterion that is used to evaluate the performance of automated scoring in relation to human scores when automated scoring is intended to be utilized in conjunction with human scoring. The measurement of agreement between human scores and automated scores has been a longstanding method for determining the effectiveness of automated scoring systems. This evaluation process involves comparing the automated scores to the human scores in order to determine if they satisfy a predefined threshold. In particular, the quadratic weighted kappa (QWK) between automated and human scoring must be at least .70 (rounded normally) in order to be considered acceptable.
It is important to note that the performance of automated scoring systems is highly dependent on the quality of human scoring. Therefore, it is crucial that the interrater agreement among human raters is reliable before utilizing automated scoring in conjunction with human scoring. This ensures that the automated scores will be accurate and reliable, which is essential for the effective use of automated scoring in a variety of settings.
4. EXPERIMENT SETTINGS
4.1 Dataset
In order to conduct our experiment, we utilized the Automated Student Assessment Prize (ASAP) dataset1, which is hosted on the Kaggle platform. This dataset has been widely recognized as a valuable resource for evaluating the performance of automated essay scoring (AES) systems [17], and has thus become the standard for research in this field. The ASAP dataset comprises a collection of essays that have already been scored by human graders and includes eight different prompts with a range of possible scores for each.
4.2 Model Training
In order to assess the performance of our regression models, we employed a 5-fold cross-validation strategy, using 80% of the data for training and 20% for testing. Three different algorithms were utilized in our analysis: Gradient Boosting, Random Forest, and Ridge Regression. In this study, the essay features were obtained using the same methodology as described in [10]. Each essay was transformed into a 780-dimensional feature vector comprising two categories: 12 interpretable features and a 768-dimensional Sentence-BERT vector representation.
We trained separate models for each prompt within the dataset. To optimize the performance of each model, we utilized different hyper-parameter configurations for each individual model. In accordance with the established standard for evaluating automated essay scoring (AES) systems, we utilized the Quadratic Weighted Kappa (QWK) score as our evaluation metric [8, 25]. This measure allows us to compare the system-predicted scores with human-annotated scores, thereby providing a quantifiable indication of the level of agreement between the two.
5. QWK EVALUATION IN AES CONTEXT
In this section, we delved into various factors that can affect the value of Quadratic Weighted Kappa (QWK) and its implications for use in the context of Automated Essay Scoring (AES). These factors include the impact of the rating scale, the kappa paradox, the proportion of classes in rater agreement, changes in agreement position, and the number of raters involved.
5.1 The Effect of Rating Scale to QWK
In this section, we delve into the topic of the sensitivity of Quadratic Weighted Kappa (QWK) to rating scales. This particular characteristic of weighted kappa has been previously discussed by Brenner and Kliebsch in their seminal work [3]. We aim to further elaborate on the implications of this sensitivity in the context of evaluating the performance of an Automatic Essay Scoring (AES) model. The sensitivity of QWK to rating scales can be clearly demonstrated through the simple case presented in Table 2. By comparing the two examples within the table, we can observe that even a slight modification in the rating scale can result in notable changes in the QWK score. The first example presented in the table yields a QWK score of 0.50, which can be considered as indicating a moderate level of agreement. In contrast, the second example has a QWK score of 0.78, indicating a substantial level of agreement between the ratings. Importantly, both examples have the same number of agreements and disagreements. This illustrates the significant impact that the rating scale can have on the QWK score, highlighting the importance of carefully considering the rating scale when utilizing this measure of agreement.
| Prediction | QWK | Interpretation | |
|---|---|---|---|
| Rater 1 | [1, 2, 3] |
0.50 |
Moderate agreement |
| Rater 2 | [2, 1, 3] | ||
| Rater 1 | [1, 2, 4] |
0.78 |
Substantial agreement |
| Rater 2 | [2, 1, 4] |
We provide experimental results that show how an AES model performance changes when trained with a different score resolution from two human raters as the final score (label). The ASAP dataset score resolution table (Table 3) outlines the scoring method for each prompt. For Prompt 1 and Prompt 7, the score is determined by adding the scores from two raters together. For Prompt 2 and Prompt 8, the score is determined by combining the scores from an essay rubric. For Prompts 3-6, the score is determined by taking the higher score of the two raters.
| ASAP Dataset | Score Resolution |
|---|---|
| Prompt 1 | Sum of two raters |
| Prompt 2 | Combination of essay rubric scores |
| Prompt 3 | Higher of two raters |
| Prompt 4 | Higher of two raters |
| Prompt 5 | Higher of two raters |
| Prompt 6 | Higher of two raters |
| Prompt 7 | Sum of two raters |
| Prompt 8 | Combination of essay rubric scores |
The purpose of this experiment was to investigate the effect of score resolution on QWK scores using three different machine learning models: gradient boosting, random forest, and ridge regression. The QWK scores were calculated for six different prompts, labeled Prompt 1 through Prompt 7. We exclude prompt 2 and prompt 8 since they already have specific scoring methods which involve the combination of essay rubrics.
|
Dataset
|
Gradient Boosting
|
Random Forest
|
Ridge Regression
|
||||||
|---|---|---|---|---|---|---|---|---|---|
| higher | mean | sum | higher | mean | sum | higher | mean | sum | |
| Prompt 1 | 0.720 | 0.7143 | 0.7840 | 0.6986 | 0.6989 | 0.7776 | 0.6672 | 0.662 | 0.7395 |
| Prompt 3 | 0.6825 | 0.6750 | 0.7016 | 0.6641 | 0.6631 | 0.691 | 0.6557 | 0.6569 | 0.6928 |
| Prompt 4 | 0.7649 | 0.7742 | 0.8079 | 0.7303 | 0.7323 | 0.7740 | 0.7803 | 0.7804 | 0.8124 |
| Prompt 5 | 0.8077 | 0.8108 | 0.8639 | 0.7926 | 0.7889 | 0.8526 | 0.7958 | 0.7971 | 0.8568 |
| Prompt 6 | 0.7964 | 0.7931 | 0.8548 | 0.7637 | 0.7619 | 0.8239 | 0.7822 | 0.7923 | 0.on47 |
| Prompt 7 | 0.7350 | 0.7685 | 0.7780 | 0.6836 | 0.7121 | 0.7254 | 0.7366 | 0.7722 | 0.7785 |
|
Dataset | QWK | LWK | Cohen’s kappa
| ||||||
|---|---|---|---|---|---|---|---|---|---|
| higher | mean | sum | higher | mean | sum | higher | mean | sum | |
| Prompt 1 | 0.720 | 0.714 | 0.784 | 0.600 | 0.609 | 0.599 | 0.502 | 0.525 | 0.347 |
| Prompt 3 | 0.682 | 0.675 | 0.702 | 0.596 | 0.589 | 0.543 | 0.519 | 0.515 | 0.324 |
| Prompt 4 | 0.765 | 0.774 | 0.808 | 0.637 | 0.651 | 0.619 | 0.51 | 0.527 | 0.318 |
| Prompt 5 | 0.808 | 0.811 | 0.864 | 0.686 | 0.694 | 0.680 | 0.559 | 0.574 | 0.353 |
| Prompt 6 | 0.796 | 0.793 | 0.855 | 0.666 | 0.655 | 0.656 | 0.535 | 0.515 | 0.321 |
| Prompt 7 | 0.735 | 0.768 | 0.778 | 0.520 | 0.545 | 0.548 | 0.175 | 0.179 | 0.089 |
To further explore the impact of rating scale on QWK scores, we implemented three different score resolution methods for the six prompts used in our study. The first method involved summing the scores given by both raters. The second method involved selecting the higher score between the two raters. The third method involved calculating the mean of the scores given by both raters. According to a survey of state testing programs conducted by Johnson et al. [13], it was determined that an operational score is typically formed by summing or averaging the scores of raters, when such scores meet the agency’s definition of agreement, which is generally predicated on the requirement that scores be at least adjacent. Additionally, the methodology of using the higher score of both raters was employed in the ASAP dataset in four prompts.
Based on the results Table 4, it appears that the sum of the QWK scores is consistently higher than the mean scores and the higher score of the two raters for all prompts and all three models. Our results demonstrated that the use of different score resolution methods had a significant impact on QWK scores. Additionally, it appears that the gradient boosting model consistently performs the best for all prompts. The random forest model performs slightly worse, while the ridge regression model performs the worst of the three.
In this study, we present an argument that the primary issue in this scenario is that the scores of the two human raters are basically unchanged. The difference is how the scores are treated to obtain the final score. The different results of QWK by using the higher, the mean, and the sum value of both scores results in inconsistencies in the decision-making process of the essay scoring model acceptance. These findings indicate that in order to maximize the quadratic weighted kappa value, one can always select the approach of summing the scores of both raters as it leads to a larger scale of scores.
Researchers and practitioners should be mindful of the potential impact of rating scale choices on the resulting QWK scores and take appropriate measures to mitigate this sensitivity. One strategy that can be employed is to decrease the weight assigned to the kappa formula. To evaluate the effectiveness of this strategy, we conducted a further experiment using the same dataset discussed in Table 4. The purpose of this experiment was to compare the results of the kappa values obtained from different weights, specifically quadratic weighted kappa, linear weighted kappa, and Cohen’s kappa (unweighted). In order to ensure a fair comparison, we utilized the Gradient Boosting algorithm for all calculations as the previous result has shown it to perform better than Random Forest and Ridge Regression, as outlined in Table 4.
The results of our experiment are presented in Table 5. We have examined the impact of the rating scale on the quadratic weighted kappa (QWK) and found that as the scale of the scores increases, the QWK value also increases. In contrast, our results for Cohen’s kappa, an unweighted measure of inter-rater agreement, revealed an opposite trend. The last column of Table 5 illustrates that the kappa values for the sum of the scores are, in fact, lower than those for the higher or mean scores from human raters. This indicates that as the scale of the rating increases, the kappa values decrease.
The Linear Weighted Kappa (LWK) method has been demonstrated to yield the most balanced results when dealing with rating scales. In situations where the scores assigned by human raters remain consistent, the manner in which the scores are treated is inconsequential, as the results obtained from the higher score, the mean, and the sum of the scores are quite similar. LWK has been found to effectively mitigate the impact of rating scales in comparison to quadratically weighted and unweighted kappa.
The immediate consequence of selecting different weights for kappa is the need to define a new threshold for the acceptance rate of an automated essay scoring model. This is due to the fact that the threshold of 0.7, which is commonly utilized in such models, was specifically defined for the use of quadratic weighted kappa. In particular, different weights of the kappa coefficient reflect different emphases on different types of agreement or disagreement; therefore, it is crucial to adjust the threshold accordingly so that the evaluation aligns with the intended focus of the scoring system. Failure to properly define and adjust the threshold for acceptable performance can result in misinterpretation or overestimation of the system’s performance. Thus, it is essential for stakeholders and decision-makers to clearly define the acceptable performance criteria prior to the implementation of an automated essay scoring system.
5.2 Kappa Paradox
The kappa paradox invalidates the common assumption that the value of kappa increases as the level of agreement in data increases. This paradox occurs when a classifier exhibits a high level of percent agreement but a low kappa score, which can be counterintuitive and potentially misleading.
The paradox arises due to an imbalanced agreement between two raters. For example, consider the case of binary classification, in which both raters mostly agree on only one class. In such a scenario, the percent agreement may be high, but the kappa score may be low due to the relatively high expected agreement.
To illustrate this phenomenon, consider the following example: suppose we have two predictions from rater A and rater B, represented by arrays A and B, respectively. Both arrays have a size of 1000, and the scores for each rater are as follows: \begin {flalign*} \hspace {2em} A = [5,7,7,9,8,9,9,9,9,9,9,9, ...., 9] &&\\ B = [8,6,9,6,8,9,9,9,9,9,9,9, ...., 9] && \end {flalign*}
Here, the percent agreement between the two raters is 99.8%. However, the QWK is only 0.488, which is below the standard acceptance criteria of 0.7 proposed by Williamson et al. [25].
This result can be attributed to the fact that kappa is a chance-adjusted measure of agreement, which accounts for the expected agreement due to chance. In other words, kappa shows how much better a model performs compared to random predictions. In the example provided, the probability of agreement by chance is relatively high, leading to a low kappa score despite the high percent agreement.
To sum up, the kappa paradox highlights the importance of considering both percent agreement and kappa in evaluating the performance of a classification model. While percent agreement may be a simple and intuitive measure, it can be misleading when there is an imbalanced agreement between raters. On the other hand, kappa considers the expected agreement due to chance and provides a more nuanced view of the model’s performance.
5.3 Proportion of Categories in Agreement
One notable limitation of QWK is that its score is heavily influenced by the proportion of agreement between raters for different classes or scores. [4] described that the value of kappa is affected by the relative probability of the classes in a 2x2 agreement table, known as the Prevalence Index (PI). Suppose there are two people who are tasked with categorizing a group of N individuals into one of two categories, such as "Yes" or "No". The result can be presented in a 2-by-2 table as shown in Figure 1.
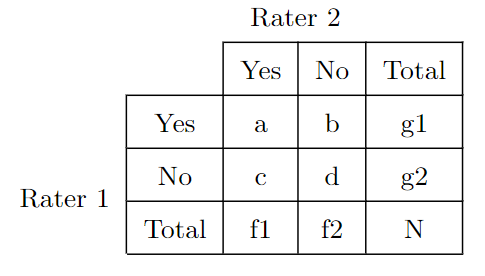
From Figure 1, the estimate of the probability of "Yes" for the whole population would be the mean of f1/N and g1/N. Similarly, the most accurate estimate of the probability of "No" can be obtained by finding the mean of f2/N and g2/N. The Prevalence Index (PI) is calculated by subtracting the probability of "Yes" from the probability of "No" and dividing the result by N. Therefore, it is estimated by (a - d)/N. The value of PI can range from - 1 to + 1, and is equal to 0 when the probabilities of "Yes" and "No" are equal.
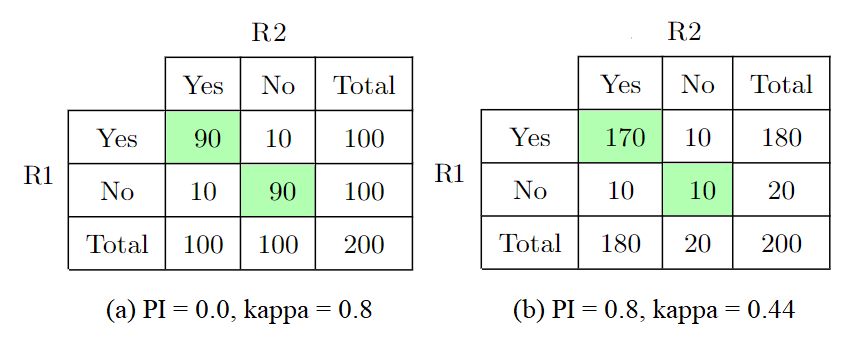
In Figure 2, two cases are presented in which there are 180 agreements and 20 disagreements between raters. In the first case, the calculated percent agreement (PI) is 0.0, and the kappa value is 0.8, while in the second case, the PI is 0.8, and the kappa value is 0.44. It is important to note that the difference between the kappa values in these two cases is due to the prevalence effect. As the value of PI increases, the expected probability (\(P_{e}\)) also increases, which in turn results in a decrease in the value of kappa. This relationship highlights the need to consider the prevalence of the ratings in the analysis of interrater reliability.
In essay examinations, the use of binary grades or scoring systems with only two levels is highly uncommon. Rather, the grading process typically involves multiple levels or categories of assessment. This presents a unique challenge in evaluating the agreement between human raters and automated essay scoring models, as the agreement matrix between the two will typically have a size greater than 3x3.
We propose a formula for measuring the prevalence of agreement matrix with size 3x3 or larger, as follows: \begin {equation} prev = \dfrac {1}{n} \dfrac {1}{c (c-1) / 2} \sum _{i=0}^{c-1} \sum _{j=i+1}^c \mid U_{ii} - U_{jj}\mid \end {equation} where \(c\) is the number of classes, \(n\) is the number of items, and \(U_{ii}\) is the diagonal element of the agreement matrix. This formula is designed to provide a quantifiable measure of the average difference of all unique pairs of the categories in the raters’ agreement. By dividing the sum of the absolute differences between the diagonal elements of the agreement matrix by the total number of items and the number of unique pairs of classes, we can obtain a normalized measure of the proportions of classes in the agreement.
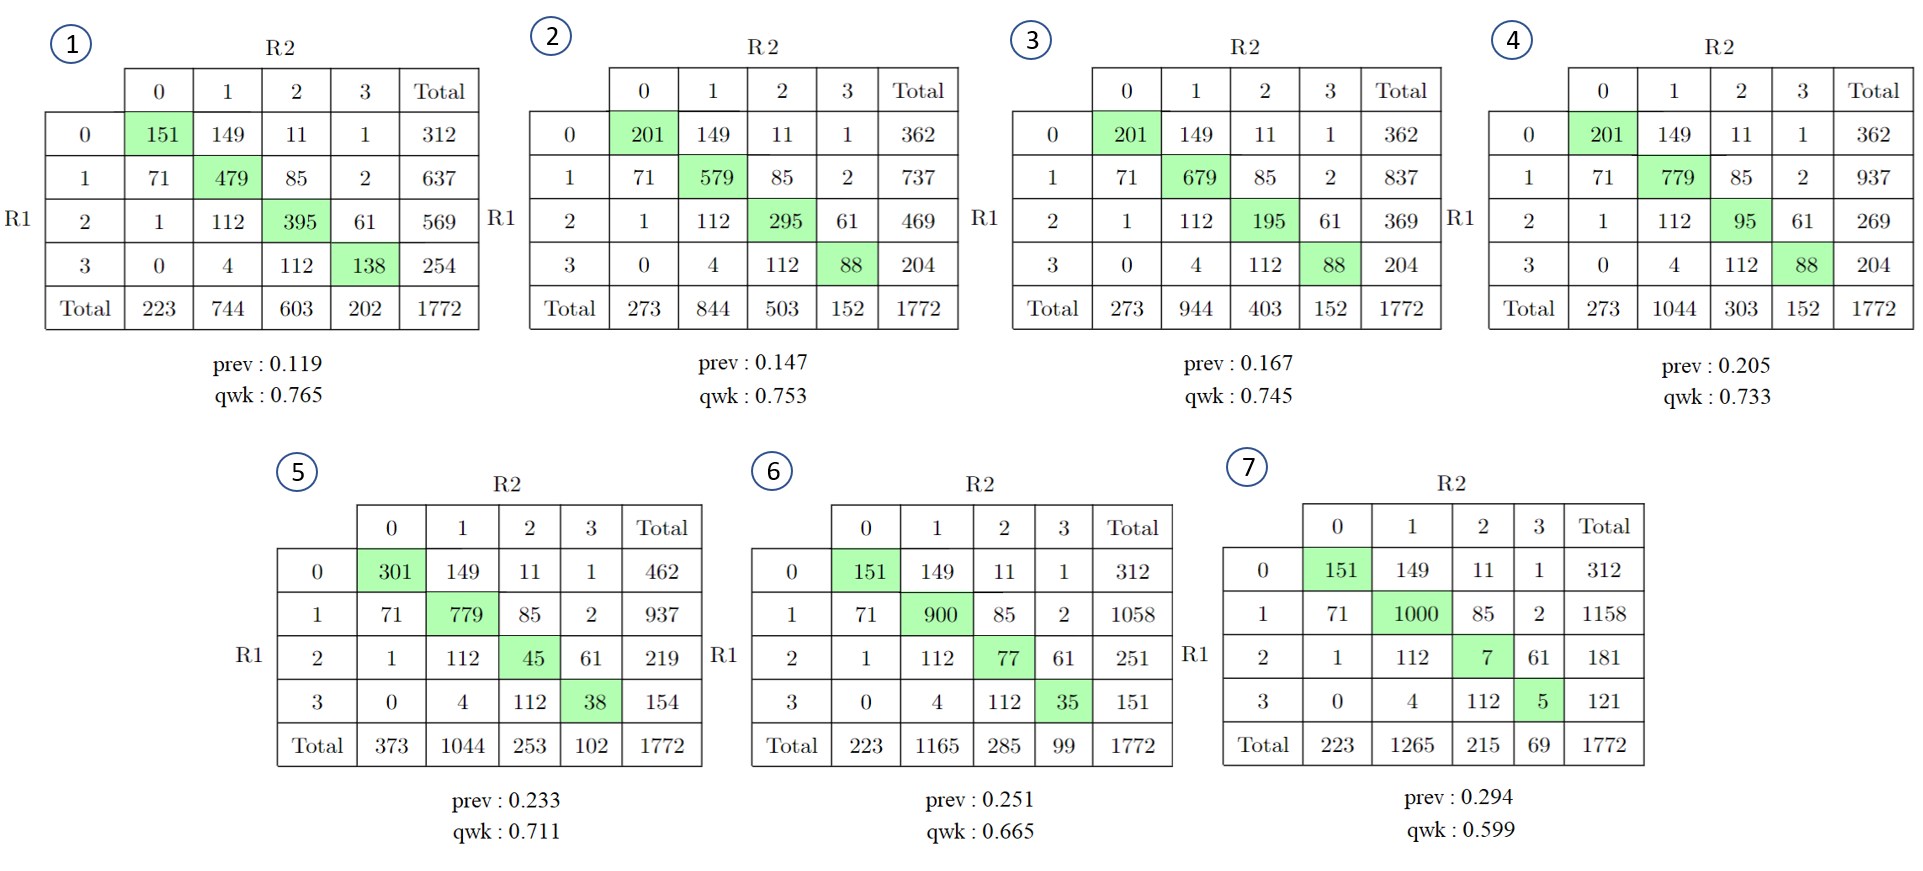
In order to further demonstrate the extent of this issue, we present an example from prompt 4 in the ASAP dataset. The scores within this dataset range from 0 to 3. In order to effectively visualize the performance of the AES model, we have included the confusion matrices that compare the model’s score predictions with the human scores, which serve as the ground truth.
In order to explore the relationship between the prevalence of agreements between raters and the Quadratic Weighted Kappa (QWK) score, we conducted an experiment involving seven different proportions of agreements and visualized the results in Figure 3. The first agreement table in the figure shows the prediction performance of our trained regression model, with a QWK score of 0.765. Using our formula, the value of the prevalence is 0.119. We can observe in this table that the proportion of agreement for different scores is somewhat evenly distributed, with most of the agreement between rater 1 and rater 2 occurring in score 1. The accuracy or percent agreement for this model is 0.66.
An intriguing outcome of the QWK behavior is evidenced in the last table (no. 7) in Figure 3. It demonstrates the prediction performance with an accuracy of 0.66, which is the same as that of the first table (no. 1). However, the QWK score for this model has significantly decreased to 0.599, falling below the acceptable score of 0.70 for an AES model. Despite the decrease in the QWK score, the prevalence of agreement between the two raters in this table was found to be 0.294, indicating a higher imbalance in the agreement scores between the two raters. This scenario was created through the manipulation of the confusion matrix, in which both raters made more frequent equal predictions on score 1. This manipulation allowed for the examination of the impact of such an imbalance on the overall QWK score.
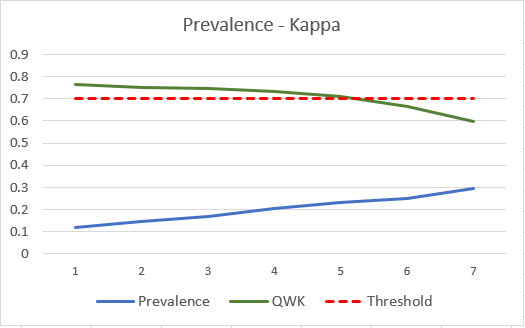
Figure 4 illustrates that as the prevalence of the agreement table increases, the QWK value decreases. Initially, the QWK value is 0.765, above the acceptance threshold, but as the prevalence increases, the QWK value drops to 0.599, below the accepted score threshold. This results in the acceptance decision for the AES model changing from accepted to rejected, even though all models have the same number of raters’ agreements. These findings suggest that the proportion of agreements plays a significant role in determining the reliability of an assessment model.
The main objective of this section is to demonstrate that a scenario exists in which the value of kappa decreases as prevalence increases that leading to a decision-making challenge within the context of AES. It is worth noting, however, that this pattern of prevalence-kappa correlation is not always the case. In fact, it is possible for the kappa value to increase even as prevalence increases, particularly in the context of agreement matrices with dimensions greater than 2x2. This phenomenon has not been previously addressed in the literature and will be explored in greater detail in the following section.
5.4 Position Change in Agreement
In our study, we examined the validity of the pattern proposed by Byrt et al. (1993) in relation to agreement matrices larger than 3x3. Our findings indicate that this pattern is not consistently applicable in these cases. To further demonstrate this, we analyzed two specific examples, depicted in Figure 5. Both examples presented are from the last two agreement tables in Figure 3 (tables no 6 and 7) to show an opposite relationship between prevalence and kappa, contrasting the relationship discussed in the previous section. In both cases, we maintained the same number of agreements on the diagonal of the matrix, thus preserving the overall prevalence. However, as shown in Figure 5, we observed significant changes in the Quadratic Weighted Kappa (QWK) value when altering the arrangement of these agreements within the matrix. Specifically, in the upper image of Figure 5, the QWK increased from 0.665 to 0.853 after swapping the positions of the numbers 900 and 35 in the corner of the matrix. Similarly, in the bottom image, the QWK increased from 0.599 to 0.855 after swapping the positions of the numbers 1000 and 5 on the diagonal. These findings suggest that the position of agreements within the matrix can significantly impact the QWK value and, therefore, must be considered when evaluating the agreement between raters.
The observed results can be attributed to the significant difference in the expected probability (\(P_e\)) of the two matrices being compared. As demonstrated in Figure 5(a), the matrix on the left exhibits a \(P_e\) value of 0.874, while the matrix on the right exhibits a \(P_e\) value of 0.714. It is well established that a decrease in \(P_e\) values leads to an increase in the quadratic weighted kappa (QWK) value. Similarly, the comparison presented in Figure 5(b) shows that the \(P_e\) value of the matrix on the left is 0.895, while the \(P_e\) value of the matrix on the right is 0.710. All of the cases have the same observed probability (\(P_o\)) of 0.958. These findings suggest that the \(P_e\) values of the two matrices play a critical role in determining the QWK value.
The QWK behavior in this scenario presents a challenge for decision-makers when determining whether to accept or reject an AES model. As previously discussed, the QWK scores for the agreement tables prior to the exchange of positions between two numbers are significantly lower than the minimum requirement for acceptance according to the AES model. This issue is further compounded by the fact that the kappa values for these tables shift from indicating a moderate agreement to an almost-perfect agreement. This is a significant change in interpretation despite the fact that the number of correct predictions (percent agreement) and the difference in the proportion of agreement between classes (prevalence) remain unchanged. This highlights the potentially problematic nature of relying solely on QWK scores for decision-making in regard to AES models.
5.5 The Number of Raters
In high-stakes testing programs that include writing essays among the various tasks that are measured, it is standard procedure to have multiple raters read and evaluate each of the essays, as outlined in the research of Cohen [9]. The most reliable assessment will occur when all of the responses are scored independently by different raters[2]. The greater the number of independent responses and the more the number of independent ratings of each response, the higher the reliability of the assessment will be. According to Coffman [6], the development of common examinations for English exams, rated by multiple teachers, is essential for ensuring reliability. The study suggests that utilizing two ratings, even if done quickly to allow for a larger number of ratings overall, is preferable to relying on a single rating. To further improve the reliability of rater decisions in the scoring of essays, student responses are generally scored by two or more raters, as highlighted in the research of Johnson [14]. This approach allows for a more thorough and accurate evaluation of the essays, as it takes into account multiple perspectives and ensures that any potential biases or inconsistencies are identified and addressed.
It has been previously noted in prior studies that there may be scenarios where more than two raters are utilized for grading in exams. As exemplified in Breland’s study [2], the criterion variable employed was the sum of scores obtained from four distinct essay tasks, each independently scored by four separate raters. Additionally, Johnson et al. [14] suggested that implementing three raters can also be beneficial, assuming that there is no evidence of rater drift. And it appears reasonable to expect that the reliability of operational scores would be significantly improved by averaging the three scores from the two initial raters and the one expert.
However, one of the main limitations of using kappa statistics to assess interrater agreement is that it is only suitable for analyzing the agreement between not more than two raters. And since weighted kappa only adds weight to the observed agreement and the expected agreement matrices to the original formula of Cohen’s kappa, it is also dealing with the same problem.
If we need to assess interrater agreement among a larger group of raters, we will need to use other alternatives such as Fleiss kappa [11] or Krippendorf’s alpha [15]. These alternatives are specifically designed to accommodate interrater agreement metrics for more than two raters and can provide more reliable and accurate results in these situations.
Fleiss’ kappa, introduced by Joseph L. Fleiss in 1971 [11], is considered an improvement over Cohen’s kappa in situations where there are more than two raters or annotators involved in the assessment process. It is also noteworthy that while Cohen’s kappa presumes that the same pair of raters evaluate a fixed set of items, Fleiss’ kappa accommodates for variations in the composition of raters, as a fixed number of raters (e.g., three) may be assigned to varying items. Meanwhile, Krippendorff’s alpha is a generalization of several known reliability indices that enables researchers to judge a variety of data with the same reliability standard. This coefficient can be applied to any number of observers, not just two, and any number of categories, scale values, or measures. Additionally, it can be used with any metric or level of measurement, including nominal, ordinal, interval, ratio, and more. Krippendorff’s alpha is also suitable for handling incomplete or missing data and can be used with large and small sample sizes without requiring a minimum sample size. Overall, Krippendorff’s alpha is a versatile and useful tool for assessing the reliability of different types of data.
Nevertheless, if we want to continue using kappa statistics for this specific scenario, an alternative method is to employ the calculation of pairwise averages. This approach involves determining the kappa value between rater 1 and rater 2, subsequently computing the kappa value between rater 2 and rater 3, and finally, determining the kappa value between rater 1 and rater 3. The overall inter-rater agreement is then derived by taking the mean of the three kappa agreement results. This methodology allows for a more comprehensive understanding of the agreement among raters, as it takes into account multiple pairwise comparisons. It is important to choose the appropriate metric based on the specific needs and requirements of the study in order to obtain accurate and reliable results.
6. DISCUSSION
In the preceding section, a series of experiments were conducted to thoroughly examine the behavior of Quadratic Weighted Kappa (QWK) across a range of different scenarios. Our findings demonstrate that QWK is particularly sensitive to the rating scale, with its value varying significantly in response to changes in the range of scores. The main problem is that the scores given by the two raters may be consistent, but the method used to calculate the final score can lead to inconsistencies in the acceptance of the essay scoring model. We discussed a strategy for mitigating the impact of the rating scale by changing the weights in the kappa formula. The Linear Weighted Kappa (LWK) method was found to be the most balanced method for dealing with rating scales, and it is important for decision-makers to establish a new threshold for acceptable performance criteria.
Additionally, we observed that when used in conjunction with acceptance rates of essay scoring models, the paradox of kappa can produce undesirable effects. Scoring models that perform well in terms of percent agreement or accuracy scores may not be as satisfactory when evaluated by kappa, owing to the model’s inability to outperform random guessing, as the kappa statistic takes into account the possibility of agreement occurring by chance.
Furthermore, it is also crucial to consider the impact of the prevalence of an agreement matrix. Our initial experimentation yielded results that align with previous findings, as reported by Byrt et al. (1993), which suggest that as the Prevalence Index (PI) increases, the Pe value also increases, resulting in a decrease in the kappa value. This finding has significant implications for the decision-making process when evaluating the acceptance of an AES model. We developed a score prediction model for predicting scores for an essay scoring dataset (prompt 4 ASAP dataset). Despite the model’s satisfactory performance in terms of the number of correct predictions, it was ultimately rejected due to a decrease in the Quadratic Weighted Kappa (QWK) value that fell below the acceptance threshold. This decline in QWK was observed as the proportion of the difference in agreement between classes increased, highlighting the importance of considering the prevalence of an agreement matrix in the evaluation of AES models.
In our study, we discovered that the correlation between prevalence and kappa for agreement tables with dimensions greater than 2x2 deviates from the pattern previously outlined in Byrt et al.’s study (1993). Specifically, we found that there is no definitive relationship between prevalence and kappa, as the behavior of kappa is highly dependent on the distribution of majority agreements within the matrix. Specifically, if the majority agreements are concentrated in the middle of the diagonal, the value of kappa will decrease, whereas if the majority agreements are located on the edges of the diagonal, the value of kappa will increase. This finding highlights the unpredictability of kappa’s behavior when prevalence is held constant, and it highlights the need for caution when evaluating the performance of an AES model. Educational institutions considering the implementation of an AES system for essay score prediction should take this unpredictability into account when assessing the model’s performance and determining whether to accept or reject its use.
Lastly, we must acknowledge that the use of kappa statistics is limited by the number of raters it can handle. Kappa is only suitable for assessing inter-rater agreements between up to two raters. For evaluating inter-rater agreement in scenarios involving more than two raters, alternative metrics such as Krippendorf’s alpha or Fleiss kappa must be employed. An alternative method for using kappa statistics in this specific scenario is to calculate pairwise averages by determining the kappa value between each pair of raters and taking the mean of the results for a more comprehensive understanding of agreement among raters. It is important to choose the appropriate metric based on the specific needs and requirements of the study in order to obtain accurate and reliable results.
The recommendation to use multiple evaluation metrics is indeed a common practice in ML. However, in the specific context of AES, we believe there is a lack of consensus on which metrics to use. Our paper provides guidance and specific recommendations on which metrics and strategies are appropriate to mitigate different limitations of QWK in AES contexts.
7. CONCLUSION
This study examined the use of quadratic weighted kappa (QWK) as the primary evaluation metric for automated essay scoring (AES) systems. Through various experiments, we identified several limitations of QWK for its use in the context of AES, including its sensitivity to the rating scale, the occurrence of the kappa paradox, the impact of the number of agreements, and its limitation in handling a large number of raters. These characteristics of QWK can affect the acceptability of an AES system.
In summary, relying solely on QWK as the evaluation metric for AES performance may not be sufficient. It is important to consider multiple evaluation metrics when assessing the effectiveness of a model or approach. This is because different metrics can provide different insights into the performance of the model. Relying solely on one evaluation metric may not provide a complete or accurate picture of the model’s performance. Additionally, using multiple evaluation metrics can increase the robustness and comprehensiveness of the evaluation, ultimately leading to more confident conclusions.
8. REFERENCES
- D. Boulanger and V. Kumar. Deep learning in automated essay scoring. In International Conference on Intelligent Tutoring Systems, pages 294–299. Springer, 2018.
- H. M. Breland. The direct assessment of writing skill: A measurement review. college board report no. 83-6. 1983.
- H. Brenner and U. Kliebsch. Dependence of weighted kappa coefficients on the number of categories. Epidemiology, pages 199–202, 1996.
- T. Byrt, J. Bishop, and J. B. Carlin. Bias, prevalence and kappa. Journal of clinical epidemiology, 46(5):423–429, 1993.
- H. Chen and B. He. Automated essay scoring by maximizing human-machine agreement. In Proceedings of the 2013 Conference on Empirical Methods in Natural Language Processing, pages 1741–1752, 2013.
- W. E. Coffman. On the reliability of ratings of essay examinations in english. Research in the Teaching of English, 5(1):24–36, 1971.
- J. Cohen. A Coefficient of Agreement for Nominal Scales. Educational and Psychological Measurement, 20(1):37–46, 1960.
- J. Cohen. Weighted kappa: nominal scale agreement provision for scaled disagreement or partial credit. Psychological bulletin, 70(4):213, 1968.
- Y. Cohen. Estimating the intra-rater reliability of essay raters. In Frontiers in Education, volume 2, page 49. Frontiers Media SA, 2017.
- A. Doewes and M. Pechenizkiy. On the limitations of human-computer agreement in automated essay scoring. International Educational Data Mining Society, 2021.
- J. L. Fleiss. Measuring nominal scale agreement among many raters. Psychological bulletin, 76(5):378, 1971.
- P. Graham and R. Jackson. The analysis of ordinal agreement data: beyond weighted kappa. Journal of clinical epidemiology, 46(9):1055–1062, 1993.
- R. Johnson, J. Penny, and C. Johnson. A conceptual framework for score resolution in the rating of performance assessments: The union of validity and reliability. In annual meeting of the American Educational Research Association, New Orleans, LA, 2000.
- R. L. Johnson, J. Penny, and B. Gordon. Score resolution and the interrater reliability of holistic scores in rating essays. Written Communication, 18(2):229–249, 2001.
- K. Krippendorff. Computing krippendorff’s alpha-reliability. 2011.
- J. R. Landis and G. G. Koch. The measurement of observer agreement for categorical data. biometrics, pages 159–174, 1977.
- J. Liu, Y. Xu, and Y. Zhu. Automated essay scoring based on two-stage learning. arXiv preprint arXiv:1901.07744, 2019.
- R. Morris, P. MacNeela, A. Scott, P. Treacy, A. Hyde, J. O’Brien, D. Lehwaldt, A. Byrne, and J. Drennan. Ambiguities and conflicting results: the limitations of the kappa statistic in establishing the interrater reliability of the irish nursing minimum data set for mental health: a discussion paper. International journal of nursing studies, 45(4):645–647, 2008.
- A. Sharma, A. Kabra, and R. Kapoor. Feature enhanced capsule networks for robust automatic essay scoring. In Joint European Conference on Machine Learning and Knowledge Discovery in Databases, pages 365–380. Springer, 2021.
- J. Shin and M. J. Gierl. More efficient processes for creating automated essay scoring frameworks: A demonstration of two algorithms. Language Testing, 38(2):247–272, 2021.
- K. Taghipour and H. T. Ng. A neural approach to automated essay scoring. In Proceedings of the 2016 conference on empirical methods in natural language processing, pages 1882–1891, 2016.
- Y. Wang, Z. Wei, Y. Zhou, and X.-J. Huang. Automatic essay scoring incorporating rating schema via reinforcement learning. In Proceedings of the 2018 conference on empirical methods in natural language processing, pages 791–797, 2018.
- M. J. Warrens. Weighted kappa is higher than cohen’s kappa for tridiagonal agreement tables. Statistical Methodology, 8(2):268–272, 2011.
- M. J. Warrens. Some paradoxical results for the quadratically weighted kappa. Psychometrika, 77(2):315–323, 2012.
- D. M. Williamson, X. Xi, and F. J. Breyer. A framework for evaluation and use of automated scoring. Educational Measurement: Issues and Practice, 31(1):2–13, 2012.
- R. Yang, J. Cao, Z. Wen, Y. Wu, and X. He. Enhancing automated essay scoring performance via fine-tuning pre-trained language models with combination of regression and ranking. In Findings of the Association for Computational Linguistics: EMNLP 2020, pages 1560–1569, 2020.
- S. Zec, N. Soriani, R. Comoretto, and I. Baldi. Suppl-1, m5: high agreement and high prevalence: the paradox of cohen’s kappa. The open nursing journal, 11:211, 2017.
- T. Zesch, M. Wojatzki, and D. Scholten-Akoun. Task-independent features for automated essay grading. In Proceedings of the tenth workshop on innovative use of NLP for building educational applications, pages 224–232, 2015.
1https://www.kaggle.com/c/asap-aes
© 2023 Copyright is held by the author(s). This work is distributed under the Creative Commons Attribution-NonCommercial-NoDerivatives 4.0 International (CC BY-NC-ND 4.0) license.