ABSTRACT
Prediction of student performance in Introductory programming courses can assist struggling students and improve their persistence. On the other hand, it is important for the prediction to be transparent for the instructor and students to effectively utilize the results of this prediction. Explainable Machine Learning models can effectively help students and instructors gain insights into students’ different programming behaviors and problem-solving strategies that can lead to good or poor performance. This study develops an explainable model that predicts students’ performance based on programming assignment submission information. We extract different data-driven features from students’ programming submissions and employ a stacked ensemble model to predict students’ final exam grades. We use SHAP, a game-theory-based framework, to explain the model’s predictions to help the stakeholders understand the impact of different programming behaviors on students’ success. Moreover, we analyze the impact of important features and utilize a combination of descriptive statistics and mixture models to identify different profiles of students based on their problem-solving patterns to bolster explainability. The experimental results suggest that our model significantly outperforms other Machine Learning models, including KNN, SVM, XGBoost, Bagging, Boosting, and Linear regression. Our explainable and transparent model can help explain students’ common problem-solving patterns in relationship with their level of expertise resulting in effective intervention and adaptive support to students.
Keywords
1. INTRODUCTION
Introductory programming courses (CS1) have been observing a constant surge in interest and enrolment of students in recent years [38]. With this growing interest in Computer Science, the number of students struggling and dropping out of courses is also increasing [16, 37, 49]. Automated prediction systems can help to prevent this by predicting student performances and enabling instructors to intervene effectively [20, 46, 52].
Early methods to predict student performances in CS1 exploited different static approaches based on student starting data such as age, gender, grades, etc. [1]. However, predicting student performance statically is challenging as their behaviors are dynamic that can change with time [37, 45]. More recently, research on performance prediction focused on data-driven approaches incorporating Machine Learning (ML) techniques [17, 22, 40, 35]. However, most of these approaches do not analyze students’ programming behaviors focusing instead on intermediate assessment data such as quiz scores and midterm exam grades. It prevents these methods from understanding the source of student problems and generalizing over different CS1 courses. Moreover, many courses may not even include any interim exams, as in the case of the dataset used in this study. Moreover, the explainability and transparency of black box ML models are becoming as important as high predictive power. An explainable model can help instructors and students understand the predictions and gain more trust. It can enable instructors to gain insights into students’ problem-solving strategies by understanding the patterns of different students’ programming behaviors. It can also help in effective intervention to help struggling students in the learning process. There are already a few studies that explore explainable performance prediction models in the field of Education [35, 9]. However, to the best of our knowledge, no other study has employed explainable models to analyze student performance based on students’ programming behaviors without considering exam or quiz grades.
In this study, we propose an explainable student performance prediction model that can predict students’ final exam grades from their programming assignment submission data. Predicting final exam grades only from programming assignments is a challenging task since the nature of the final exam can differ from the assignments. We employ a data-driven feature extraction approach to select features representing students’ programming behaviors in a CS1 course. We develop a stacked ensemble regression model to predict students’ final exam grades. Our stacked ensemble model has KNN, SVM, and XGBoost as the base models and Linear regression as the meta-model. We compare the performance with other baseline techniques, including the individual components of our stacked ensemble model: Linear regression, KNN, SVM, and XGBoost, and other ensemble techniques such as Bagging and Boosting. The experimental results suggest that our model significantly outperforms these baseline techniques. Furthermore, we employ SHAP [27], a game-theory-based framework, to explain our model’s predictions based on the importance and impacts of features. We explain students’ performance predictions to understand how each feature contributes to the prediction process of students’ final exam grades at an individual student level and a global level with all the students. This enables us to analyze students’ performance predictions based on their underlying programming behaviors. We also analyze important features and utilize a combination of descriptive statistics and mixture modeling to understand student patterns of behavior. This provides insights for the instructors into different profiles of students’ learning progressions to make informed decisions about intervening with struggling students and provide adaptive support [4].
The main contributions of this study are as follows:
- Building an explainable stacked ensemble model to predict the student performance in the final exam using programming assignment data of students.
- Explaining the predictions of the model at an individual and a global level of different programming information to gain the trust of the stakeholders.
- Analyzing the results of SHAP and important features of the explainable model to profile students based on their behavior and gain insight into their problem-solving strategies and connection to their learning outcomes.
2. RELATED WORK
In this section, we explore different techniques and studies done in the field of student performance prediction and the use of explainable models in programming.
2.1 Student Performance Prediction
Predicting struggling students and their success has been an important area for researchers in intelligent tutoring systems. These studies have different goals, i.e., predicting students’ early success, detecting failing students, detecting dropouts at an early stage, predicting student performance in the final exam, etc.
A systematic review of previous research on student performance predictions was conducted in [40]. The review revealed that most of these studies used features such as cumulative grade point averages (CGPA) and other assessments (quizzes, midterms, etc.). In [22], an open-source predictive platform was developed and used in the at-risk student detection task. The data included demographic and enrollment information and was classified using ML models such as SVM and Linear Regression. In a recent study [17], enrolled students were classified into passing and failing categories using Decision Tree and SVM from features such as quizzes and midterm exam scores. Recognition of at-risk students could be used for early intervention.
Features like weekly assignment scores, midterm exam grades, etc., were used in [10] to predict failing students in an introductory programming course. Another study [21] followed a similar feature set and employed different ML algorithms to verify their effectiveness in student performance prediction. On event-level analysis, such as predicting students’ success in completing programming exercises, [28] used Recent Temporal Patterns and LSTM. Another study [36] predicted early dropout of students for online programming courses. They used features from online platforms, such as student login times, keystroke latency, correctness, etc., for the first time. In [35], students’ early performance was predicted for an introductory programming course from their midterm exam grade, procrastination time, correctness, the total number of logical lines in code, copy-paste information, etc., from an online programming system using XGBoost.
Recently, different Deep Learning frameworks have been noticeably used in students’ success prediction and are increasing. In a recent study [14], an abstract syntax tree (AST)-based embedding model, SANN, showed effectiveness in capturing information from student programming codes. In [51, 30], abstract syntax tree-based and control flow graph-based embedding models were used to predict students’ final exam grades from their programming assignment data. In another recent study [5], CNN and LSTM networks, along with programming code submission metadata, were used to predict student performance on the final exam in an introductory programming course.
However, previous studies proved effective in student performance prediction tasks; we identify different challenges associated with these studies. Static approaches fail to capture the dynamic behavior of students during their learning process. Data-driven approaches followed in prior studies are not generalizable in different programming courses since they differ in the course outline, and interim exams can vary from course to course. Moreover, some introductory programming courses might not include any interim exam at all, as the case with the dataset used in this study, where only programming assignments are available. Furthermore, deep-learning models are becoming popular with time; however, it is challenging to achieve good performance with these models trained on such small classroom-sized datasets [29].
2.2 Explainable Artificial Intelligence (XAI)
XAI helps humans understand a black-box ML model. It interprets a model’s outcomes and explains the reasons behind decisions. XAI algorithms have been extensively used in different areas of research as well as in medical, health care, and clinical data analysis [33, 44, 19], industrial data analysis [2, 39], smart city solutions [47, 12], etc.
Though XAI is becoming a popular approach to interpreting and explaining ML solutions, its effectiveness is relatively unexplored in CS Education and intelligent tutoring systems. In [25], a deep learning-based knowledge tracing model was developed. The model was interpreted using the layer-wise relevance propagation method. A recent work [43] incorporated explainable concepts into computational models for student modeling tasks in computing education; while the work has been exploratory, the performance needs to be further improved for actual deployment. Mu et al. [32] automatically informed the individualized intervention by detecting wheel-spinning students, where students try and repeatedly fail at an educational task based on the number of attempts. Shapley values were used to explain the outcomes of the ML models used, including Linear Regression and XGBoost. In another study [6], university dropout prediction was made using a fully connected deep neural network. The features used in this study included university program-related data, high school performance-related data, matura exam (an exam after secondary school) results, average exam grades, foreign language certificate data, etc. SHAP was used to explain the model results and explain the importance of the features. In [34], student demographic information and clickstream data were used to predict at-risk students with an explainable model using Lime. The explainable model ensures that the personalized intervention should not depend on the demographic data of the students.
In [35], SHAP was used in explaining success prediction from student data such as midterm exam grade, procrastination time, correctness, the total number of logical lines in code, copy-paste information, etc. They used these features to predict whether a student passes or fails a course. Although they used programming information, the model made its predictions primarily based on the grade of the midterm exam, which was the most important feature. Courses without a first-exam grade cannot be properly assisted using their approach. Moreover, they set a hard threshold for passing and failing based on the mean grade of the course, which is not a real-world scenario as different students may follow different distributions [38]. Similarly, in [9], LIME was used to explain ML models to predict student performance from their course information, student data, and features such as clickstream and activity information (quizzes, surveys, etc.).
To the best of our knowledge, no previous study has been done on predicting student success in their final exam from their programming assignment submission information using explainable models to help instructors and students understand why someone is struggling or doing better. Therefore, this study will help in intervention with more transparency and confidence in ML model outcomes.
3. DATASET
In this study, we use a publicly available dataset 1 collected from the CodeWorkout platform. CodeWorkout 2 is an online platform that helps students practice programming in Java and allows instructors to design learning activities in their programming courses [11]. CodeWorkout logs student programming code submission information associated with different assignments. These assignments test the student’s knowledge of basic programming concepts, such as data types, arrays, strings, loops, conditional statements, methods, etc.
The dataset consists of two semesters: Spring 2019 and Fall 2019. The total number of students is 772. Every semester, there are 50 programming assignments. Each assignment submission can get a score in the range of (0, 1). The number of passing test cases determines the score, and a correct submission gets a score of 1. A student can submit each assignment multiple times. The dataset consists of code submissions for each assignment and other relevant information, some of them described in Table 1.
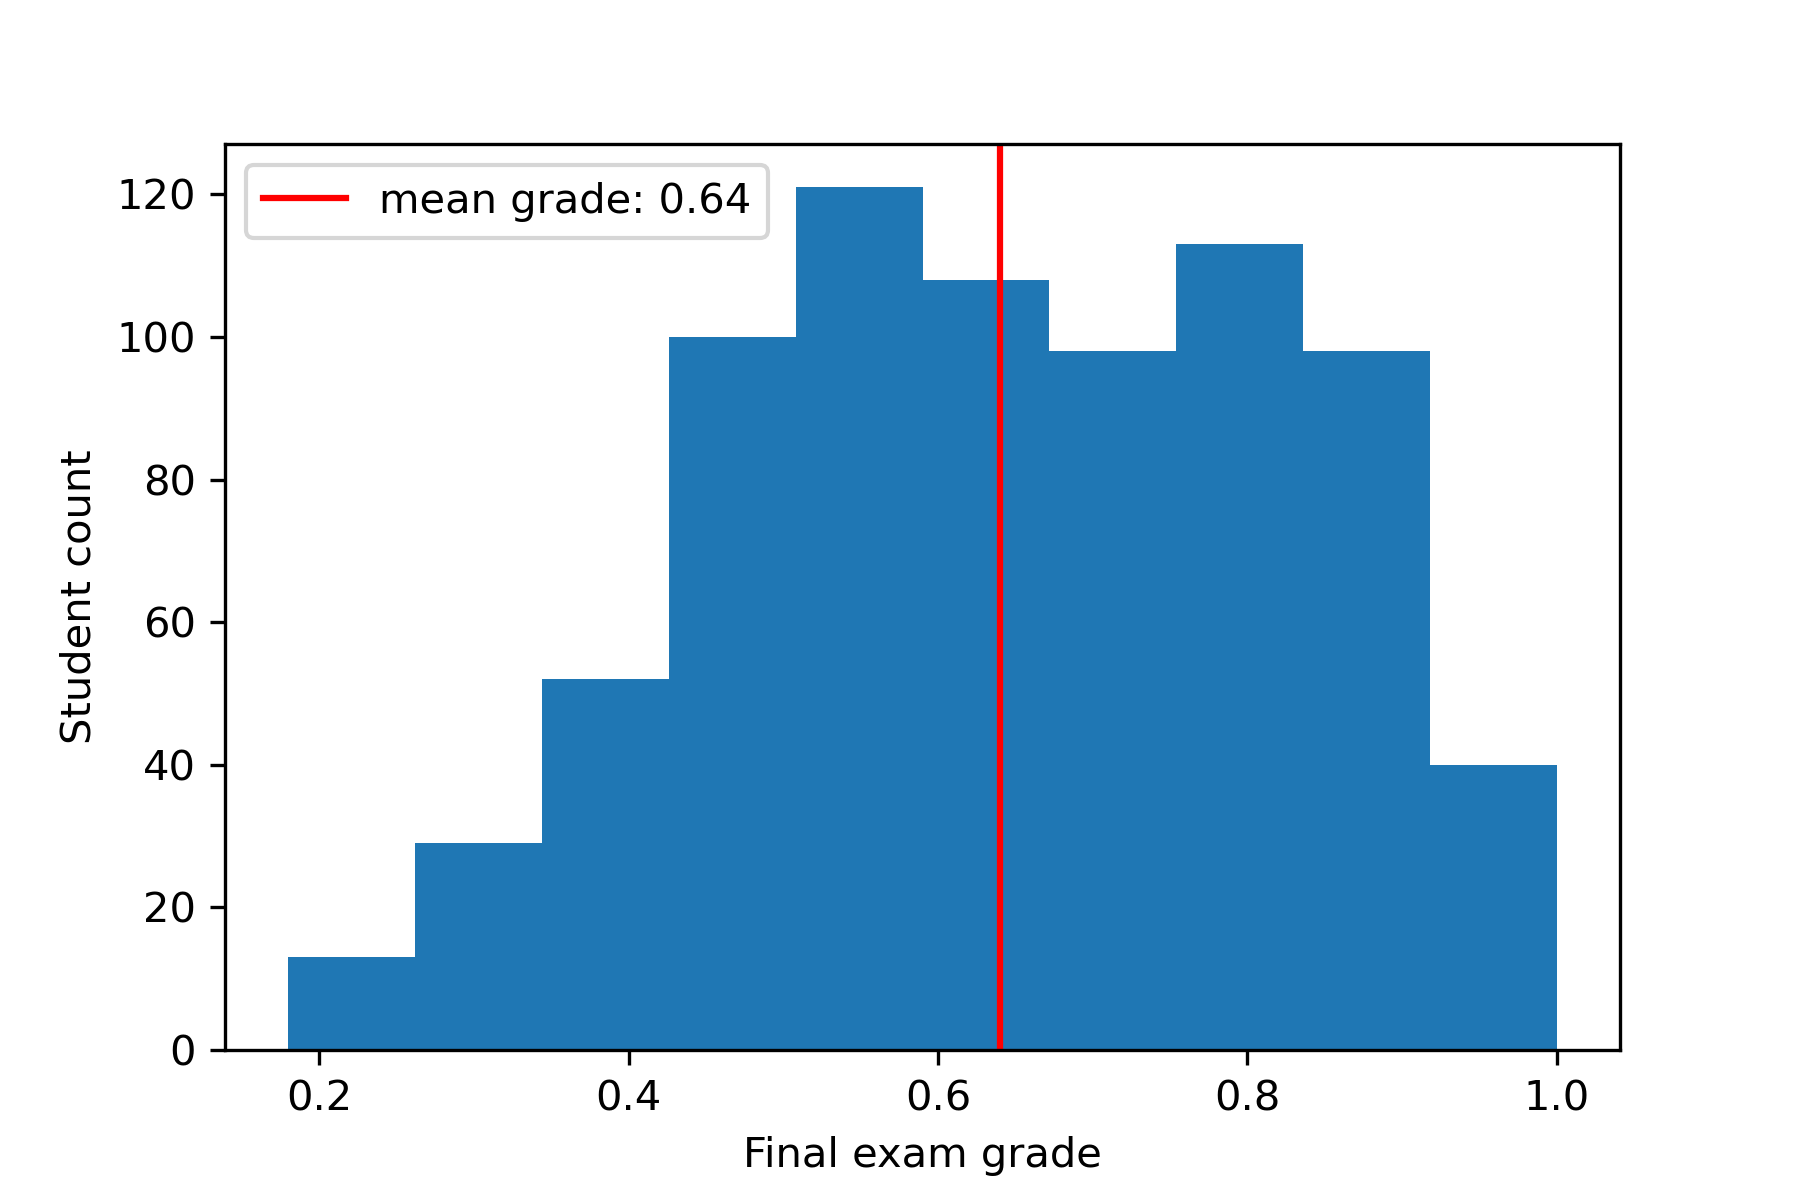
The CodeWorkout dataset also includes students’ final exam grades, scaled between 0 and 1. The final exam grade distribution is illustrated in Figure 1. It also shows the mean final exam grade (0.64 with a standard deviation of 0.18) with a red vertical line. In this study, we try to predict the final exam grades of the students from their programming assignments in a course.
4. METHODOLOGY
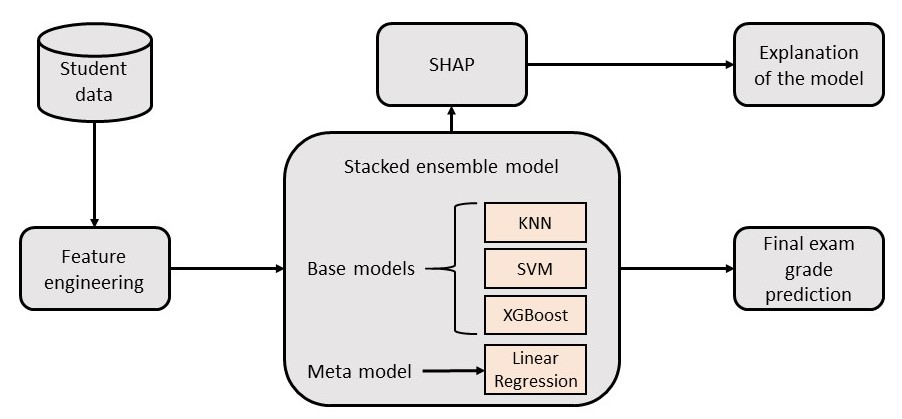
To predict the final exam grades of students based on their programming submission data and explain the predictive model’s predictions, we follow three steps: i) Feature engineering and extracting data-driven features from the programming submission data, ii) Developing and employing regression models to predict the final exam grades, and iii) Using SHAP to explain the model’s decisions. The overall architecture of the model is illustrated in Figure 2.
4.1 Feature Engineering
We select several features associated with students’ programming submissions, including total programming time spent (TimeSpent), number of unique assignments attempted (Valid), number of correct submissions (CorrectSub), number of incorrect submissions (IncorrectSub), number of uncompilable submissions (CompileError), total scores in all submissions (Scores), and total changes in codes (EditDistance). These features are described in detail below. The values of each feature are normalized to fit the range of 0-1, and a statistical description of the features is provided in Table 2.
| Feature | Mean (std) |
|---|---|
| TimeSpent | 0.07 (0.09) |
| Valid | 0.93 (0.11) |
| CorrectSub | 0.41 (0.08) |
| IncorrectSub | 0.15 (0.12) |
| CompileError | 0.16 (0.11) |
| Scores | 0.80 (0.13) |
| EditDistance | 0.32 (0.16) |
- TimeSpent: It is calculated using the ServerTime of each assignment submission. The difference between the first submission for an assignment and the final submission is calculated for each assignment. The total TimeSpent for a student is measured by adding these time differences for all attempted assignments of that student. This represents the amount of time a student has spent on solving the assignments.
- Valid: It counts the number of unique assignments a student attempted out of all 50 assignments. It could be a correct submission or an incorrect one.
- CorrectSub: It is the number of correct compilable submissions out of all the assignments. These submissions pass all the test cases and obtain a score of 1 out of 1.
- IncorrectSub: It is the count of incorrect submissions submitted by a student. These are compilable codes with scores less than 1 and fail some of the test cases.
- CompileError: It is the total number of uncompilable codes a student submits. These codes usually contain one or more syntax errors, and test cases cannot be tested on them. These submissions do not have any scores.
- Scores: Each assignment can have multiple incorrect and correct submissions and, thus, multiple scores. These scores are summed and normalized to have a single score for each assignment. This feature is the summation of the normalized scores of all assignments for a student.
- EditDistance: It is the measure of how much a student has changed the code in subsequent submissions for assignments. It is calculated using the Levenshtein algorithm. Edit distances for all assignments are summed to get an idea of a student’s code change throughout the semester.
4.2 Predictor Model for Prediction
In this study, we develop a stacked ensemble regression model [50] to combine the predictive capabilities of multiple ML models. It uses a meta-learning approach to harness the powers of different models and make a final prediction. This way, the ensemble model can have better predictive power than any single predictor model individually [48]. As there are multiple predictor models, stacking uses another model that learns when to use or trust among the ensemble models.
Stacked ensemble models are different from other ensemble models, such as bagging or boosting models. Bagging is an ensemble model that combines the decision of many decision trees. Unlike bagging, stacked models are typically different in stacking (not all decision trees). In boosting, each ensemble model tries to correct the prediction of the prior models. Unlike boosting, stacking uses another ML model that learns to combine the predictions of the contributing models. In this study, bagging and boosting are used as baseline models.
Therefore, the architecture of a stacked model can be divided into two model categories:
- Base models (Level 0): Models that are stacked and fit on the dataset and whose predictions are combined later.
- Meta model (Level 1): Model that learns how to combine and trust the predictions of the base models.
This study uses KNN, SVM, and XGBoost [15] as the base models and linear regression as a metamodel to combine the predictions of the base models. While choosing the base models, diverse ML models are employed that make different assumptions regarding the prediction task. On the other hand, the meta-model is typically simpler to provide a smooth interpretation of the predictions made by the base models.
The meta-model is trained on the predictions made by the base models on hold-out data. Hold-out data is a portion of the dataset held out from the base models during training. Afterward, these hold-out data are fed to the base models to get predictions on them. These predictions from the base models on the hold-out data and the expected outputs provide the input and output pairs to train the meta-model. To train the stacked ensemble model properly, we use repeated K-fold cross-validation with 10 folds and 10 repeats.
4.3 Baseline Models
No-skill: We select the mean final exam grade as our no-skill baseline model. This naive model predicts the mean of all the student’s final exam grades with no knowledge of how to make the prediction.
ML models: We also use different models to compare the performance of our stacked ensemble model. We choose the individual baseline models to see the difference in performance between our stacked ensemble model and the baseline models individually. We also use bagging and boosting to see the difference with other ensemble models. We tune the parameters of the models individually using a repeated 10-fold cross-validation approach.
- Linear regression
Linear regression is a simple model which assumes a linear relationship between the inputs and outputs. - K-Nearest Neighbors
KNN stores all the available data points from the training data and predicts from \(k\) neighbors’ target values based on a distance function. We select \(k\) = 20 and use Manhattan distance to find the neighborhood for the best result using repeated 10-fold cross-validation. - Support Vector Machine
SVM can acknowledge the presence of non-linearity in data when used in regression tasks. We set the \(kernel\) to \(rbf\) and the regularization parameter \(C\) to 1 for the best results. - Extreme Gradient Boosting
XGBoost is an efficient gradient-boosting-based ensemble algorithm. It outperforms other ensemble algorithms with its high efficiency and faster nature due to the parallelization of trees. We set the parameters \(max\_depth\) = 6, \(n\_estimator\) = 20, and \(gamma\) = 1 for the best result. - Bagging
Bagging is an ensemble model that combines the output of many decision trees. We set \(n\_estimator\) = 10, and \(max\_features\) = 1 for the best result. - Boosting
We use a Gradient Boosting regressor to represent boosting. In Boosting, each model tries to minimize the error of the prior predictor models. We set \(loss\) to \(squared\_error\), \(learning\_rate\) = 0.1, and \(n\_estimators\) = 100 for the best result.
4.4 Explainable Artificial Intelligence (XAI) Using SHAP
ML models are black boxes in nature. Many applications of ML require explanations of the decisions made by the models depending on the stakeholders. Explanations of the decisions are vital parts of working with populations like students and learners. Such interpretable and explainable models can provide insights into the effectiveness of students’ problem-solving strategies and enable instructors and advanced learning technologies to provide students with effective formative feedback. These can also help in gaining the trust of students and instructors by understanding their reasonings behind such decisions.
SHapley Additive exPlanation (SHAP) [27] is an adaptive algorithm based on the Game theory [41]. In this framework, the variability of predictions is split into the features used in the prediction model. Therefore, the contribution and importance of each feature behind the predictive model (global) and individual predictions (local) can be measured in a model-agnostic way [18].
SHAP calculates Shapley values for each feature for each instance. These values determine the presence of each covariate in the model predictions as a linear combination of each predictor variable. To calculate the positive or negative effect of each feature on the predictions, the algorithm examines the change in each prediction when a feature \(i \in F\) is withheld, where \(F\) is the set of all features [27]. Thus, the feature importance of a feature \(i\) for a model \(f\) is calculated by the evaluation of the marginal contribution \(\Phi _i \in \mathbb {R}\) for all the subsets \(S \subseteq F\). According to [26], to satisfy local accuracy, consistency, and missingness properties, \(\Phi _i\) (Shapley values) defined as: \[\Phi _i = \sum _{S\subseteq F\setminus \{i\}} \frac {\vert S\vert ! (\vert F \vert - \vert S \vert -1)!}{\vert F \vert !} [f_{S\cup \{i\}}(x_{S\cup \{i\}}) - f_S(x_S)]\] Where, \(\Phi _i\) is the marginal contribution of feature \(i\) on the model’s output \(f_{S\cup \{i\}}(x_{S\cup \{i\}})\).
By the additive property, SHAP approximates each prediction \(f(x)\) of the model with the help of \(f’(y’)\) which is a linear combination of all binary variables \(y’ \in \{0, 1\}^N\) (\(N\) is the maximum size for the simplified feature vectors) and the marginal contributions of each feature \(\Phi _i\) in such a way that the sum of all the feature contributions should match the output of \(f\) for a simplified input \(y’\):
\[f(x) = f'(y') = \Phi _0 + \sum _{i=1}^{N} \Phi _i \cdot y'_i \]
Where, \(\Phi _0\) is the expected prediction without any prior information, in our case, the average final exam grades of students. In a nutshell, Shapley values approximate a model’s predictions locally for a given variable \(x\) (local accuracy). It tries to ensure that the contribution of a variable is zero when the variable is zero (missingness). If the contribution of a variable is higher in the model’s prediction, then the Shapley value for that variable should also be higher (consistency).
5. RESULTS
In this section, we evaluate the performance of our proposed stacked ensemble model in students’ final exam grade prediction. Later, we interpret the black-box model by analyzing the importance and impact direction of each of the features using SHAP. We further analyze the influence of the most important features on the final exam grades to categorize students into different profiles based on their performances.
5.1 Evaluation
We compare our results with the base models, the meta-model, and other ensemble models individually. Therefore, we experiment with Linear regression, KNN, SVM, XGBoost, Bagging, and Boosting in the same task. We also use a no-skill model, which predicts the mean final exam grade. This acts as a naive baseline model without prior knowledge of the features. All the models are evaluated using a 10-fold cross-validation approach with ten repeats to get a stable result.
To compare the performances of these models, we measure the root-mean-square error (RMSE) of the predicted final exam grades with respect to the actual final exam grades. Since RMSE follows the same range (0-1) as our final exam grades, it can provide insights into how far the predicted values are from the actual ones. Moreover, it penalizes large errors. This makes it a suitable metric to evaluate the model performances since models with a consistent and stable accuracy level are more useful than models with more errors, and RMSE gives relatively high weight to large errors [51]. We also use \(\mathrm {R^2}\) along with RMSE as the evaluation metric. The coefficient of determination (\(\mathrm {R^2}\)) shows how much of the variation in the dependent variable is accounted for by the independent variables in a regression model.
| Model | RMSE | \(\mathrm {R^2}\) |
|---|---|---|
| no-skill | 0.247 (0.020) | -0.01 (0.018) |
| Linear | 0.185 (0.004) | 0.38 (0.08) |
| KNN | 0.173 (0.004) | 0.37 (0.10) |
| SVM | 0.159 (0.003) | 0.51 (0.10) |
| XGBoost | 0.170 (0.005) | 0.39 (0.09) |
| Bagging | 0.166 (0.004) | 0.44 (0.09) |
| Boosting | 0.161 (0.003) | 0.47 (0.08) |
| Stacked ensemble | 0.151 (0.003) | 0.55 (0.07) |
Table 3 depicts the performances of the regression models based on RMSE values and \(\mathrm {R^2}\) scores. These values are calculated by taking the average of the repeated cross-validation results. The standard deviation of each model is also calculated and shown in parentheses with the average RMSE and \(\mathrm {R^2}\). We can see that all the regression models outperform the naive baseline model with no skill. Our stacked ensemble regression model outperforms all other models with an RMSE of 0.151 and an \(\mathrm {R^2}\) score of 0.55. We further investigate the performance of our model statistically to see if the model’s performance is significantly different from other models. We use the Wilcoxon-signed rank test with a significance level of 0.05. The null hypothesis is that the performance of our model is the same as any other model. The null hypothesis is rejected for all the baseline models (p-value<0.05). Additionally, we test our model’s performance using half of the assignments (first 25 out of 50, ordered with assignment ID). The RMSE value is 0.18 (0.005), and the \(\mathrm {R^2}\) score is 0.41 for our model, which is also higher than other models while using only half of the assignments of the course. These results prove that our model shows statistically significant improvement over the performances of other models.
5.2 Unfolding the Blackbox Model
To better understand the underlying mechanism behind the stacked ensemble model’s predictions, we calculate the Shapley values, values that determine the importance and impact direction of each feature, using the SHAP algorithm. Using SHAP, we can get the interpretation at an individual level for a student as well as a global level for all students. It enables us to understand the model predictions in a transparent way.
5.2.1 Individual Level Explanation
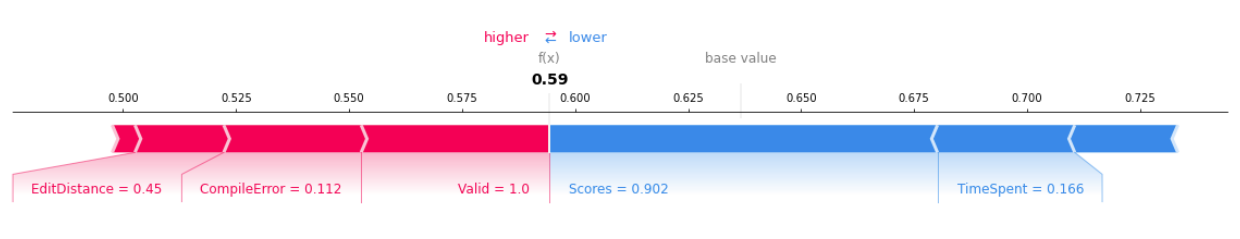
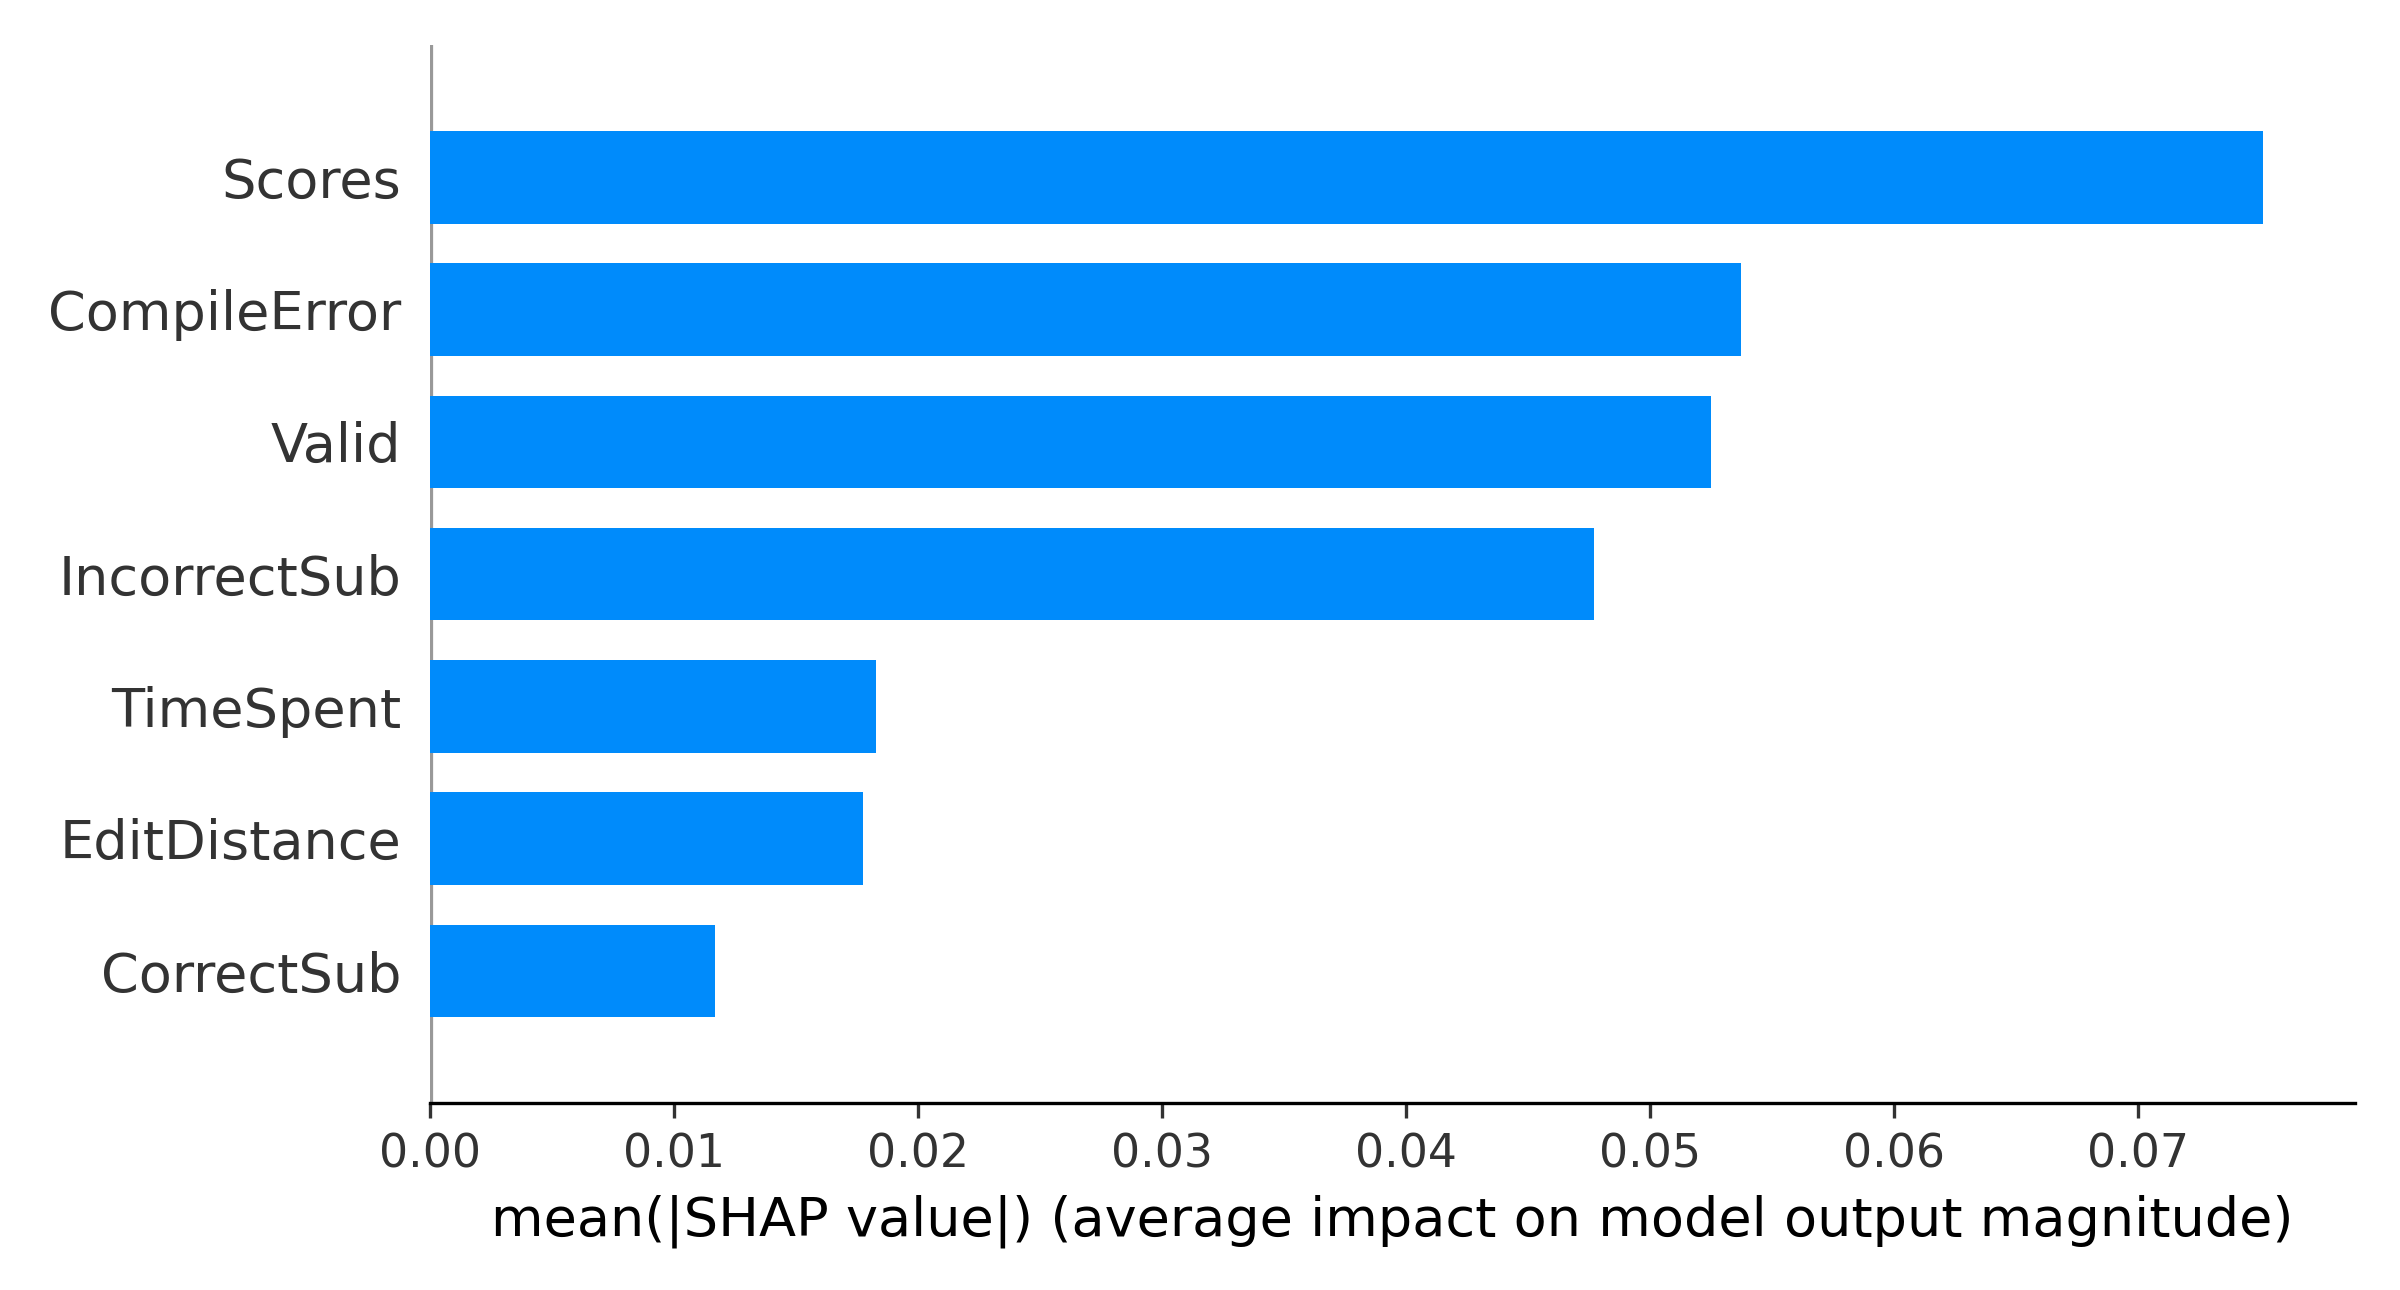
At first, we look at an individual student’s final exam grade prediction made by the model. Figure 3 shows a force plot for an individual student whose actual final exam grade is 0.61. \(f(x)\) is the model’s prediction which is 0.59. The base value is 0.64, which is the mean final exam grade. This is the prediction of the no-skill model if there is no prior knowledge about the features. The plot also shows the most important feature names and their corresponding values for this prediction. The red-colored features pushed the predicted final grade higher, and the blue-colored features pushed the grade lower. The longer the arrow is, the larger the impact of that feature on the decision. Low EditDistance, CompilerError, and high Valid helped the predicted grade to be higher, whereas high Scores and TimeSpent pushed the grade to be lower. We plot the relative importance of features in Figure 4 using SHAP to understand the force plot more clearly and to comprehend the relative importance of features. The X-axis represents the relative importance of the features on the model’s predictions. We can see that Scores is the most important feature, whereas CorrectSub has the least importance.
5.2.2 Global Level Explanation
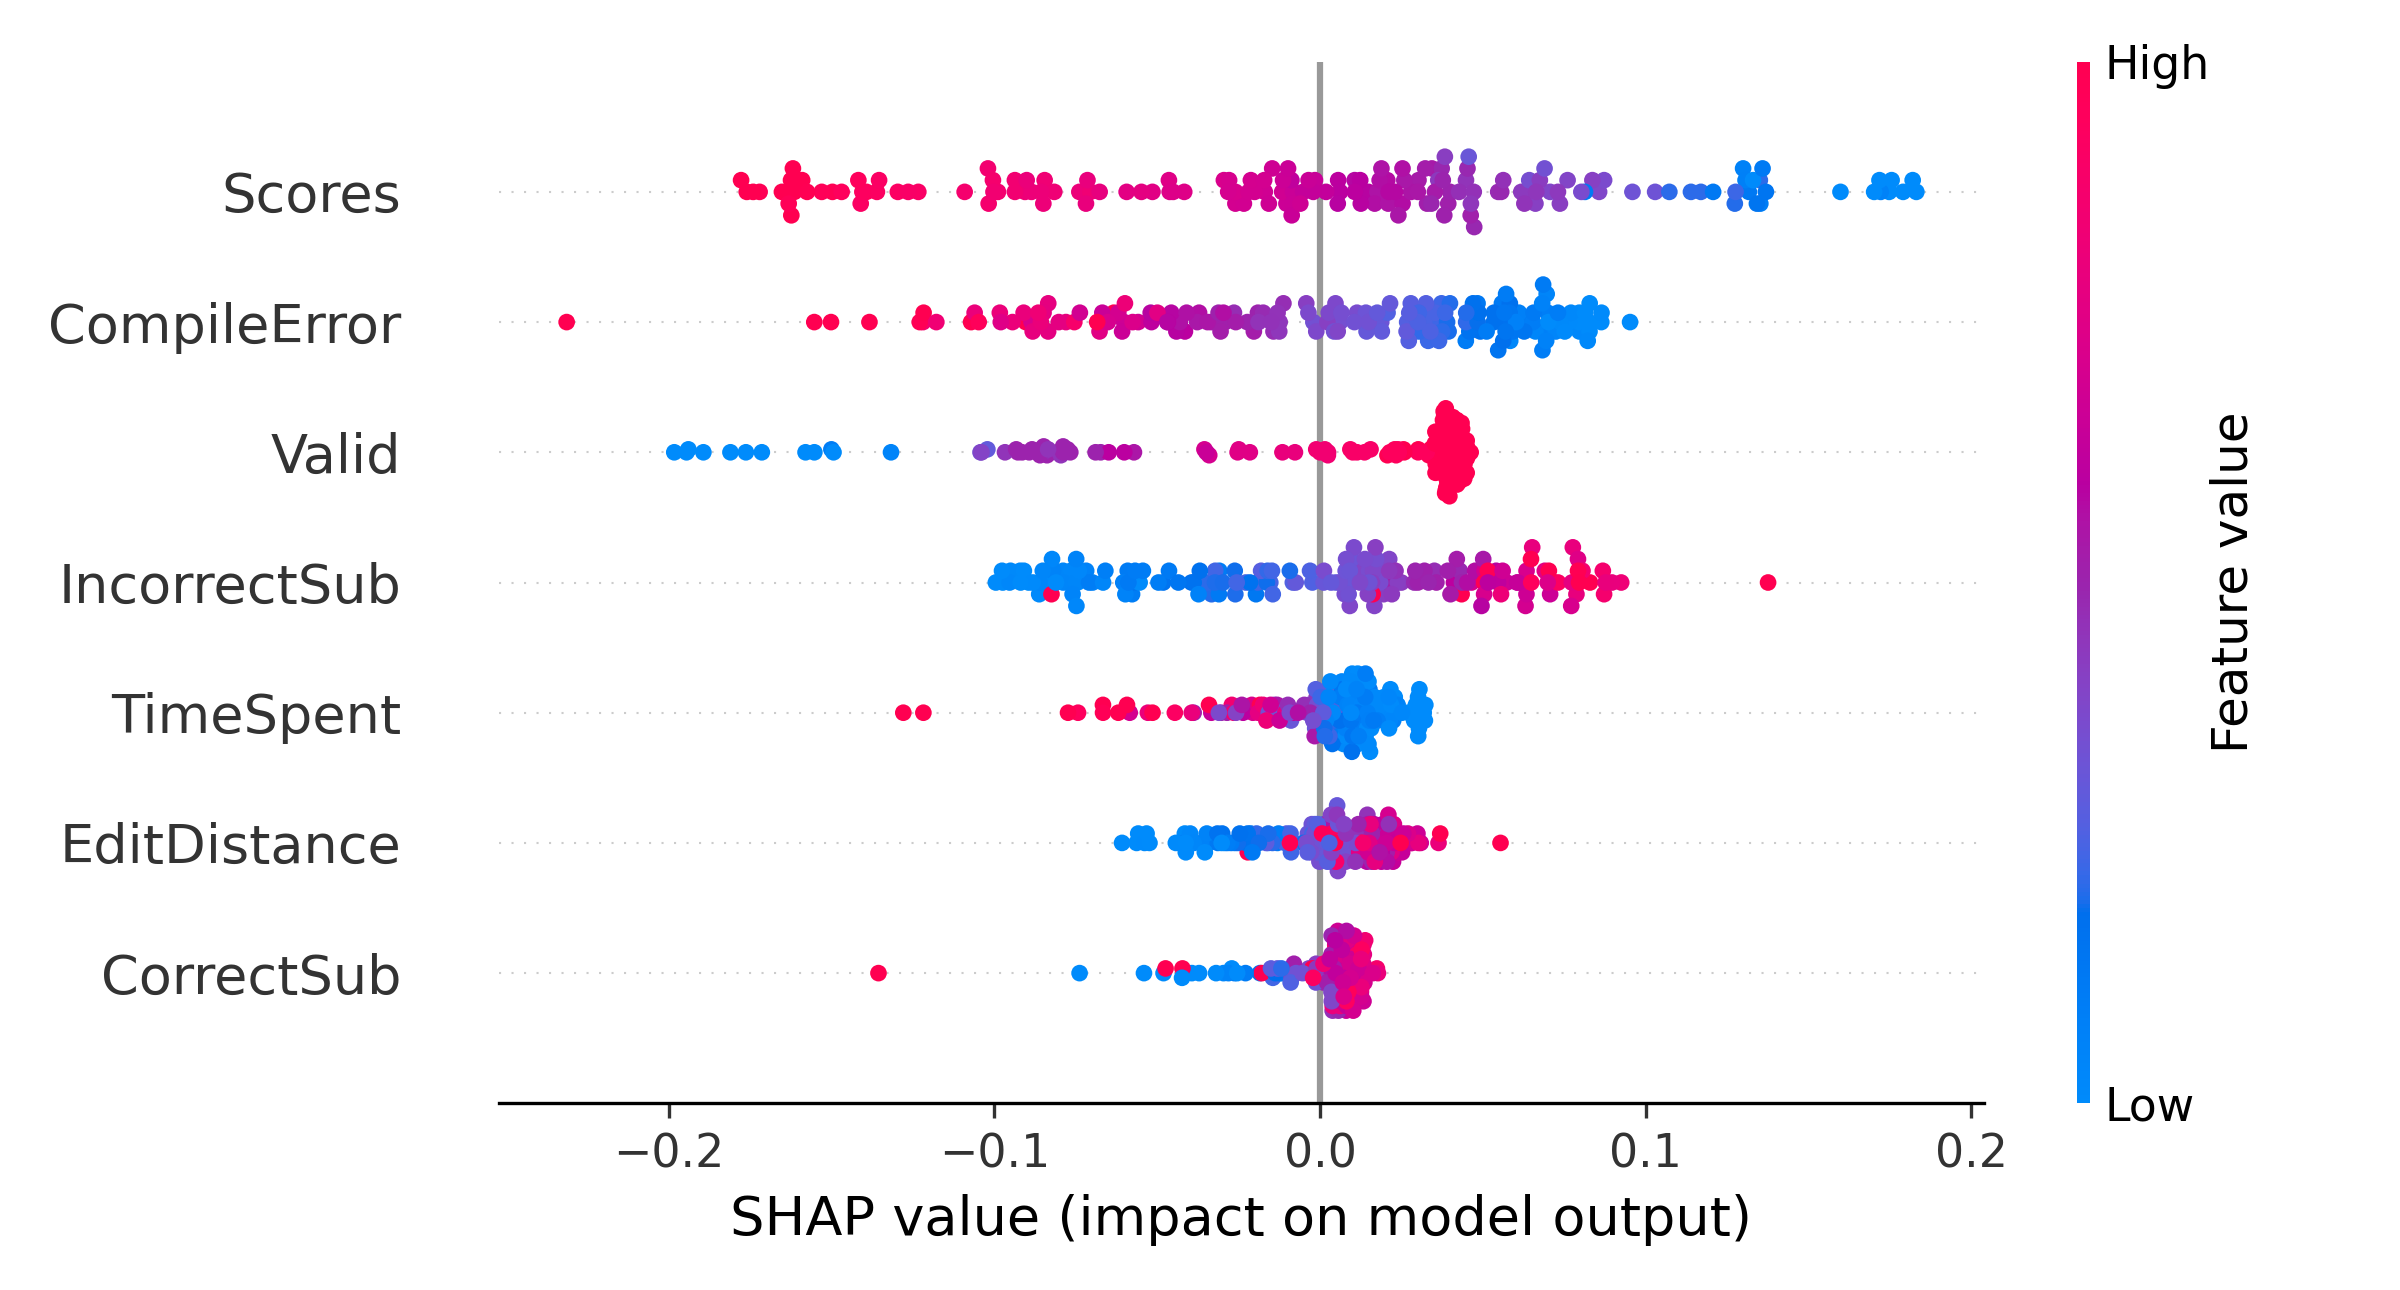
We plot the summary of all the features at a global level for all students to understand the relationship between feature values and predicted values in Figure 5. In the summary plot, the features are ranked by importance. Each point represents the Shapley value for each feature regarding prediction for a single data point. Overlapping points are jittered around the Y-axis to get an idea of the distribution of the Shapley values. Red represents a high value for that feature, and blue represents a low value. The summary plot shows that students with high CompileError, low Valid, high TimeSpent, low EditDistance, and low CorrectSub have negative Shapley values, which correspond to a higher probability of performing poorly in the final exam. Therefore, students with a relatively high number of compiler errors, low number of attempted assignments, high amount of time spent on submitting the assignments, low changes or edits in subsequent submissions, and low number of correct assignments have negative Shapley values, which correspond to a lower final exam grade.
On the other hand, the feature impact of Scores and IncorrectSub on students’ final grades are demonstrated as counterintuitive results based on the summary plot. We can see that some students with lower scores tend to have higher grades in the final exam, while some students with higher scores do not do well in the exam. Similarly, some students with a higher number of incorrect submissions do well in the final exam, while some students with a lower number of incorrect submissions achieve poor grades in the exam. We hypothesize that this observation can be explained by looking more closely at students’ programming behavior, including their average edit distance in each submission. Other prior works have used the edit distance to group students based on their problem-solving behavior and identify effective problem-solving patterns based on each group’s performance [4, 3]. Thus, we hypothesize that the interaction between scores, incorrect submissions, and edit distance can be deterministic of students’ learning. To investigate our hypothesis, we discretized the values for scores and the number of incorrect submissions features into low and high values using Gaussian Mixture Modeling (GMM) [38]. GMM can be used for clustering where probabilistically, each data point is assumed to be generated from a mixture of a finite number of Gaussian distributions where the parameters are unknown. It uses Expectation-Maximization (EM) algorithm to determine these parameters. Each Gaussian distribution is specified by its mean and covariance.
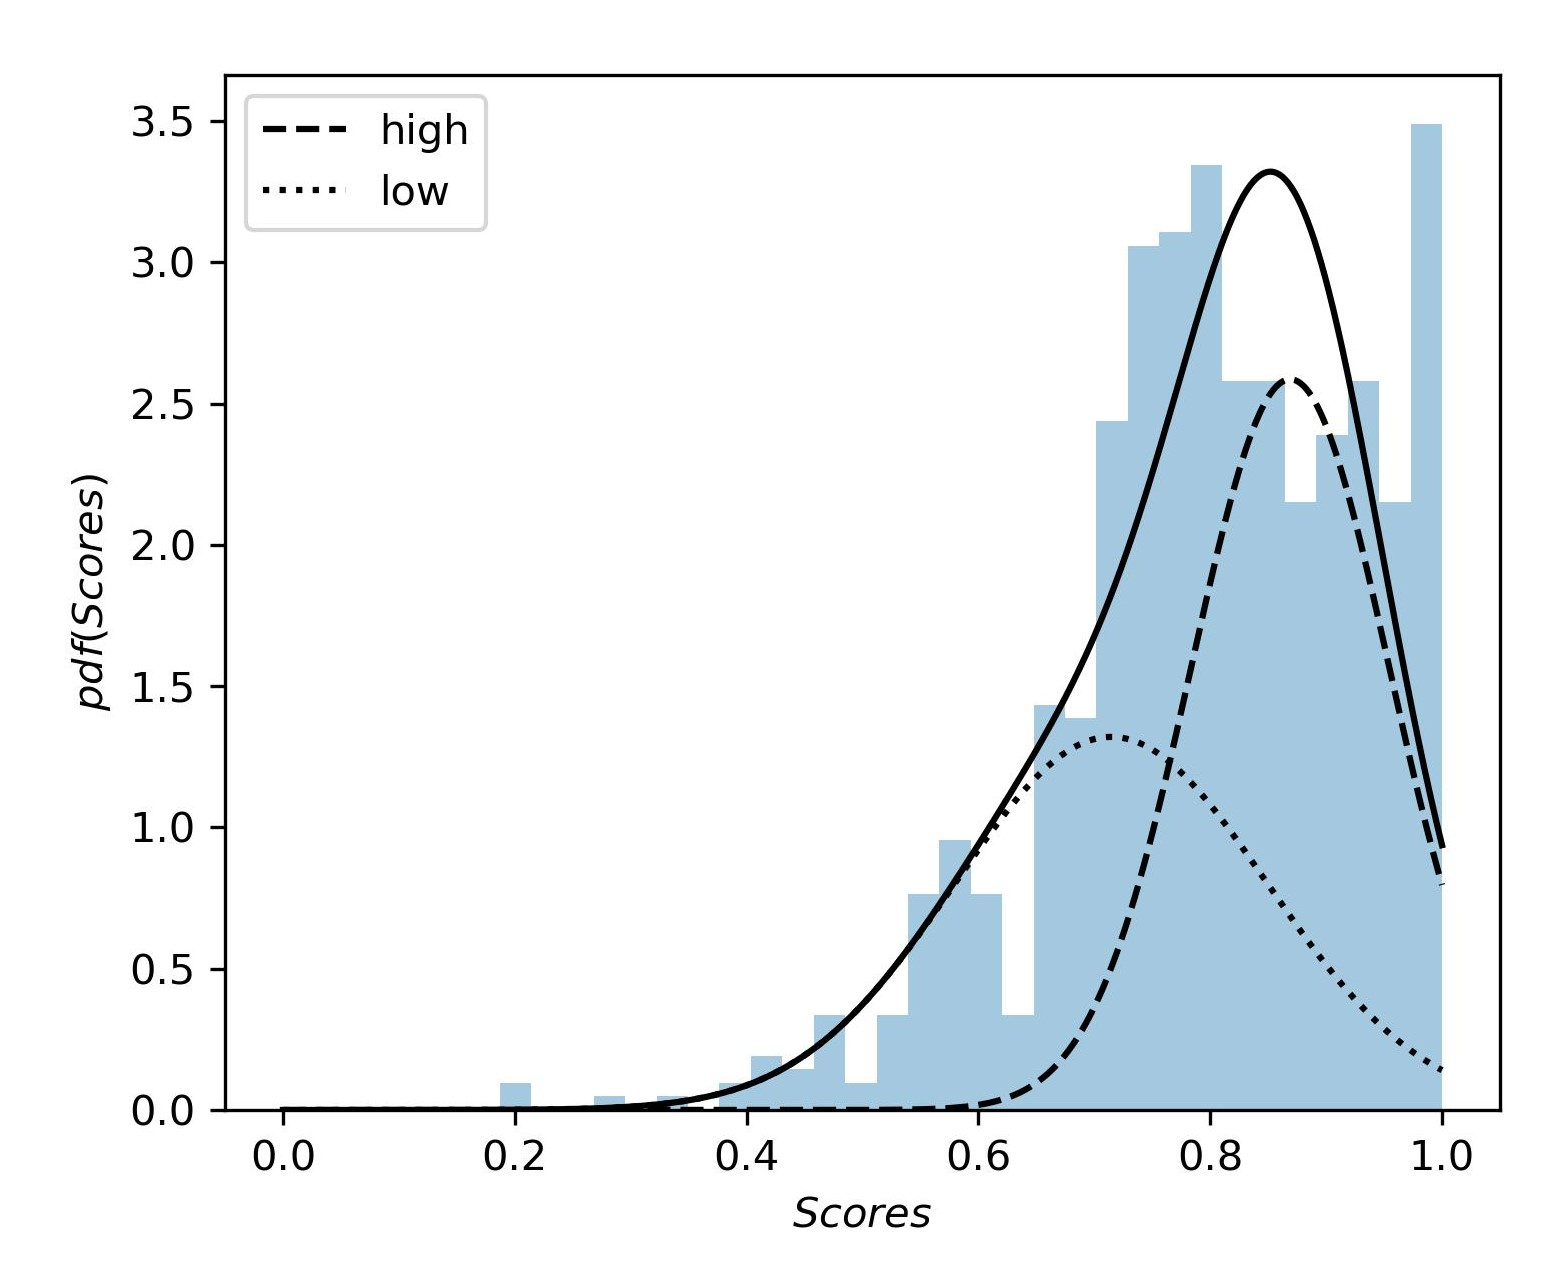
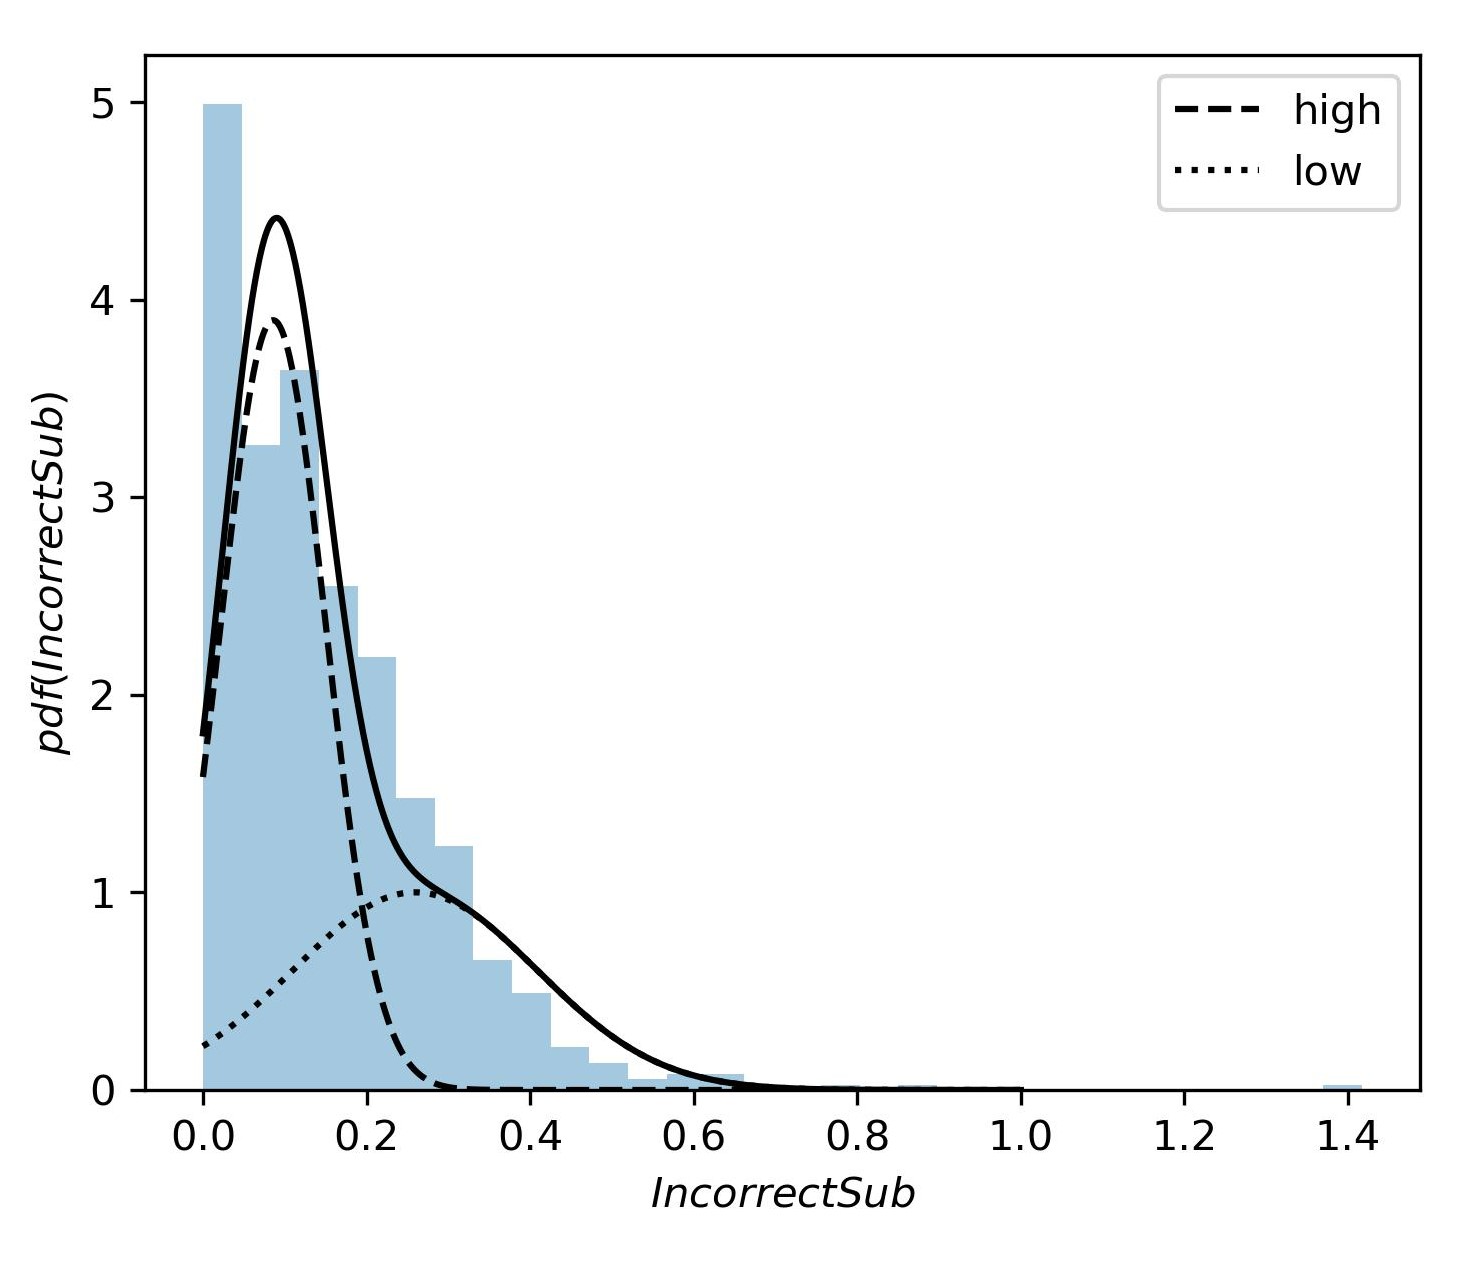
We use Gaussian Mixture Modeling to divide each feature distribution into two components: “component low" and “component high”. Students belonging to “component low" has a relatively lower value, and “component high” has relatively higher values for that individual feature. Figure 6 shows the components of the feature Scores where “component low” has a mean Scores value of 0.71 and “component high” has a mean Scores value of 0.87. Similarly, figure 7 shows the components of the feature IncorrectSub, where “component low" has a mean IncorrectSub value of 0.08, and “component high" has a mean IncorrectSub value of 0.26. From the components of each feature obtained from Gaussian Mixture Modeling, we get the students of “component low" for each feature whose probability of being assigned to “component low" is higher than that of being assigned to “component high". Similarly, we get the students who belong to “component high" for each feature. After investigating the interactions between these two features, students’ final exam grades, and also taking the impact of edit distance into account, we identified three main student profiles and named them with the help of expert CS educators, based on possible values for the number of incorrect submissions and their average programming assignment scores [7, 24, 23]. These profiles are demonstrated in Table 4, along with each profile’s average final grades.
| Scores | IncorrectSub | Student Profile | Final exam mean (std) |
|---|---|---|---|
| low | high | Learning | 0.72 (0.14) |
| low | low | Struggling | 0.60 (0.18) |
| high | low | Expert | 0.80 (0.08) |
| Cheating | 0.48 (0.10) | ||
| high | high | Outlier | 0.68 (0.19) |
5.3 Student Profiling
As discussed previously, we further analyze the explanations of the model’s predictions to profile students based on their learning outcomes and strategies.
5.3.1 Expert or Cheating Students
Students who have a high score and a low number of incorrect submissions on average have a mean final exam grade of 0.58. This grade is 0.06 lower than the overall mean grade (0.64). We hypothesize that students who submit a low number of incorrect submissions with a high score on average are either experts or cheaters cheating from expert students and not learning enough, and thus, we expect to see a noticeable difference between the average final grade for these two sets of students.
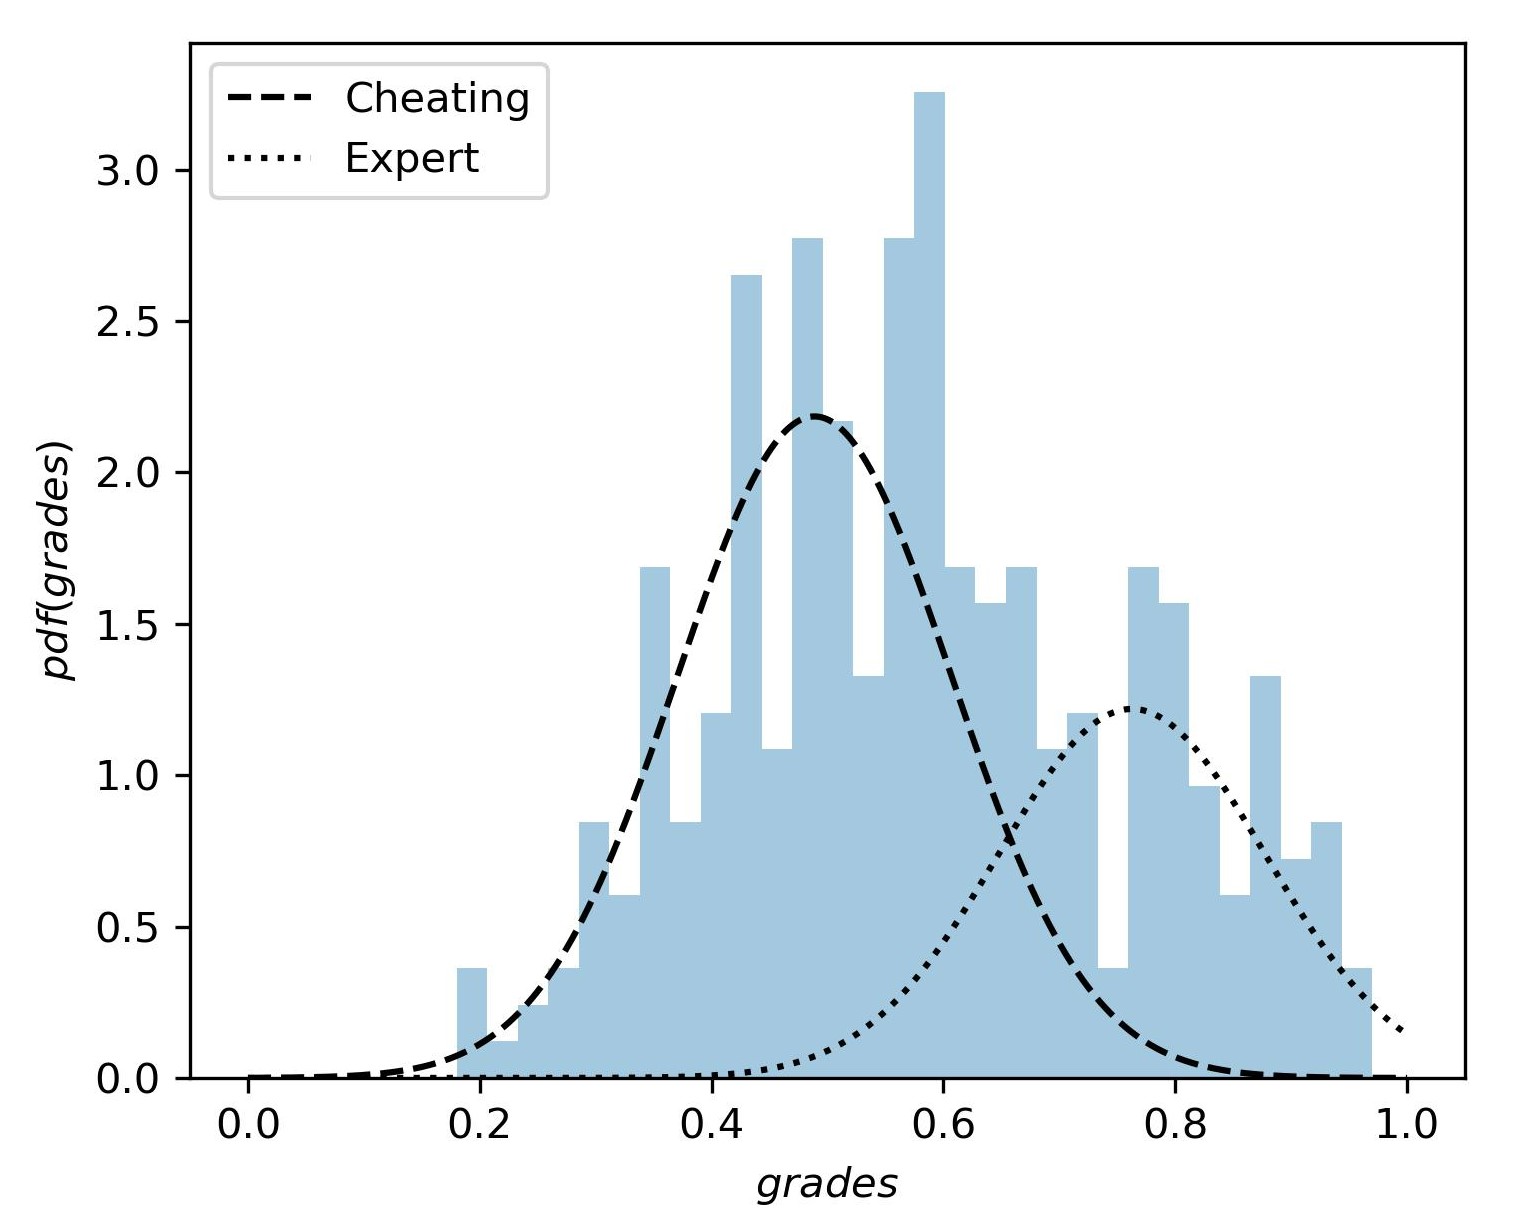
To test this hypothesis, we divide these students into expert and cheating profiles based on their final exam grades and check the mean grades of these two profiles to determine whether there is a significant difference between them. The cheating group has a mean final exam grade of 0.48, and the expert group has a mean final exam grade of 0.80. Moreover, the grades of these two profiles are statistically different with a p-value of less than 0.05. We further verify our hypothesis using Gaussian Mixture Modeling and dividing the final exam grade distribution of this profile into two components [38] as illustrated in Figure 8. The component with a high mean grade (0.79) represents the expert group, and the component with a low mean grade (0.49) represents the cheating group. This is a clear indication that there is a significant difference in the competency of both groups.
5.3.2 Learning Students
The second profile of students we investigate are students with a high number of incorrect submissions and a low score on average. This group has a mean final exam grade of 0.72, which is 0.08 higher than the total average mean grade. About 84% of these students have high edit distance on average. This suggests that students without a solid background knowledge learn through trial and error by attempting different solutions multiple times.
5.3.3 Struggling Students
Students who have a low number of incorrect submissions and lower scores on average are identified as struggling students. This group has a mean final exam grade of 0.6, which is 0.04 points lower than the mean grade of all students. About 89% of these students have low edit distance on average. The mean EditDistance for this group is 0.2 which is 0.12 points lower than the average edit distance for all students. They also have 0.3 points mean for the number of correct submissions which is 0.11 points lower than the average number of correct submissions.
5.3.4 Outlier
The last group of students is students who have a high number of incorrect submissions with a high score on average. This group of students constitutes as low as 10% of the total dataset and, thus, is not investigated further and is not included in any particular profiles.
These results suggest that while expert students can get the desired outcome through a few high-quality attempts, students with moderate levels of knowledge and expertise aim for the desired results through multiple incorrect submissions, attempting new solutions for each submission. On the lower end of the spectrum, struggling students would not put any effort into engaging with the activities as demonstrated through a low number of submissions with a low score on average. These analytical results explain why features Scores and IncorrectSub have an atypical effect on the model’s predictions.
On the whole, our stacked ensemble model can effectively predict students’ final exam grades using their programming assignment information. The results from incorporating the SHAP model can shed light on students’ problem-solving strategies and the connection between those strategies and students’ learning outcomes. Utilizing an explainable model to perform prediction of students’ performance can help instructors and advanced learning technologies make informed decisions about effective interventions based on students’ progress and problem-solving patterns in a timely manner.
6. DISCUSSION
Introductory programming classes are growing rapidly while being one of the most challenging subjects for students. Thus, it is important to build automated approaches that enable instructors and educators to provide students with timely pedagogical support. We need to design generalizable and interpretable prediction models that can predict students’ performance while analyzing their problem-solving behavior. However, predicting student performance in an introductory programming course, such as predicting the final exam grades solely based on programming data is a challenging task, given that the nature of the final exam differs from hands-on programming assignments. Prior research has used conventional classroom data such as tests, exams, and multiple choice grades to predict students’ final exam grades. On the other hand, including programming features have been shown to improve the prediction results in computer science courses [35]. While the exam grades can certainly improve the results, it is not always accessible to the CSEDM models due to limitations in data collection, such as data privacy. Furthermore, different introductory programming classes might have different outlines and grading mechanisms, while almost all of them include programming assignments. Thus, our model can be generalized to any introductory programming course regardless of its outline since it merely relies on programming assignment data.
Integrating our approach in a classroom can offer valuable benefits to both students and instructors. First, the explainable stacked ensemble model developed in this study can help identify struggling students by predicting their final exam grades based on their programming assignment data. By identifying struggling students, instructors can offer targeted interventions and support to help them improve their learning outcomes. Second, the explanations of the model’s predictions using the SHAP algorithm can help students and instructors understand the model’s decision-making process. This understanding can help build trust in the model’s predictions. Additionally, the study’s interpretation of the SHAP results as profiles that group students based on their problem-solving strategy patterns can provide valuable insights into students’ problem-solving behavior and learning outcomes [13, 23]. This information can help instructors develop personalized teaching strategies that cater to each group’s unique needs, thus enabling more effective interventions and support [8, 31, 42].
There are a few limitations in this work. First, our dataset did not allow for early prediction of students’ performance since students could have attempted the assignments in an arbitrary order at any point in time. However, we trained our model with a subset of assignments to test the generalizability of the model in courses where fewer assignments are available. Our model outperformed other baselines significantly with fewer numbers of assignments. Additionally, the dataset used in this study has potential plagiarism issues. Plagiarism affects the performance of our model because programming submission information and problem-solving pattern do not convey the actual information about the cheating students’ learning. Moreover, the dataset lacks sufficient contextual information related to the course and the CodeWorkout implementation. In particular, there is no information on dropped-out students and students who missed the final exam. The final exam grades of these students are stated as zero (less than 1% of the dataset), which might affect the performance of a predictive model.
7. CONCLUSION
In this study, we extracted important data-driven features from students’ programming submissions that can be representative of students’ problem-solving behavior and utilized them to predict students’ performance. Furthermore, we developed an explainable stacked ensemble model that can predict students’ final exam grades from their programming assignment information. Our model could significantly outperform baseline models, including Linear regression, KNN, SVM, XGBoost, Bagging, and Boosting. The predictions made by our model were explained using the SHAP algorithm that shows the importance and direction of impacts for each feature with regard to the predictions. We have provided explanations of the decisions made by the model at two levels: explanations of the decision for a student at an individual level and explanations of the overall predictions at a global level. This explanation can help students and instructors to understand the model’s predictions and make it trustworthy. We used a combination of descriptive statistical analysis and mixture models to interpret the SHAP results as profiles that group students based on their problem-solving strategy patterns. This enables us to gain insights into students’ problem-solving behavior and connection to their learning outcomes.
In the future, we intend to utilize our model for early prediction by training it on a dataset where students’ attempts at assignments follow a specified order. This will also facilitate analyzing student profiles, programming-solving behaviors, and patterns at different stages of the course time. Moreover, investigating students’ problem-solving strategies for individual assignments with different difficulties might help us to understand students’ struggles associated with different concepts represented by each assignment. In this study, student profiling was used by discretizing the students into two components (low and high) based on each feature value to analyze the SHAP values where feature impact on the predictions was not straightforward and counterintuitive. Nonetheless, if we consider more than two components for each feature for a more complex student body, more student profiles might emerge in the interpretation process based on the feature interactions. We intend to explore more complex situations and analyze explanations obtained from SHAP with more granular student profiles in the future. Furthermore, we intend to conduct in-depth studies to detect plagiarism and cheating in students’ programming codes. This includes strategies for similarity analysis and anomaly detection. For instance, we can assess the similarity between two codes through program embedding approaches where the structural information of each program is captured through vectors. Moreover, we can analyze students’ normalized submission rate distributions to identify odd patterns for a particular assignment to gain insights into the likelihood of students committing plagiarism over the course of time.
8. REFERENCES
- A. Ahadi, R. Lister, H. Haapala, and A. Vihavainen. Exploring machine learning methods to automatically identify students in need of assistance. In Proceedings of the 11th Annual International Conference on International Computing Education Research, pages 121–130, 2015.
- I. Ahmed, G. Jeon, and F. Piccialli. From artificial intelligence to explainable artificial intelligence in industry 4.0: a survey on what, how, and where. IEEE Transactions on Industrial Informatics, 18(8):5031–5042, 2022.
- B. Akram, W. Min, E. Wiebe, B. Mott, K. E. Boyer, and J. Lester. Improving stealth assessment in game-based learning with lstm-based analytics. In Proceedings of the International Conference on Educational Data Mining, pages 208–218, 2018.
- B. Akram, W. Min, E. Wiebe, B. Mott, K. E. Boyer, and J. Lester. Assessing middle school students’ computational thinking through programming trajectory analysis. In Proceedings of the 50th ACM Technical Symposium on Computer Science Education, pages 1269–1269, 2019.
- N. Alam, H. Acosta, K. Gao, and B. Mostafavi. Early prediction of student performance in a programming class using prior code submissions and metadata. In Proceedings of the 6th Educational Data Mining in Computer Science Education (CSEDM) Workshop, pages –, 2022.
- M. Baranyi, M. Nagy, and R. Molontay. Interpretable deep learning for university dropout prediction. In Proceedings of the 21st Annual Conference on Information Technology Education, pages 13–19, 2020.
- M. S. Boroujeni and P. Dillenbourg. Discovery and temporal analysis of latent study patterns in mooc interaction sequences. In Proceedings of the 8th International Conference on Learning Analytics and Knowledge, pages 206–215, 2018.
- A. Boubekki, S. Jain, and U. Brefeld. Mining user trajectories in electronic text books. In the 11th International Conference on Educational Data Mining (EDM), pages 147–156, 2018.
- H.-C. Chen, E. Prasetyo, S.-S. Tseng, K. T. Putra, S. S. Kusumawardani, and C.-E. Weng. Week-wise student performance early prediction in virtual learning environment using a deep explainable artificial intelligence. Applied Sciences, 12(4):1885, 2022.
- E. B. Costa, B. Fonseca, M. A. Santana, F. F. de Araújo, and J. Rego. Evaluating the effectiveness of educational data mining techniques for early prediction of students’ academic failure in introductory programming courses. Computers in Human Behavior, 73:247–256, 2017.
- S. H. Edwards and K. P. Murali. Codeworkout: short programming exercises with built-in data collection. In Proceedings of the 2017 ACM Conference on Innovation and Technology in Computer Science Education, pages 188–193, 2017.
- O. Embarak. Explainable artificial intelligence for services exchange in smart cities. Explainable Artificial Intelligence for Smart Cities, pages 13–30, 2021.
- N. Gitinabard, S. Heckman, T. Barnes, and C. F. Lynch. What will you do next? a sequence analysis on the student transitions between online platforms in blended courses. In the 12th International Conference on Educational Data Mining (EDM), pages 59–68, 2019.
- M. Hoq, P. Brusilovsky, and B. Akram. SANN: A subtree-based attention neural network model for student success prediction through source code analysis. In 6th Educational Data Mining in Computer Science Education (CSEDM) Workshop, pages –, 2022.
- M. Hoq, M. N. Uddin, and S.-B. Park. Vocal feature extraction-based artificial intelligent model for parkinson’s disease detection. Diagnostics, 11(6):1076, 2021.
- P. Ihantola, A. Vihavainen, A. Ahadi, M. Butler, J. Börstler, S. H. Edwards, E. Isohanni, A. Korhonen, A. Petersen, K. Rivers, et al. Educational data mining and learning analytics in programming: Literature review and case studies. In 2015 ITiCSE on Working Group Reports, pages 41–63, 2015.
- M. Jamjoom, E. Alabdulkreem, M. Hadjouni, F. Karim, and M. Qarh. Early prediction for at-risk students in an introductory programming course based on student self-efficacy. Informatica, 45(6), 2021.
- A. Joseph. Shapley regressions: A framework for statistical inference on machine learning models. arXiv preprint arXiv:1903.04209, 2019.
- M. S. Kamal, A. Northcote, L. Chowdhury, N. Dey, R. G. Crespo, and E. Herrera-Viedma. Alzheimer’s patient analysis using image and gene expression data and explainable-ai to present associated genes. IEEE Transactions on Instrumentation and Measurement, 70:1–7, 2021.
- H. Karimi, T. Derr, J. Huang, and J. Tang. Online academic course performance prediction using relational graph convolutional neural network. In Proceedings of the 13th International Conference on Educational Data Mining (EDM), pages 444–450, 2020.
- I. Khan, A. Al Sadiri, A. R. Ahmad, and N. Jabeur. Tracking student performance in introductory programming by means of machine learning. In 2019 4th MEC International Conference on Big Data and Smart City (ICBDSC), pages 1–6. IEEE, 2019.
- E. J. Lauría, J. D. Baron, M. Devireddy, V. Sundararaju, and S. M. Jayaprakash. Mining academic data to improve college student retention: An open source perspective. In Proceedings of the 2nd International Conference on Learning Analytics and Knowledge, pages 139–142, 2012.
- E. Loginova and D. F. Benoit. Embedding navigation patterns for student performance prediction. In 14th International Conference on Educational Data Mining (EDM), pages 391–399, 2021.
- S. Lorenzen, N. Hjuler, and S. Alstrup. Tracking behavioral patterns among students in an online educational system. In Proceedings of the 11th International Conference on Educational Data Mining (EDM), pages 280–285, 2018.
- Y. Lu, D. Wang, Q. Meng, and P. Chen. Towards interpretable deep learning models for knowledge tracing. In Proceedings of the 21st International Conference on Artificial Intelligence in Education (AIED), pages 185–190. Springer, 2020.
- S. M. Lundberg, G. G. Erion, and S.-I. Lee. Consistent individualized feature attribution for tree ensembles. arXiv preprint arXiv:1802.03888, 2018.
- S. M. Lundberg and S.-I. Lee. A unified approach to interpreting model predictions. In Proceedings of the 31st international Conference on Neural Information Processing Systems, volume 30, pages 4768–4777, 2017.
- Y. Mao. One minute is enough: Early prediction of student success and event-level difficulty during novice programming tasks. In Proceedings of the 12th International Conference on Educational Data Mining (EDM), pages 119–128, 2019.
- Y. Mao, F. Khoshnevisan, T. Price, T. Barnes, and M. Chi. Cross-lingual adversarial domain adaptation for novice programming. In Proceedings of the AAAI Conference on Artificial Intelligence, volume 36, pages 7682–7690, 2022.
- J. Marsden, S. Yoder, and B. Akram. Predicting Student Performance with Control-flow Graph Embeddings. In 6th Educational Data Mining in Computer Science Education (CSEDM) Workshop, pages –, 2022.
- K. Mouri, A. Shimada, C. Yin, and K. Kaneko. Discovering hidden browsing patterns using non-negative matrix factorization. In the 11th International Conference on Educational Data Mining (EDM), pages 568–571, 2018.
- T. Mu, A. Jetten, and E. Brunskill. Towards suggesting actionable interventions for wheel-spinning students. In Proceedings of The 13th International Conference on Educational Data Mining (EDM 2020), pages 183–193, 2020.
- S. M. Muddamsetty, M. N. Jahromi, and T. B. Moeslund. Expert level evaluations for explainable ai (xai) methods in the medical domain. In International Conference on Pattern Recognition, pages 35–46. Springer, 2021.
- B. Pei and W. Xing. An interpretable pipeline for identifying at-risk students. Journal of Educational Computing Research, 60(2):380–405, 2022.
- F. D. Pereira, S. C. Fonseca, E. H. Oliveira, A. I. Cristea, H. Bellhäuser, L. Rodrigues, D. B. Oliveira, S. Isotani, and L. S. Carvalho. Explaining individual and collective programming students’ behavior by interpreting a black-box predictive model. IEEE Access, 9:117097–117119, 2021.
- F. D. Pereira, E. Oliveira, A. Cristea, D. Fernandes, L. Silva, G. Aguiar, A. Alamri, and M. Alshehri. Early dropout prediction for programming courses supported by online judges. In International Conference on Artificial Intelligence in Education, pages 67–72. Springer, 2019.
- K. Quille and S. Bergin. Cs1: how will they do? how can we help? a decade of research and practice. Computer Science Education, 29(2-3):254–282, 2019.
- M. Sahami and C. Piech. As cs enrollments grow, are we attracting weaker students? In Proceedings of the 47th ACM Technical Symposium on Computing Science Education, pages 54–59, 2016.
- O. Serradilla, E. Zugasti, C. Cernuda, A. Aranburu, J. R. de Okariz, and U. Zurutuza. Interpreting remaining useful life estimations combining explainable artificial intelligence and domain knowledge in industrial machinery. In 2020 IEEE International Conference on Fuzzy Systems (FUZZ-IEEE), pages 1–8. IEEE, 2020.
- A. M. Shahiri, W. Husain, et al. A review on predicting student’s performance using data mining techniques. Procedia Computer Science, 72:414–422, 2015.
- L. S. Shapley. Quota solutions of n-person games. Technical report, RAND CORP SANTA MONICA CA, 1952.
- A. Sheshadri, N. Gitinabard, C. F. Lynch, T. Barnes, and S. Heckman. Predicting student performance based on online study habits: A study of blended courses. In the 11th International Conference on Educational Data Mining (EDM), pages 87–96, 2018.
- Y. Shi, R. Schmucker, M. Chi, T. Barnes, and T. Price. KC-Finder: Automated knowledge component discovery for programming problems. In Proceedings of the 16th International Conference on Educational Data Mining (EDM), pages –, 2023.
- A. Singh, S. Sengupta, M. A. Rasheed, V. Jayakumar, and V. Lakshminarayanan. Uncertainty aware and explainable diagnosis of retinal disease. In Medical Imaging 2021: Imaging Informatics for Healthcare, Research, and Applications, volume 11601, pages 116–125. SPIE, 2021.
- Q. Sun, J. Wu, and K. Liu. Toward understanding students’ learning performance in an object-oriented programming course: The perspective of program quality. IEEE Access, 8:37505–37517, 2020.
- M. Sweeney, J. Lester, H. Rangwala, A. Johri, et al. Next-term student performance prediction: A recommender systems approach. Journal of Educational Data Mining, 8(1):22–51, 2016.
- D. Thakker, B. K. Mishra, A. Abdullatif, S. Mazumdar, and S. Simpson. Explainable artificial intelligence for developing smart cities solutions. Smart Cities, 3(4):1353–1382, 2020.
- K. M. Ting and I. H. Witten. Stacked generalization: when does it work? In Poceedings of the 15th Joint International Conference on Artificial Intelligence, pages 866–871, 1997.
- C. Watson and F. W. Li. Failure rates in introductory programming revisited. In Proceedings of the 2014 conference on Innovation & technology in computer science education, pages 39–44, 2014.
- D. H. Wolpert. Stacked generalization. Neural Networks, 5(2):241–259, 1992.
- S. Yoder, M. Hoq, P. Brusilovsky, and B. Akram. Exploring sequential code embeddings for predicting student success in an introductory programming course. In 6th Educational Data Mining in Computer Science Education (CSEDM) Workshop, pages –, 2022.
- M. Yudelson, R. Hosseini, A. Vihavainen, and P. Brusilovsky. Investigating automated student modeling in a java MOOC. In Proceedings of the 7th International Conference on Educational Data Mining (EDM), pages 261–264, 2014.
© 2023 Copyright is held by the author(s). This work is distributed under the Creative Commons Attribution-NonCommercial-NoDerivatives 4.0 International (CC BY-NC-ND 4.0) license.