ABSTRACT
Recent research seeks to develop more comprehensive learner models for adaptive learning software. For example, models of reading comprehension built using data from students’ use of adaptive instructional software for mathematics have recently been developed. These models aim to deliver experiences that consider factors related to learning beyond performance in the target domain for instruction. We investigate the extent to which generalization is possible for a recently developed predictive model that seeks to infer students’ reading comprehension ability (as measured by end-of-year standardized test scores) using an introductory learning experience in Carnegie Learning’s MATHia intelligent tutoring system for mathematics. Building on a model learned on data from middle school students in a single school district in a mid-western U.S. state, using that state’s end-of-year English Language Arts (ELA) standardized test score as an outcome, we consider data from a school district in a south-eastern U.S. state as well as that state’s end-of-year ELA standardized test outcome. Generalization is explored by considering prediction performance when training and testing models on data from each of the individual school districts (and for their respective state’s test outcomes) as well as pooling data from both districts together. We conclude with discussion of investigations of some algorithmic fairness characteristics of the learned models. The results suggest that a model trained on data from the smaller of the two school districts considered may achieve greater fairness in its predictions over models trained on data from the other district or both districts, despite broad, overall similarities in some demographic characteristics of the two school districts. This raises interesting questions for future research on generalizing these kinds of models as well as on ensuring algorithmic fairness of resulting models for use in real-world adaptive systems for learning.
Keywords
1. INTRODUCTION
Recent research seeks to develop more comprehensive models of students using adaptive software for learning. Such models consider learning factors that are at least nominally beyond the scope of the learning software’s target domain (e.g., modeling students’ reading comprehension ability in the context of their usage of software for mathematics instruction) [15] [1]. Richey el al. [15] considered a particular piece of introductory instructional content in Carnegie Learning’s MATHia (formerly Cognitive Tutor [16]) intelligent tutoring system (ITS) and used students’ performance on that content as a proxy for their reading ability. Their argument for this choice was that performance measures for that content, generally providing instruction on how to use the ITS and its various support features, were more likely to be indicative of students’ reading ability than their mathematics ability.
Almoubayyed et al. [1] built on this initial work by providing empirical support for the argument due to Richey and colleages [15], demonstrating that performance on this introductory MATHia content is correlated with students’ performance on end-of-year standardized test scores for English Language Arts (ELA). Further, it was found that the correlation of student performance with ELA test scores compared to the correlation of student performance with mathematics test scores was greater than almost all other content in MATHia, suggesting the possibility that this early performance in MATHia might serve as a type of instruction-embedded assessment of reading ability. Such an assessment of reading ability, especially early within a student’s use of MATHia or other adaptive software, might serve at least two purposes:
- Early prediction(s) that a student may still be emerging as a reader of English at their grade-level can serve as quick (relatively low-stakes) diagnoses that adaptive reading supports should be made available to students. In the situation in which such supports are broadly available to all users of software, then messaging prompts or similar “nudges” might be adaptively presented to suggest their usage to particular students based on these kinds of predictions.
- Predictions that a student is likely an emerging English language learner (ELL) or for some other reason is struggling to read can be used in retrospective analyses and design-loop adaptivity processes [Aleven et al., 2017] to better understand whether various software features, content improvements, and/or supports for reading, meta-cognition, or other learning factors are having their desired effect (e.g., via randomized experiments or so-called “A/B tests” [18]), especially if such features, content, or supports are targeting a particular population of learners like ELLs. In large-scale deployments of adaptive learning software like MATHia, standardized test outcome data or student-level characteristics like ELL status are generally not available, neither to the software at run-time, nor to developers and analysts who seek to better understand how to improve users’ learning experiences.
Almoubayyed et al. [1] develop neural network based prediction models for ELA exam scores that use performance features in this introductory content that are promising for at least the two above uses-cases.1 These models were trained and tested on data from hundreds of students, including data for hundreds of thousands of student actions, in a single school district in a mid-western U.S. state. A natural question concerns the extent to which models learned in a single school district (and state) generalize to other school districts in other states. We build on the work of Almoubayyed et al. [1] to consider this question of generalizability.
2. MATHIA
MATHia (formerly Cognitive Tutor [16]) is an ITS for mathematics instruction that is a part of a blended, basal curriculum for middle school and high school mathematics developed by Carnegie Learning, and used by around half a million students across the United States. Instruction in MATHia is delivered via complex, multi-step problems, with most steps within problems mapped to one or more knowledge components (KCs, or skills [11]). Students work through “workspaces” that provide practice on a set of KCs until the ITS has determined that the student has reached mastery [3] of all such KCs (using the Bayesian Knowledge Tracing framework [2]) in the workspace (or the student reaches a pre-defined maximum number of problems). When the student reaches mastery of all KCs (or the maximum number of problems), the student is moved on to the next workspace in the curriculum set by their teacher or school for their grade-level.
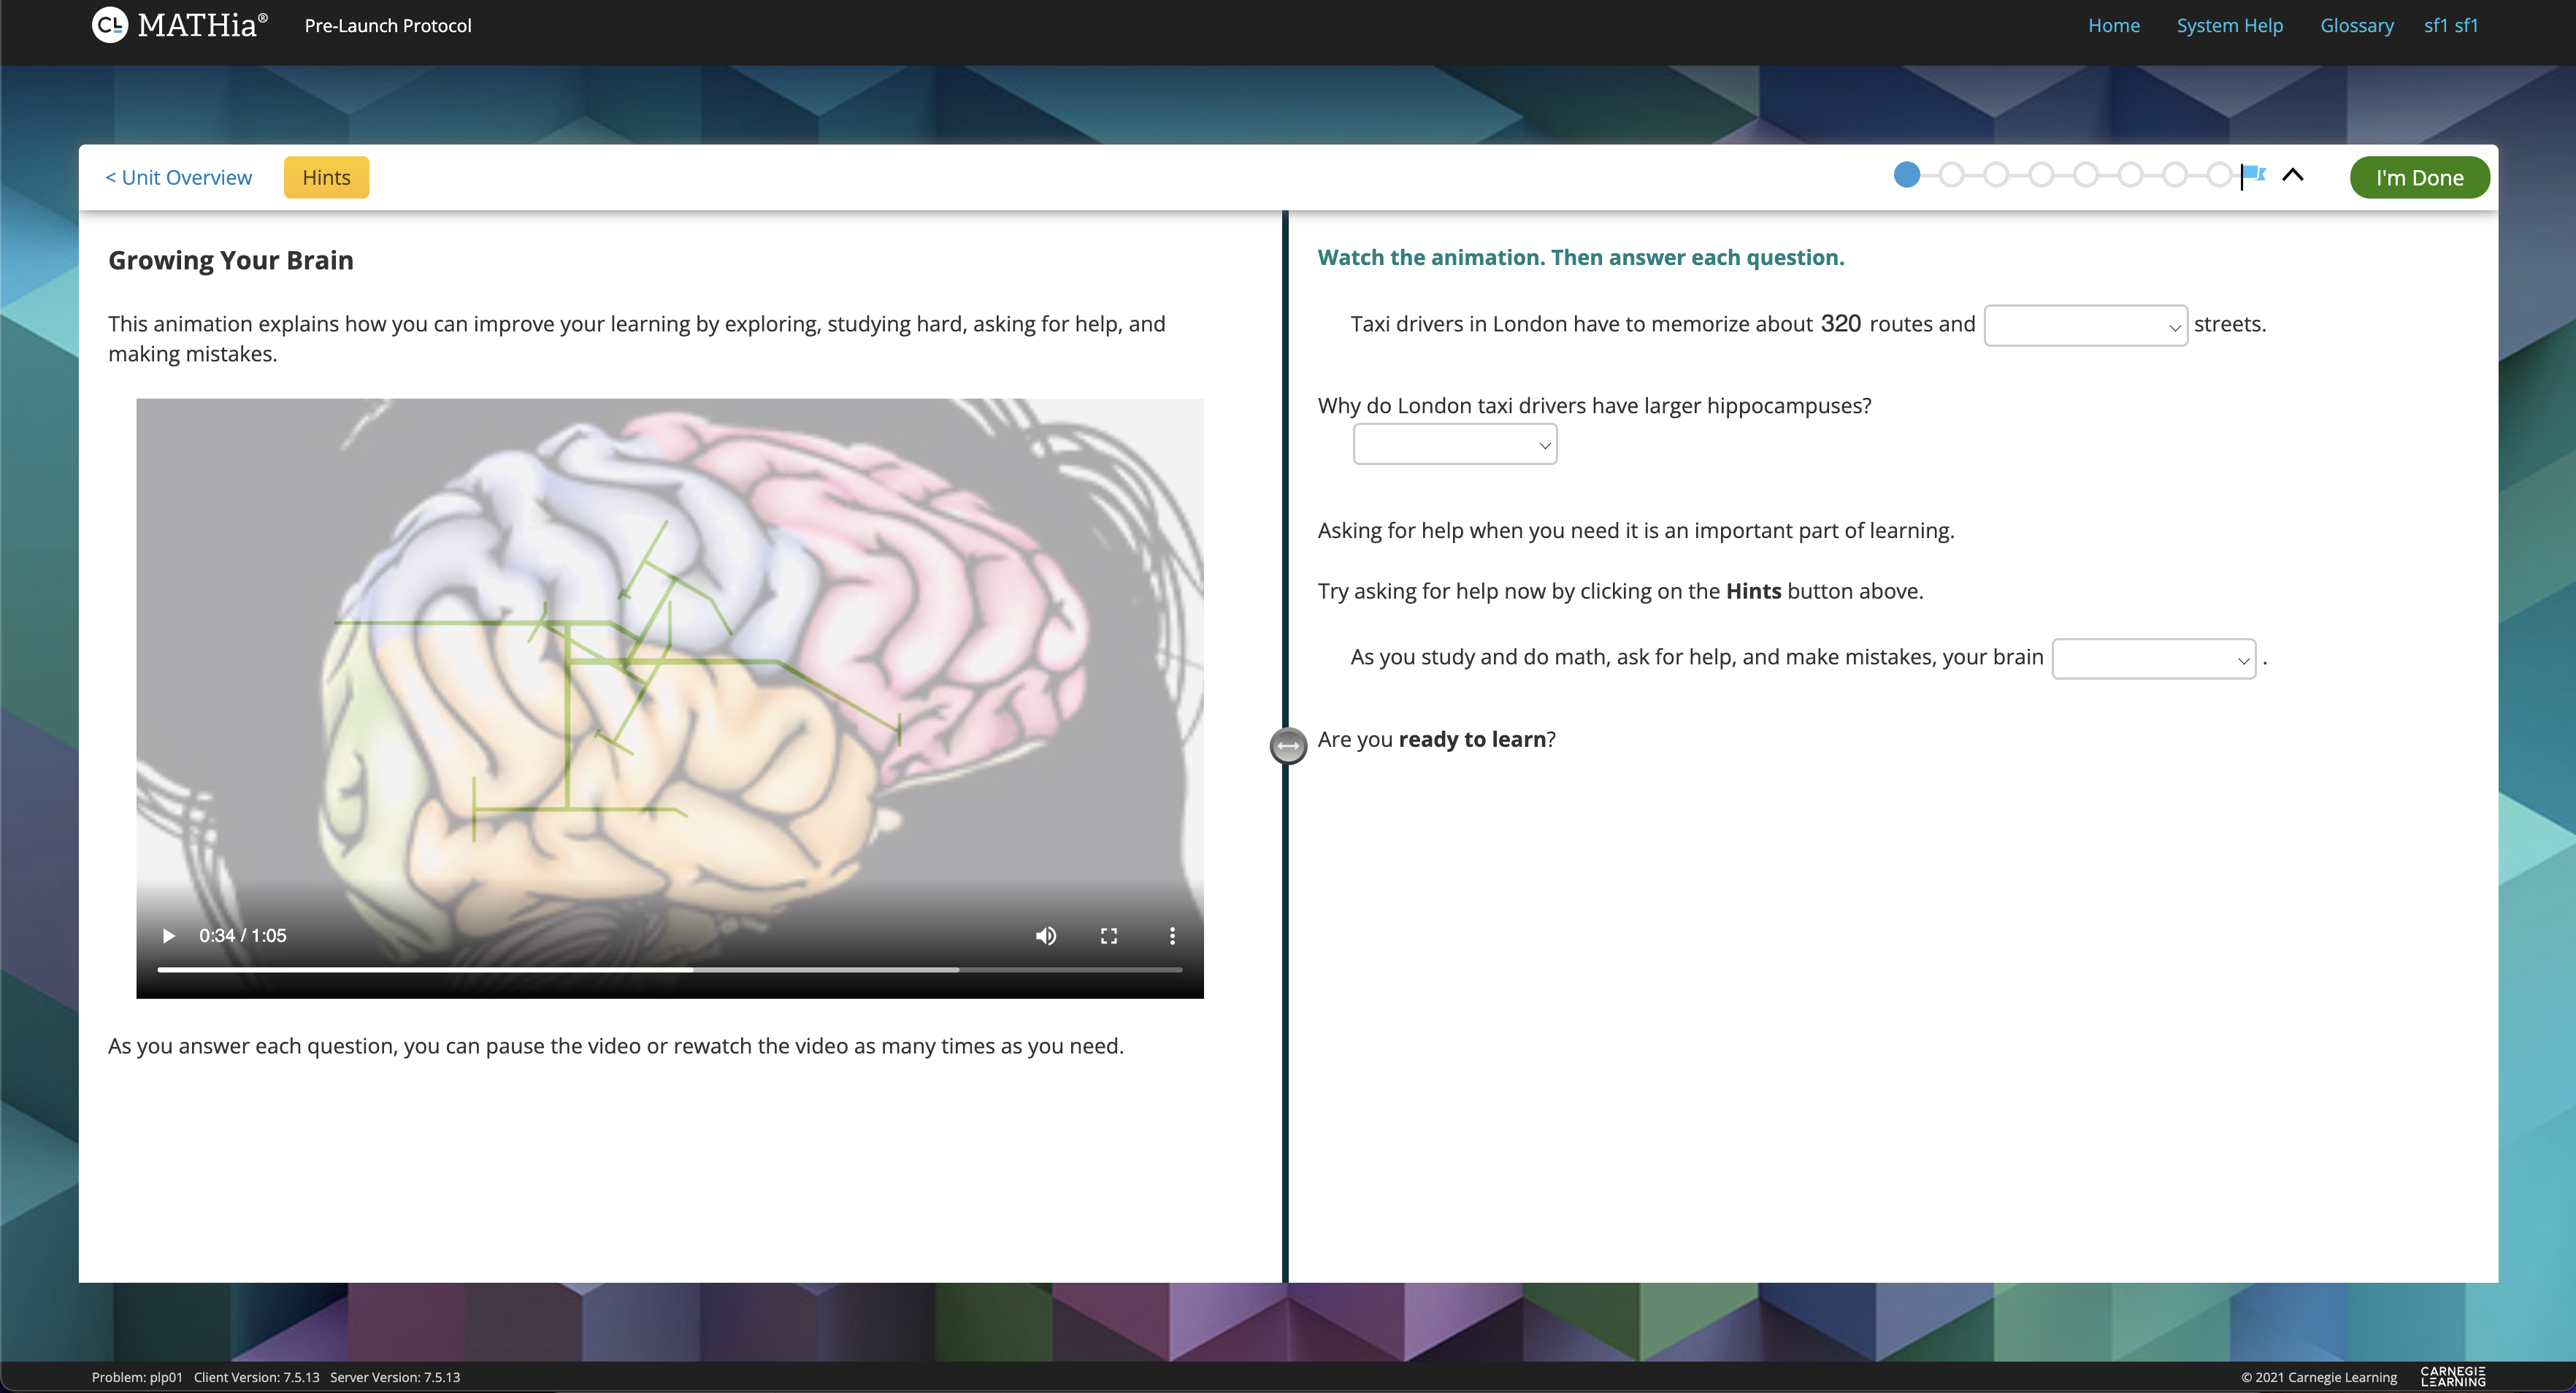
To introduce students to the practice opportunities they will receive in MATHia, the first workspace in MATHia, referred to by MATHia developers as the Pre-Launch Protocol, introduces students to the ITS software, its user-interface (e.g., how to watch videos and provide input to the ITS), adaptive support features like just-in-time (JIT) feedback and context-sensitive hints, as well as providing some motivational messaging about “growth-mind-set” [13] and related ideas (e.g., the video about “growing your brain” visible in the screenshot provided by Figure 1). Problems in the Pre-Launch Protocol are not necessarily about mathematics, but rather engage students with questions that are nearly certain to require students to engage with adaptive features of the software, such as hint requests. For example, one question asks students to provide the name of an animal that begins with the letter “e.” Since the answer is not obvious (e.g., not “elephant”), students almost always have to request a hint and receive feedback on incorrect answers as they make attempts to correctly guess what the ITS is “thinking” about. The Pre-Launch Protocol is a non-mastery workspace in MATHia, and performance on the Pre-Launch Protocol is not related to KCs, but students’ interactions, attempts, and correctness is nonetheless tracked in the Pre-Launch Protocol. Student performance data from the Pre-Launch Protocol workspace have figured prominently in two previous papers on developing more comprehensive models of reading comprehension while students use MATHia [15], [1].
The usefulness of the Pre-Launch Protocol in this context is due to several reasons: Firstly, the Pre-Launch Protocol is the very first thing that a student interacts with in MATHia, and therefore, the possibility of making accurate predictions using only Pre-Launch Protocol data can be powerful. Such predictions can be used to improve and personalize students’ learning experiences in MATHia very early on in the academic year (whereas making a prediction near the end of the year would be less useful for many applications). Secondly, while content in intelligent tutoring systems is typically personalized to the student, and thus not every student encounters the same problems, that issue is not relevant for the Pre-Launch Protocol. Every student using MATHia completes an identical Pre-Launch Protocol, resulting in complete data. Finally, expecting the Pre-Launch Protocol to have predictive signal about factors of student learning not related to mathematics is well-motivated, due to the fact that it is the only piece of content in MATHia that does not deliver content directly related to mathematics or the student’s curriculum.
The present work builds on the intuition of Richey et al. [15] and the initial empirical validation of their argument by Almoubayyed et al. [1] that student performance in this introductory content may serve as an instruction-embedded assessment of reading ability2 that can be used to develop a more comprehensive student model within an ITS for mathematics. By considering additional data than these previous works, we seek to better understand whether the predictive model developed in [1] generalizes to a new school district context. The new school district context includes a larger sample of students in a different U.S. state with outcome measures from a different standardized test. We now consider our data in more detail.
3. DATA
Relying partially on data provided by the authors of [1], we use two datasets of student end-of-year English Language Arts (ELA) standardized (state) test scores in Grade 7 in the 2021-2022 academic year. The datasets come from two school districts: one from a mid-western U.S. state that was studied in [1] and one from a south-eastern U.S. state. Hereafter, we refer to the dataset from the mid-western state as MW, the dataset from the south-eastern state as SE, and the combination of both as the Combined dataset. The datasets additionally include demographic information of the students. Although the demographics were similar in some aspects, for example, around 60% of the student population in both districts were white; there were large differences in overall student performance between them. Specifically, 78% of students in our MW dataset passed their end-of-year ELA state test, compared to 49% in our SE dataset. There were also a large difference between the size of the districts and the Grade 7 students for whom we have data, while MW had 831 students, SE had 4,349 students. For the purposes of this study, we categorized student performance as a binary measure of either passing or failing to pass the state test. We also received access to the students’ action-level performance in MATHia on the 36-step Pre-Launch Protocol. In total, we received 563,650 action-level student records for the two districts combined, which is equivalent to 3 actions per step per student on average. There was no missing data for any student for any step: because the Pre-Launch Protocol is the first workspace a student interacts with in MATHia, and is presented identically across students, every student completed every step in the Pre-Launch Protocol. Students can either make an attempt or request a hint. If a student makes an incorrect attempt, they may receive JIT feedback if their mistake is deemed by MATHia as a “common misconception.” Following the feature engineering steps that Almoubayyed, et al. defined in [1], we generate the following features from the data:
correct: Whether a student’s first attempt on a step was correct (1) or incorrect (0).hint: The number of hints that a student requested on a step. This number can be between 0 and 3.jit: The number of JIT feedback a student received on a stepattempt: The number of attempts a student made on a step until reaching the correct answer.
We split each of the datasets into a training set and a test set, each containing half of the number of students selected at random. When training and testing on a combination of the datasets, we combine the two training set and the two test sets separately.
Test score and demographic data were provided by the two districts to Carnegie Learning according to data sharing agreements between Carnegie Learning and the district that allows for the use of these data for research purposes.
4. READING ABILITY PREDICTIVE MODEL GENERALIZATION
Almoubayyed et al. [1] found that the Pre-Launch Protocol is one of the workspaces in MATHia that are most correlated with end-of-year ELA test scores, compared to their correlations with end-of-year mathematics test scores, across grade levels. Additionally, they were able to build a predictive model of student end-of-year ELA achievement levels by training machine learning models on Pre-Launch Protocol data.
We aim to extend the predictive models of reading ability in MATHia to both explore the generalizability of such a model and to increase trust in it such that it can be used with higher confidence over a large population of users to predict students’ reading ability from their interaction with a mathematics ITS.
We use a Multi-Layer Perceptron (MLP) model with identical architecture to the highest-performing model that Almoubayyed et al. developed in [1]. In particular, the model is an MLP with a single hidden layer containing 100 nodes, with a relu activation function and adaptive learning rate. The model is trained with a categorical cross-entropy loss function, optimized by the stochastic gradient-based optimizer defined in [10]. We note that Almoubayyed et al. [1] carried out model exploration with several set-ups. Additionally, while this model explicitly does not provide causal evidence, Almoubayyed et al. do investigate confounding factors in [1]. We do not replicate that work here and we encourage interested readers to refer to [1] for more details on the model details.
We train the model on four sets of features separately:
the four sets being the correct, hint, jit, attempt
defined in Section 3. For each set, there are 36 features
corresponding to the steps in the Pre-Launch Protocol. While
we retain the model architecture and feature engineering
steps, we retrain the model with the following changes:
- We train the model on a binary classification task (passing or failing to pass the state test), rather than achievement levels. This is due to the fact that different states have different numbers of achievement levels, and a binary classifier may be of more practical usefulness. It is possible to use post-processing on a classifier that predicts achievement levels instead of retraining, but we decided that retraining the model on binary classes would be a more consistent implementation across the two districts.
- We treat the Pre-Launch Protocol steps to be the same features regardless of whether a student attempts the Pre-Launch Protocol in a different grade level. The Pre-Launch Protocol itself is identical for any grade level, however, the fact that it is attempted a different grade level may still have predictive signal. We find, however, that the number of students that attempt the Pre-Launch Protocol varies very largely between the two districts, and that treating the Pre-Launch Protocol steps to be the same features more appropriate for generalization purposes.
- Almoubayyed et al. [1] developed an ensemble model
to combine the four models by taking the mode of
the predictions (i.e., a “majority vote” of the four
models). Instead, for an ensemble predictive model,
we average the predicted probabilities of the four
models. Using probabilities allows us to construct a
Receiver Operator Characteristic (ROC) curve and
avoids situations where the predictions of the four
models result in a tie. We refer to this model as
prob.
We use the ROC curve and the area under the ROC curve (AUC) as metrics to compare models. The ROC curve shows the False Positive Rate (FPR), and the True Positive Rate (TPR), for decision thresholds ranging between 0 and 1 for the classification task. The FPR and TPR are defined as follows: \begin {align*} \text {FPR} = \text {FP} / \text {N} \\ \text {TPR} = \text {TP} / \text {P} \end {align*}
where FP, or False Positives, are defined here as students who are predicted to pass the end-of-year ELA test, but in reality fail to pass it. Conversely, TP, or True Positives, are students who are predicted to pass the end-of-year ELA test, and do indeed pass it. N and P are the total number of negatives and positives respectively in the ground truth dataset.
Analyzing ROC curves allows for choosing specific models with different thresholds depending on the purpose (a lower threshold results in a model with lower FPR and lower TPR, an appropriate choice if minimizing the FPR is a priority. On the other hand, a higher threshold results in a model with higher FPR and higher TPR, an appropriate choice if maximizing the TPR is the priority).
To assess the generalizability of this model, we train and test
the models on every combination of training and testing sets.
Specifically, we train the 4 (correct, hint, jit, attempt)
models and compute the ensemble prob model on each of the
(MW, SE, Combined) training sets, and for each of these
models, we test them on each of the (MW, SE, Combined) test
sets. This results in 9 combinations (with 4 trained + 1 ensemble model for each of the 9 combinations).
Figure 2 shows the ROC curves for the model trained on the MW dataset and tested on the MW, SE, and Combined datasets, top to bottom respectively. Figure 3 shows the ROC curves for the model trained on the SE dataset and tested on the SE, MW, and Combined datasets, top to bottom respectively. Finally, Figure 4 shows the ROC curves for the model trained on the Combined dataset and tested on the Combined, MW, and SE districts, top to bottom respectively. The ensemble models generally perform significantly better than the four trained models; suggesting that there is a signal gained from combining the four trained models in each case. While a model trained and tested on data from the same school districts performs better, there are no cases where a model tested in a different district performs significantly poorer.
Table 1 shows the AUC scores of the ensemble (prob) models in
each of the 9 cases. We find that the AUC scores range between
0.76 and 0.80. A model trained and tested on the same district,
in each of the districts, achieve an AUC of 0.80, while a model
trained in one district and tested on the other achieves a
slightly lower AUC of 0.76-0.78. Finally, a model trained on
both districts achieves an AUC of 0.80 on either district.
This suggests that adding data from an additional district
makes the model perform better, however, even a model
trained in one district and tested in another only slightly
underperforms.
Although the district have significantly different performance and base pass rates, the models seem to transfer well without additional changes. Adding data does improve the performance of the models, however, but the performance of these models seems to saturate with an AUC of 0.80 across the two districts.


Model | Tested on | ||
|---|---|---|---|
| MW | SE | Combined | |
| MW | 0.80 | 0.76 | 0.77 |
| SE | 0.78 | 0.80 | 0.80 |
| Combined | 0.80 | 0.80 | 0.80 |
5. FAIRNESS ASSESSMENTS
Considering how the models perform for different student populations is important to build learners’ and other stakeholders’ trust in the ITS and ensure that models generalize well over populations of diverse learners nation-wide (and perhaps world-wide). Such considerations are especially important if we are to reach the goal of such embedded assessments playing a role in deployed, real-world ITSs. We look at the ROC curve for each of the ensemble models previously describe (trained on MW, SE, or Combined training sets) when tested on subsets of demographics in each of the test sets. In particular, we look at race and gender information as provided by the school districts. In order to obtain large enough test sets for the demographic subsets, we bifurcate the data into two categories for each demographic. Namely, we look at model performance for white (W) and non-white (NW) students; and for female (F) and male (M) students. We recognize that this bifurcation is broad and does not provide complete information (e.g., on relative model performance for students of different non-white races and for students with different gender identities). We leave more comprehensive and nuanced analyses for important future work.
Figure 5 shows the models’ performance when predicting the reading ability of non-white and white students in each of the districts. In all cases, evaluating the model on a test set from the same district yielded similar ROC curve across white and non-white students. However, interestingly, the performance varied significantly when evaluating the models on the other district. Specifically, we see that the model trained on MW data generalized similarly across both non-white and white students, but the model trained on SE and evaluated on MW performs significantly poorer for non-white students compared to white students. Given the relatively similar proportion of white and non-white students in both districts, this suggests that any relatively simple assumption that such similarity ought to lead to similar performance across districts appears flawed. These results are also possibly surprising due to the fact that the MW dataset is significantly smaller in sample size than the SE dataset. In particular, the SE dataset contains over 5 times as many students as the MW dataset.
Similarly for gender, Figure 6 shows the models’ performance broken into female and male students. We find a similar trend here, where the model trained on MW generalizes similarly well across female and male students in SE; while there is a significant difference in how the model trained on SE generalizes across female and male students. In particular, we find that the model trained on SE performs significantly poorer when evaluated on male students in MW compared to female students.
Due to the fact that the Combined model is more influenced by data from the (larger) SE district, it performs more similarly to the SE model when broken down by demographics. This leads us to believe that, although the Combined model has a higher AUC on the whole, the MW model might be the better model in practical implementations, due to its similar performance across demographics, at the cost of a slight loss of 0.03-0.04 in AUC performance. Additional data from diverse school districts will be needed to further consider nuances of how models generalize across student populations and the relative fairness characteristics of such generalized models.


While we only consider model performance on different demographics, it may also be valuable to use algorithmic fairness metrics and bias mitigation algorithms. For example, Stinar and Bosch [19] compare the effectiveness of several unfairness mitigation algorithms in the context of mathematics end-of-year state test scores for around 5 million middle school students in Texas; using algorithms such as Disparate Impact Preprocessing [6], Reweighing [4], and Equalized Odds Postprocessing [7].
Disparate Impact Preprocessing, for example, aims to modify the model (by modifying the training data) such that it achieves a Disparate Impact metric closer to unity; where Disparate Impact is defined as \begin {equation} DI = \frac {Pr\left (y=1 \;\middle |\; D=g1\right )}{Pr\left (y=1 \;\middle |\; D=g2\right )}, \end {equation} where y is the target (i.e., \(y=1\) corresponds to passing the state test), and \(D\) is the protected class (i.e., the demographic), with \(g1\) and \(g2\) being two groups in the protected class. When computing the DI metrics on the MW and SE datasets we found that the base rates for the DIs (i.e., the DIs computed on the ground truth data) was in some cases significantly different than 1, and thus there is a trade-off between (a) achieving a DI closer to 1 and (b) achieving better performance on predicting reading ability for students across demographic groups. Upon inspection of the DIs, we do find that the DIs for the model predictions were always slightly closer to unity than the DIs of the test sets. We leave a more comprehensive study of these metrics and whether it is appropriate to use algorithms that aim to alter them to future work.
6. CONCLUSIONS
Results of the present exercise in generalizing a model to predict reading ability built first on data from a school district in the mid-western U.S. [1] to a larger school district in the south-eastern U.S. are promising. We see largely similar predictive performance results (ranging from 0.76 to 0.8 AUC) regardless of whether we learn and/or test models on either of the districts individually or “pool” together or combine data from both districts to create a single dataset for training and testing. These results suggest that such models may be helpful in suggesting relatively “low-stakes” interventions to support readers who may be experiencing difficulty with reading in their mathematics learning in the MATHia software (e.g., behavioral nudges or suggestions to engage with reading supports or possibly directly presenting students with such supports). Additionally, these models are likely to help learning engineers and analysts to better understand whether such supports are working for those they are intended to help (especially if presented across a wide population learners for which data about their reading ability is unavailable).
Our investigations into one facet of algorithmic fairness of the approach we consider leads us to an interesting result: the model trained on a smaller dataset performs better in terms of prediction accuracy across two demographic categories (i.e., a bifurcation of race and gender) we considered while only performing slightly worse overall compared to a model learned over a much larger, pooled dataset. Previous work on data from Cognitive Tutor [21] found a result that was analogous in some ways to the present result, specifically that a model trained over a smaller amount of “high quality” usage data (i.e., students with a lot time using the software and completing content) out-performed models learned over larger populations of students without regard to inclusion criteria for usage. However, the present work considers a much different prediction task, namely ensembled neural network model performance on an end-of-year standardized test outside the target instructional domain of the system, rather than predictions of individual student actions within an ITS. Additionally, the model trained on the larger dataset does out-perform the model trained on a smaller dataset overall; it is just when we begin to consider demographic breakdowns of model performance (as one operationalization of algorithmic fairness, among many) that we start to notice the potential that the model trained on a smaller dataset may be out-performing the model trained on the “larger” dataset. There are other metrics and unfairness mitigation algorithms that have been developed, such as Disparate Impact Preprocessing, Reweighing, and Equalized Odds Postprocessing – we leave a more comprehensive study of these metrics to future work.
While we studied two districts in two states in different regions across the United States, we found that models trained on one or the other have varying performance over different demographics. With data from more states with different demographic make-ups, it would still be interesting to test how these models further generalize, and whether the MW model that generalized well across demographics in both the MW and SE datasets, would also generalize well to districts in more regions.
We believe that taking steps to ensure trust and fairness in predictive models in education are essential when using these models for practical purposes. For example, models that generalize well could be used in A/B testing experiments to predict the reading ability of a large population of students to see how different aspects of personalized learning may work better for them (e.g., by using them to personalize BKT model parameters to students with reading difficulties). An example of such a personalization could, for example, find it more suitable to allow students with predicted reading difficulties to attempt more practice opportunities on mastery content, and vice versa. Such personalization and other adaptive supports may improve student learning and user experience in ITSs, but could also have adverse effects if the predictive ability of the models is unfair towards certain demographics.
We look forward to further engaging with these questions of both generalization and fairness as well as how different goals for prediction are likely to impact appropriate choices for how to operationalize fairness to ensure more trustworthy, equitable, and high-quality learning experiences for all learners.
7. ACKNOWLEDGMENTS
This material is based upon work supported by the National Science Foundation under Grant No. 2000638.
The research reported here was supported in part by the Institute of Education Sciences, U.S. Department of Education, through grant R324A210289 to Center for Applied Special Technology (CAST). The opinions expressed are those of the authors and do not represent the views of the Institute or the U.S. Department of Education.
Figures in this paper were generated using the open-source Python libraries matplotlib [8] and Seaborn [20]; machine learning models were built and trained using Sci-kit Learn [14]; and statistical computations were done in SciPy [9].
The authors thank April Murphy, Beth Fornauf, Jennifer Reddig, Katie Bevan, Kim Ducharme, Kyle Weldon, Leila Lester, Mark Swartz, Mia Gross, Rae Bastoni, Sarah Galasso, Susan Berman, and Zack Lee at both CAST and Carnegie Learning for helpful discussions and contributions.
8. REFERENCES
- H. Almoubayyed, S. E. Fancsali, and S. Ritter. Instruction-embedded assessment for reading ability in adaptive mathematics software. In Proceedings of the 13th International Conference on Learning Analytics and Knowledge, LAK ’23, New York, NY, USA, 2023. Association for Computing Machinery.
- J. R. Anderson and A. T. Corbett. Knowledge tracing: Modeling the acquisition of procedural knowledge. User Modeling and User-Adapted Interaction, 4:253–278, 1995.
- B. S. Bloom. Learning for mastery. instruction and curriculum. volume 1, 1968.
- K. Faisal and T. Calders. Data preprocessing techniques for classification without discrimination. Knowledge and Information Systems, 33, 2012.
- S. E. Fancsali, G. Zheng, Y. Tan, S. Ritter, S. R. Berman, and A. Galyardt. Using embedded formative assessment to predict state summative test scores. In Proceedings of the 8th International Conference on Learning Analytics and Knowledge, LAK ’18, page 161–170, New York, NY, USA, 2018. Association for Computing Machinery.
- M. Feldman, S. A. Friedler, J. Moeller, C. Scheidegger, and S. Venkatasubramanian. Certifying and removing disparate impact. In Proceedings of the 21th ACM SIGKDD International Conference on Knowledge Discovery and Data Mining, KDD ’15, page 259–268, New York, NY, USA, 2015. Association for Computing Machinery.
- M. Hardt, E. Price, E. Price, and N. Srebro. Equality of opportunity in supervised learning. In D. Lee, M. Sugiyama, U. Luxburg, I. Guyon, and R. Garnett, editors, Advances in Neural Information Processing Systems, volume 29. Curran Associates, Inc., 2016.
- J. D. Hunter. Matplotlib: A 2d graphics environment. Computing In Science & Engineering, 9(3):90–95, 2007.
- E. Jones, T. Oliphant, P. Peterson, et al. SciPy: Open source scientific tools for Python, 2001.
- D. P. Kingma and J. Ba. Adam: A Method for Stochastic Optimization. arXiv e-prints, page arXiv:1412.6980, Dec. 2014.
- K. R. Koedinger, A. T. Corbett, and C. Perfetti. The knowledge-learning-instruction framework: Bridging the science-practice chasm to enhance robust student learning. Cognitive Science, 36(5):757–798, 2012.
- Z. A. Pardos, R. Baker, M. O. S. Pedro, S. M. Gowda, and S. M. Gowda. Affective states and state tests: Investigating how affect and engagement during the school year predict end-of-year learning outcomes. Journal of learning Analytics, 1:107–128, 2014.
- D. Paunesku, G. M. Walton, C. Romero, E. N. Smith, D. S. Yeager, and C. S. Dweck. Mind-set interventions are a scalable treatment for academic underachievement. Psychological Science, 26(6):784–793, 2015. PMID: 25862544.
- F. Pedregosa, G. Varoquaux, A. Gramfort, V. Michel, B. Thirion, O. Grisel, M. Blondel, P. Prettenhofer, R. Weiss, V. Dubourg, J. Vanderplas, A. Passos, D. Cournapeau, M. Brucher, M. Perrot, and E. Duchesnay. Scikit-learn: Machine Learning in Python . Journal of Machine Learning Research, 12:2825–2830, 2011.
- J. E. Richey, N. G. Lobczowski, P. F. Carvalho, and K. Koedinger. Comprehensive views of math learners: A case for modeling and supporting non-math factors in adaptive math software. In I. I. Bittencourt, M. Cukurova, K. Muldner, R. Luckin, and E. Millán, editors, Artificial Intelligence in Education, pages 460–471, Cham, 2020. Springer International Publishing.
- S. Ritter, J. R. Anderson, K. Koedinger, and A. T. Corbett. Cognitive tutor: Applied research in mathematics education. Psychonomic Bulletin & Review, 14:249–255, 2007.
- S. Ritter, A. Joshi, S. Fancsali, and T. Nixon. Predicting standardized test scores from cognitive tutor interactions. In EDM, 2013.
- S. Ritter, A. Murphy, S. E. Fancsali, V. Fitkariwala, N. Patel, and J. D. Lomas. Upgrade: An open source tool to support a/b testing in educational software. In Proceedings of the First Workshop on Educational A/B Testing at Scale. EdTech Books, 2020.
- F. Stinar and N. Bosch. Algorithmic unfairness mitigation in student models: When fairer methods lead to unintended results. In A. Mitrovic and N. Bosch, editors, Proceedings of the 15th International Conference on Educational Data Mining, pages 606–611, Durham, United Kingdom, July 2022. International Educational Data Mining Society.
- M. Waskom, O. Botvinnik, D. O’Kane, P. Hobson, S. Lukauskas, D. C. Gemperline, T. Augspurger, Y. Halchenko, J. B. Cole, J. Warmenhoven, J. de Ruiter, C. Pye, S. Hoyer, J. Vanderplas, S. Villalba, G. Kunter, E. Quintero, P. Bachant, M. Martin, K. Meyer, A. Miles, Y. Ram, T. Yarkoni, M. L. Williams, C. Evans, C. Fitzgerald, Brian, C. Fonnesbeck, A. Lee, and A. Qalieh. mwaskom/seaborn: v0.8.1, Sept. 2017.
- M. V. Yudelson, S. E. Fancsali, S. Ritter, S. R. Berman, T. Nixon, and A. Joshi. Better data beat big data. In Proceedings of the 7th International Conference on Educational Data Mining, pages 204–208, 2014.
1Models developed by Almoubayyed et al. [1] that consider data from content beyond introductory content may be especially useful for retrospective analyses germane to the second use-case.
2Using statistical models of student performance and predictions about behavior and affective states in systems like MATHia as instruction-embedded assessments for the system’s target domain (i.e., for predicting mathematics standardized test scores) has been explored in some depth across software platforms and U.S. states (e.g., [17] [12] [5]).
© 2023 Copyright is held by the author(s). This work is distributed under the Creative Commons Attribution-NonCommercial-NoDerivatives 4.0 International (CC BY-NC-ND 4.0) license.