Both authors contributed equally to the paper
ABSTRACT
Demographic features are commonly used in Educational Data Mining (EDM) research to predict at-risk students. Yet, the practice of using demographic features has to be considered extremely problematic due to the data’s sensitive nature, but also because (historic and representation) biases likely exist in the training data, which leads to strong fairness concerns. At the same time and despite the frequent use, the value of demographic features for prediction accuracy remains unclear. In this paper, we systematically investigate the importance of demographic features for at-risk prediction using several publicly available datasets from different countries. We find strong evidence that including demographic features does not lead to better-performing models as long as some study-related features exist, such as performance or activity data. Additionally, we show that models, nonetheless, place importance on these features when they are included in the data – although this is not necessary for accuracy. These findings, together with our discussion, strongly suggest that at-risk prediction should not include demographic features. Our code is available at: https://anonymous.4open.science/r/edm-F7D1.
Keywords
1. INTRODUCTION
The use of demographic features for training models to predict
at-risk students, e.g., students in danger of dropping out or
failing a course or study program, is very common [2, 21].
Demographic features “refer to particular characteristics of a
population […], such as age, race, gender, ethnicity, religion,
income, education, […]” [25]. These features are typically
categorical and sometimes also of high cardinality. Other
features usually used in the context of at-risk prediction
are previous performance features (e.g., previous results,
current GPA, ...) as well as study engagement/activity data
(e.g., log data, count of raised hands) [31]. Alturki et al.
[2] evaluated the features most used across EDM studies
predicting student success from 2007-2018. Among the ten most
used features are six demographic features (gender, age,
income, nationality, marital status, employment status)
– the most common of which is gender. In a way, it is
not surprising that these features are so regularly used.
Most educational institutions require the students to enter
demographic information about themselves, and this data is
typically more accessible to researchers than, e.g., log data.
However, demographic features also make datasets very
problematic regarding receiving access and sharing the data [9].
Demographic data is sensitive data and can be used to identify
people in the dataset. In order to be able to share the data, at
least some type of pseudonymization has to be employed, e.g.,
k-anonymity [29]. This is often extremely difficult to achieve and
weakens the usefulness of the features, e.g., through binning.
Apart from the problems with data access, demographic
features are also problematic in some settings where we
could employ the models. Suppose we, e.g., use a model to
admit people to a course based on their prediction. In
that case, it is very problematic if demographic variables
impact the prediction as it could easily reproduce biases [13].
Due to these fairness concerns, the use of demographic
features is heavily discussed in the literature on fairness in AI
[17].
Hence, using demographic features in predictive models leads to
a lot of problems. Still, if demographic features are relevant for
EDM predictions, it might be tempting for researchers
and practitioners to include them. Yet, their value for
the prediction is unclear. Few papers explicitly evaluated
feature importance, and even fewer considered the effect of
demographic features in general. Those that have arrived at
very different conclusions. While some stress the importance of
demographic features [4, 7, 12], others state that they are not
important [31, 32, 19], and others yet are on middle ground
[15, 30, 35, 6]. So far, comparatively few papers compared the
accuracy metrics of models with and without demographic
information [31, 1, 14]. Furthermore, the nature of the
relationship (linear, nonlinear) between demographic features
and study success has not been evaluated enough. Suppose we
find that demographic features are not important for model
performance. In that case, it pays to leave them out – mostly for
fairness and privacy reasons but also because wisely selecting
features pays off regarding the amount of data instances we
need to train our models, as more features require more
instances [34]. In detail, the contributions of this paper
are:
- We provide a theoretical discussion on the type of features typically used for at-risk prediction (Section 2.1), fairness concerns when using demographic features to predict academic achievement (Section 2.2), and causal mechanisms that could exist between demographic characteristics and academic achievement (Section 2.3).
- We summarize and discuss the findings of existing studies on the importance of demographic data in Section 3.
- We evaluate the importance of demographic features for predicting academic success using four EDM datasets in Section 6 and show that demographic characteristics are related to the target, but when study-related information is available, using them does not increase the predictive performance
- We find that models nonetheless place importance on demographic features when they are included such that practitioners cannot rely on technical solutions but have to carefully think about whether demographic features should be included at all in Section 7.
2. THEORETICAL CONSIDERATIONS
2.1 Types of Features
As already mentioned in the introduction, we can have different
types of features in the datasets. In accordance with Tomasevic
et al. [31] we argue that there are three major types of EDM
features: demographic features, performance features, and
activity/engagement features.
Demographic Features. Demographic features are traditionally
considered to be features that refer to characteristics of
a population. Typically used demographic features are
gender, age, ethnicity, nationality, or features indicating
socioeconomic status, such as e.g. parental occupations or
household income. Furthermore, we define all features as
demographic features that strongly point toward certain
demographic characteristics. For example, we consider the
school a student went to or parental financial support as
demographic information.
Performance Features. Any study-related performance
measures, e.g., grades, information on passes or fails, or
percentages on assignments, are considered performance
features. In other words, any information that hints on how well
a student did in the past belongs to this type.
Activity Features. Activity features are features that are
study-related and show how active a student is. Typical features
of this type are participation during class, hours spent on
online-learning platforms, participation in online forums,
etc.
Most features in EDM datasets belong to one of these categories
with the implicit assumption that they all matter regarding at-risk
prediction. Other features not belonging to either of these
categories would, e.g., be the study program or the semester a
student is in or in which the course takes place. As our focus is
on investigating whether using demographic features is
advantageous when we also have some study-related features, we
do not differentiate between activity and performance data. For
the remainder of the paper, we define study-related features as
all features related to a student’s study activity and previous
performance.
2.2 Fairness Considerations
Before we start investigating the potential usefulness of
demographic features in detail, we want to briefly highlight why fairness concerns are so prevalent when it comes to demographic
features and why it is so important to investigate their potential
impact.
Most datasets used in EDM research consist of historical data.
Historical data may already include biases [17]. If e.g., a teacher
unconsciously or consciously favors students of a certain
gender or ethnicity, students belonging to this demographic
category will have better grades. A machine learning model
will learn this pattern and, as a result, is more likely to
predict that students who belong to different genders or
ethnicities are at risk. If e.g., the prediction is used to
admit students to a course or a degree, then it is very
obvious that unfairness results from bias. Another probable
problem in EDM research arises when some populations
are underrepresented in the training data [17]. If, e.g.,
only one person in the data has children, and this person
happens to perform badly, a machine learning model might
simply learn that having children is a good predictor of bad
performance. If we then predict how well another student
with children will do, the model will likely predict them to
be at risk. Again, the fairness concerns are obvious. This
problem of underrepresentation may particularly occur
when demographic features are categorical and of high
cardinality, as fewer samples are available per categorical
value. In this case, it is likely that some groups are poorly
represented, and therefore, overfitting occurs, which can lead to
bias.
One often-used strategy to circumvent these fairness issues is to
completely remove obvious demographic features (such as
ethnicity and gender) from the training data. Nonetheless, it is
sometimes possible to still infer demographic information from
other features that do not appear to be demographic features
directly [17]. For example, if the school name is included
in the training data, this might reveal the gender of a
person ("ABC School for Girls"). The best strategy to avoid
unfairness is, therefore, to try to exclude any features that
point towards demographic characteristics and are not
directly study-related when at-risk prediction models are
deployed.
2.3 Causal Mechanisms including Demographic Features
Although it has hardly been done in EDM, it is important to consider how demographic features might causally impact study success theoretically. Understanding these mechanisms will help us to reason when demographic features may matter for the prediction but also again highlights why using demographic features for at-risk prediction is not ideal. Demographic features never directly impact study success but only through causal mechanisms. Drawing on social science literature, we classify those mechanisms into two types: capital-based and discrimination-based.
2.3.1 Capital-Based Mechanisms
Capital is typically divided into economic, social, and cultural capital [11]. Economic capital would, e.g., be money. If a student has little monetary means (low socioeconomic background), they might be forced to work a lot and live far away from campus. Working much and having to commute both means the student has less time to study, leading to less activity and poorer results. Social capital would, e.g., be to know whom to turn to if a student struggles or to have a social support network. Students from a low socioeconomic background or a foreign country might not have access to this knowledge and those connections. Similarly, people with such demographics might not know certain cultural rules (cultural capital) in academia which might also lead to disadvantages [23]. Capital-based mechanisms are diverse and probably exist in different settings, such as online and offline.
2.3.2 Discrimination-Based Mechanisms
Demographic features may also impact study success through
discrimination, e.g., an instructor might consciously or
unconsciously discriminate against students with certain
characteristics. This could either directly impact a student’s
academic achievement or indirectly as the student perceives
the discrimination and reacts by spending less time and
effort on the course [20]. The effect of discrimination-based
mechanisms should vary from setting to setting. For example,
discrimination could be less likely in online settings as teachers
do not receive visual cues regarding students’ demographic
characteristics.
2.3.3 Mediation Effects
Overall, capital-based mechanisms probably exist universally.
However, once someone is in higher education, demographic
characteristics will have already impacted previous performance
(in school and then in previous university courses). This might
mean that as long as we have information on previous
performances, demographic data has no additional effect.
Demographic characteristics might also impact a student’s
activity. Not having time naturally leads to less study
engagement. Furthermore, e.g., people from a lower socioeconomic
background might also be hesitant to participate in class. So,
again, having activity information may – at least partly – make
demographic data redundant. To a degree, these considerations
might also be true for discrimination-based mechanisms;
here, however, the effect of demographic characteristics
should vary between courses and also between different
settings, e.g., between different universities and online and
offline learning. Returning to our discussion on fairness,
it is also obvious that ML models in action should not
predict based on previous discrimination against certain
populations.
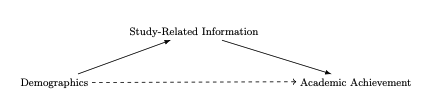
In summary, demographic features are causally related to study
success and may, therefore, be important for predictions.
However, their impact is likely already captured by previous
performance and, potentially, to a degree, previous activity
data, such that the performance gain in using them for
predictions is small too not existent. In other words, other
study-related features mediate the effect of demographic
characteristics. This mechanism can also be seen in Figure
1.
3. EXISTING EVIDENCE
As already mentioned, existing research is divided on whether demographic features are important for predictions or not. In this section, we will look at contributions highlighting the importance, lack thereof, or some middle ground between these stands.
3.1 Demographic Features Are Important
Batool et al. [4] used the widely used Open University Learning Analytics Dataset (OULAD) and two similarly structured datasets and used only the demographic features in the datasets to predict who will fail the courses. They report high F1-scores using Random Forests but do not compare against baselines to validate the meaningfulness of their results. Daud et al. [7] predict whether a student will finish their degree based on socio-demographic features using a dataset from several universities in Pakistan. They considered many features not typically available and potentially extremely problematic such as e.g., family expenditures. Daud et al. report high F1-scores, with their best method generally being the Support Vector Machine followed by Naive Bayes, but do not compare this against predictions using previous performance data. Hoffait et al. [12] predict which students are at-risk at the time of registration for their degree using a dataset from Belgium. Due to their setting, they only have some previous performance data from school and no activity information, but most of their data is demographic. Yet, they achieve relatively high F1-scores. Their Random Forest model slightly outperforms other models, such as Logistic regression or a Neural Network.
3.2 Demographic Features Are Not Important
Tomasevic et al. [31] also used the OULAD to predict performance and compared several Machine Learning models with different sets (demographic, performance, activity) of features against each other in a very thorough study. Usually, the prediction accuracy did not vary much when using or not using demographic features as long as the other sets of study-related features were used, leading them to conclude that these features were not important, although using demographic features usually slightly improved the model. At least for this dataset, this is very strong evidence that demographic features do not significantly add to the prediction accuracy. It should be noted that they apparently did not use all demographic features available. Their best-performing model was the Neural Network. Al-Zawqari and Vandersteen [1] use a subset of the OULAD dataset to distinguish between high-performing and failing students. They compared F1-scores using and not using demographic data along with activity data and found that using demographic data did not improve results much. It should be noted that it is unclear how they selected and handled their data. Random Forests and Neural Networks performed almost equally well. Jha et al. [14] used the same dataset to predict failure using a variety of methods and different feature subsets. In accordance with the other papers, they found that activity data was the most predictive feature set. When they used activity data, it did not matter what other features were included regarding the model’s performance. Trstenjak and Donko [32] used data from the Information System of Higher Education Institutions databases, predicted success using Support Vector Machines and Naive Bayes, and ranked feature importance using several metrics such as information gain and gain ratio. They showed that most (but not all) demographic features had very little impact and experimented with leaving some (the least important ones) of them out, which even led to slightly increased accuracy. Support Vector Machines outperformed Naive Bayes. Miguéis et al. [19] predicted the overall study success of students of a technical university and then looked at the Gini-index of features. They found that performance data was more important than demographic data, with AdaBoost being their most accurate model.
3.3 Demographic Features Are Somewhat Important
Khasanah et al. [15] predicted overall study success with data from Indonesia using Decision Trees and Bayesian Networks, with Bayesian Networks being more accurate. They used Information Gain to evaluate demographic feature importance and found that some were important, but others were not. It should be noted that the data they had available on previous performance and activity was rather limited. Sweeney et al. [30] looked at the feature importance of one large dataset as they tried to predict study success using a Factorization Machine for the courses a student enrolled in the next term. They found that demographic data were more important in the beginning when little past performance data was available than later on. They had relatively few demographic features in their dataset, however. Zhao et al. [35] use admissions data to predict who will perform well in a specific Master’s program based on admission data. Due to the nature of their setting – that they try to learn who should be admitted to the program – their performance data is restricted to data on high school and Bachelor results, and they have no activity data. Though they make no difference between demographic and non-demographic features, their most important predictors show that some demographic features (gender, nationality) tend to be important while others are not. Random Forest or ensemble methods tend to be the best-performing models. Cortez and Silva [6] predicted grades of Portuguese middle school students in math and Portuguese. They found that the relative importance of previous performance scores was higher, but socio-demographic features still mattered. They provide a detailed list of their preprocessing, typically including binning or ordinal recoding. Random Forests tended to perform best.
3.4 Overall Evidence
Overall, for the case of OULAD, despite Batool et al.’s results [4], the evidence appears to be pretty clear that accuracy does not increase when using demographic data along with performance or activity data [31, 14]. In general, studies that included study-related features typically found demographic features to be less important. However, in other settings where fewer performance data is available, results suggest that demographic data does play a role. Those that explicitly investigated feature importance typically reported that it is somewhat important. Furthermore, note that only very few studies explicitly reported on feature engineering of demographic characteristics. Yet, feature engineering is often non-trivial for demographic data as it often consists of (high-cardinality) categorical data.
4. RESEARCH OBJECTIVE AND QUESTIONS
Both our review of existing evidence and our theoretical considerations lead us to the hypothesis that using demographic features will not increase model performance as long as we have study-related features from previous performance or activity but that they will have predictive power if we do not have study-related features.
To test our hypothesis, we formulate the following main research questions:
- RQ1: Are demographic characteristics useful in explaining at least some of the differences in student performance; in other words, are models using only demographic features better than guessing?
- RQ2: Are demographic characteristics still useful if study-related information is available; in other words, do models trained on study-related and demographic features perform better than models trained only on study-related features?
- RQ3: Which features should ultimately be used in EDM predictions; in other words, models trained on which feature subsets outperform models trained on other subsets?
- RQ4: If RQ2 is answered with no, do models trained on the whole data learn that demographic information is irrelevant; in other words, do models trained on the whole data place close to zero importance on the demographic features?
Furthermore, we are interested in the following research questions:
- RQ5: How complex is the relationship between predictive features and student performance; in other words, how large are the differences in performance between linear and nonlinear models?
- RQ6: How relevant is the treatment of categorical features; in other words, do different encoding methods affect performance?
5. EXPERIMENTAL DESIGN
In this section, we describe our experimental setup to evaluate the formulated research questions. We proceed by first describing the used datasets and model classes used for prediction. Afterward, the hyperparameter tuning procedure, methods to treat categorical data, and the evaluation setup are described.
5.1 Datasets
We use four publicly available EDM datasets. Two datasets are from online learning systems and two from in-class education, of which one is from secondary education in high schools and one from tertiary university education. In this subsection, we briefly describe the used datasets and the corresponding preprocessing. Furthermore, we describe the assignment of features to the feature types (demographic, performance-related, activity-related, and others) discussed in Subsection 2.1. We will use the resulting feature subsets in Section 6 to train models for answering the research questions. An overview of the datasets can be seen in Table 1.
| Engineering [8] | PortSecStud [6] | xAPI-Edu [3] | OULAD [16] | |
|---|---|---|---|---|
| No. of samples | 12411 | 1044 | 480 | 22437 |
| No. of features | 33 | 34 | 17 | 51 |
| Performance features | 5 | 3 | 0 | 4 |
| Demographic features | 25 | 17 | 4 | 6 |
| Activity features | 0 | 6 | 5 | 40 |
| Other features | 2 | 7 | 7 | 0 |
| Categorical features | 13 | 4 | 7 | 4 |
| Total cardinality | 3980 | 17 | 59 | 31 |
| % NA | 0.0 | 0 | 0.0 | 0.48 |
| Target \(\textbf {y} \in \) | [1..166] | [1..19] | [1..3] | {1,2} |
5.1.1 Dataset of Academic Performance Evolution for Engineering Students
The dataset of academic performance evolution for engineering students [8] consists of the academic, social, and economic information of \(12,411\) Columbian engineering students. Student performance was assessed at two points in time: in the final year of high school and in the final year of pursuing a professional career in Engineering. We refer to this dataset as Engineering. The first assessment evaluates five generic academic competencies: mathematics, critical reading, citizen competencies, biology, and English. The second assessment evaluates critical reading, quantitative reasoning, citizen competencies, written communication, English, and the formulation of engineering projects. As the target for predictions, we use the global score of the second performance assessment and treat the task as a regression task. The five dimensions of the first assessment are used as performance information. There is no information about student activity in the dataset. Demographic features include gender, parental education and occupation, geographic information, school information, and whether different items, such as a car or computer, were available in the family. Other available information is the university and the academic program a student attends. The identifier features, as well as all dimensions and variants of the performance assessment besides the global score, are excluded. Further dataset-specific preprocessing is not necessary. Thirteen categorical features are in the dataset, of which two are of very high cardinality. There are students from 3,735 schools and 134 universities.
5.1.2 Dataset of Portuguese Secondary School Student Performance
The dataset [6] consists of students from secondary education in two Portuguese schools and can be used to predict student achievement in math and Portuguese language courses. We refer to this dataset as PortSecStud The target is the final course grade, which is measured on a discrete scale between 0 and 20. Some authors categorize the grade into pass and fail for binary classification or into five levels for classification. However, we consider it a regression problem, as it better represents the nature of the problem. As performance information, the first and second-period grade is available, as well as the number of past class failures. Activity information consists of the weekly study time, absences, and whether the student participated in extracurricular activities. The demographic information includes gender, age, and address, as well as school and family-related information. Furthermore, we considered travel time from home to school, educational support from family, extra paid classes within the course subject, and having internet access as demographic features since they are highly influenced by socioeconomic factors. Other features are lifestyle-related ones such as alcohol consumption, health status, or whether the student is engaged in a romantic relationship. The datasets for the math and Portuguese courses are combined and a feature indicating the course is added. Further dataset-specific preprocessing is not necessary.
5.1.3 xAPI-Edu-Data
The Students’ Academic Performance Dataset (xAPI-Edu-Data) [3] consists of 480 students, where most are from Kuwait (179) and Jordan (172). The target is students’ performance in %, which is only available in groups: 0-69, 70-89, and 90-100. Hence, we treat the task as a multi-class classification problem. There is no information about previous student performance in the dataset. Student activity is measured according to four behavioral aspects during interactions with the e-learning system: participation in discussion groups, visiting resources, raising a hand in class, and viewing announcements. In addition, absence days are available. Demographical features are nationality, gender, place of birth, and the parent responsible for the student. Other information includes the academic background (e.g., course, semester, grade level), and the parents’ participation (answering a survey, school satisfaction). No dataset-specific preprocessing is required. The categorical features with the most expressions are nationality, with 14 possible nationalities, and field of study, with 12 possible subjects.
5.1.4 OULAD
The OULAD dataset is a large dataset with diverse opportunities for educational data mining [16]. It is a relational database of five tables with information on students, assessments, courses, registrations, online learning materials, and students’ interactions with those. We focus on the same prediction task with the same dataset, features, and preprocessing as Jha et al. (2019) [14]. For predictions, we consider all students who did not drop out before the course ended to predict whether they failed or passed. As information about the previous performance, we use the average scores achieved in previous assignments. Jha et al. (2019) [14] conducted analyses on different data subsets as well; however, they counted the so-far achieved credits and the number of previous attempts as demographic features. This does not match our definition of demographic features. Hence we define those features as performance-related. Student activity is obtained as two types of interaction with 20 different content types resulting in 40 features. The types of interaction are the sum of the clicks and the number of visits for each type of content. Examples of content types are homepage, subpage, quiz, wiki, and other platform-related types. As demographic features, we use gender, region, imd_band, age_band, and disability. There are no other features in the dataset. The performance and activity features are extracted from the database as described by Jha et al. (2019) [14]. Similarly, the id_student, code_module, module_presentation, and exam_score features were excluded as well as all students who had withdrawn before the course ended. Some mean assessment scores and imd_band categories are missing. As the information on how missing values are treated is not given in [14], we impute the mean value for the mean assessment scores and define a new category for missing imd_band values.
| Demographic Features | Study-Related Features | Other Features | |
|---|---|---|---|
| Engineering [8] | gender, parental, geographic, and school information, item availability in family | first assessment on five dimensions (MAT, CR, CC, BIO, ENG) | university, academic program |
| PortSecStud [6] | gender, age, address, family and school related information, paid classes, internet access | first and second period grade, past failures, absences, study time, extracurricular activities | lifestyle related features, e.g. alcohol consumption, romantic relationships, amount of free time |
| xAPI-Edu [3] | gender, nationality, place of birth, parent responsible | interaction with the e-learning system, absences | general academic information (e.g. semester), parental participation |
| OULAD [16] | Gender, region, imd_band, age_band, disability, highest_education | num_of_prev_attempts, avg_cma, avg_tma, studied_credits, sum of clicks and count of visits for each of the 20 VLE activity types | - |
5.2 Models
We include two model classes, namely generalized linear models (GLMs) and XGBoost, in our evaluation. For regression tasks, we use Lasso regression for the regularization of the models to prevent overfitting. For classification tasks, we use logistic regression with the L2-penalty. In the case of multi-class classification, multinomial loss is used. GLMs have the benefit of being highly interpretable and, thus, are ideally suited for (educational) data mining. However, they make the strong assumption that the relationship of the target to the features is linear. In contrast, XGBoost is a highly flexible model capable of learning more complex relationships. For the OULAD dataset, XGBoost has been shown to outperform competitive approaches by Jha et al. (2019) [14]. Furthermore, for tabular datasets, XGBoost has shown superior performance compared to other methods like neural networks far beyond the field of educational data mining [26, 10]. Thus, it can be considered the state-of-the-art model for maximizing performance on a variety of datasets such that we do not include further models. By comparing the predictive performance of GLMs and XGBoost, we are able to answer research question RQ5. In addition, baseline models for each dataset are included, which predict the target mean of the training data for regression tasks and the mode for classification tasks. By comparing models trained solely on demographic data to these baselines, we are able to answer research question RQ1.
5.3 Hyperparameter Optimization
We implement a hyperparameter optimization (HPO) pipeline with 5-fold cross-validation (5CV) for XGB and GLMs. For parameter tuning, we use Bayesian optimization implemented in the hyperopt library [5]. To select the best parameters, the training data is split into five folds again. In each HPO step, a model with the current hyperparameters is trained on each fold. The objective function of each step is the average performance on the held-out datasets of each fold. Our modeling pipeline is depicted in Figure 2. Performance is measured as the mean squared error (MSE) for regression tasks and log-loss for classification tasks. For the GLMs, we only tune the regularization strength parameter \(\alpha \). The search space for Lasso regression is defined as \(\alpha \in [10^{-10}, 0.5]\). The search space for Logistic regression is defined as \(\alpha \in [10^{-10}, 1.0]\). We run 50 iterations of Bayesian optimization for each model. For hyperparameter optimization of XGBoost, we implement an algorithm to iteratively tune different subsets of XGBoost hyperparameters using Bayesian optimization in four steps. (1) Tune the number of estimators \(\in [50..500]\) and the learning rate \(\in [0.001,0.5]\). (2) Tune the maximum tree depth \(\in [1..18]\) and minimum child weight \(\in [0..10]\). (3) Tune both the number of columns and samples used in each tree \(\in [0.5,1]\). (4) Tune the regularization parameters \(\alpha \in [0..10]\), \(\lambda \in [1,4]\) and \(\gamma \in [10^{-8},9]\). In each step, 50 iterations of Bayesian optimization are performed. To speed up the computations and terminate the training for optimization iterations with poor parameter choices more quickly, we use early stopping on the validation data if there is no improvement after ten training iterations. Overfitting on the validation data is mitigated through the 5CV procedure as a configuration needs to perform well on all five validation sets.
5.4 Methods for Categorical Data Treatment
All of the used datasets include categorical data. As the treatment of categorical data can affect predictive performance in data mining tasks [22], we want to evaluate whether our models are affected by different encoding methods. Hence, to answer research question RQ6, we evaluate if and how much different encodings of categorical features impact the prediction. Each categorical feature with three or more unique values is considered. Ordinal features are treated as categorical as well. One-Hot-Encoding (OHE) is included as it is the most frequently used method to handle categorical data. Categories in the test data which did not appear in the train data are ignored such that the encoding vector consists solely of 0s. As sometimes categorical features can be of high cardinality, OHE can suffer from overparameterization and unnecessary sparsity, leading to increased training times and memory requirements. Therefore, we include ordinal encoding as it can be a simple and more compact encoding and is frequently used for XGBoost. However, for linear models, ordinal encoding is not appropriate as there is no natural order between the categories. Unknown values are encoded in a new category. A generally applicable method is target encoding and its variants [18]. In target encoding for regression, each categorical value is encoded as the target mean of the training samples belonging to this value. For classification, the posterior probability of the target given the categorical value is used. As this approach is sensitive to overfitting, the encoding is further blended with the global mean value for regression and the prior target probability for classification. In the case of multi-class classification, we use a one vs. rest approach to obtain an encoding for each class. For unknown categories in the test data, the global mean or prior probability is used. In addition, the Catboost encoder is included as it was specially designed for improving categorical data handling in gradient boosting [24]. The method is similar to target encoding but considers the frequency counts of expressions of a categorical feature in a more principled way. For high-cardinality features, regularized target encoding was shown to be the superior method for a variety of datasets in a large benchmark study [22]. Therefore, we also include 5CV-GLMM, the best-performing method from that study, in our evaluation. The method first fits a simple generalized linear mixed model (GLMM) for each categorical feature and uses the estimated random effects coefficients of the model as encodings. To prevent overfitting, this procedure is combined with 5-fold cross-validation (5CV). The train data is separated into five parts, and five GLMMs are fitted to 80% of the data, and the estimated random effects of the model are used as encodings for the remaining data. The test data is encoded using a model trained on the whole train data. We implement 5CV-GLMM encoding using the gpboost library [27, 28] as it provides a very efficient implementation of GLMMs.
5.5 Predictive Performance Evaluation
For regression tasks, the target is normalized to zero mean and unit variance for training the models, and the predictions are denormalized afterward to interpret the performance on the original scale. All continuous features were normalized to zero mean and unit variance as well to be able to interpret GLM coefficients as feature importance. For each configuration, we use 5-fold cross-validation (5CV) for evaluation. As an evaluation metric, we use root mean squared error (RMSE) for regression (lower is better) and F1-score with macro averaging for classification (higher is better).

5.6 Methods for Determining the Impact of Demographic Features in Models
As we investigate the importance of demographic data in EDM predictions, performance is not the only relevant metric. It is equally important to analyze the extent to which the models use demographic data. Hence, to answer our research question RQ4, we analyze the feature importance of trained models with a focus on demographic data. We analyze the learned coefficients of the linear models as well as the feature importance of the XGBoost models. As we normalized the data, the coefficients of linear models can directly be interpreted as feature importance scores. For the linear models, we first normalize the absolute coefficient values to sum to one. Afterward, we sum the normalized coefficients for the demographic features to obtain an assessment of the extent to which the models use demographic data for predictions. For XGBoost the feature importances reflect how often certain features are used and how useful they are for the prediction in a single decision tree. Precisely, the importance of a single tree is calculated as the amount that each split improves the performance measure, weighted by the number of samples the node is responsible for. Afterward, the feature importances are averaged across all of the decision trees and normalized to sum to one. In addition, we analyze the extent to which the utilization of demographic data affects the actual predictions on linear models; this is considered important information in the fairness literature [17]. Given a dataset with \(n\) samples and \(d\) features in a matrix \(\textbf {X} \in \mathbb {R}^{n \times d}\) and a target \(\textbf {y} \in \mathbb {R}^{n}\), we apply the following procedure:
- Train a linear model to predict the target
- Obtain predictions as \(\hat {\textbf {y}} = \sigma (\textbf {X}\boldsymbol {\beta })\), where \(\boldsymbol {\beta }\) is the coefficient vector of the linear model and \(\sigma \) is the inverse link function depending on the target, e.g., linear for continuous and sigmoid for binary targets
- Remove the k demographic features from \(\textbf {X}\) and the respective coefficients \(\boldsymbol {\beta }\) and obtain predictions \(\tilde {\textbf {y}} = \sigma (\textbf {X}_{:,d-k}\boldsymbol {\beta }_{d-k})\)
-
Compute score for the impact of demographic features as
- \(\frac {1}{n} \sum _i^n \hat {y}_i - \tilde {y}_i\) for regression
- \(\frac {1}{n} \sum _i^n\) {1 if \(\hat {y}_i \neq \tilde {y}_i\), 0 otherwise } for classification
For regression, this corresponds to evaluating the mean absolute difference of predictions with and without demographic features. For classification, this corresponds to evaluating the percentage of samples for which not using the demographic features changes the class assignment.
6. RESULTS
In this section, we report and discuss our results to evaluate the stated research questions. We start with analyzing the effect of the categorical data treatment method. Afterward, we proceed with a comparison of models trained on different data subsets with a focus on demographic data. Finally, we evaluate the feature importance of the final models to assess whether demographic data is used.
6.1 Impact of Categorical Data Treatment Method
| Dataset | Baseline | Ignore | OHE | Target | Ordinal | Catboost | 5CV-GLMM | |
|---|---|---|---|---|---|---|---|---|
| Engineering | GLM | 23.11 (0.26) | 14.36 (0.26) | 14.11 (0.29) | 14.55 (0.23) | 14.36 (0.25) | 14.22 (0.29) | 14.13 (0.29) |
| XGB | 23.11 (0.26) | 14.28 (0.25) | 14.11 (0.26) | 14.38 (0.23) | 14.15 (0.25) | 14.17 (0.28) | 14.04 (0.28) | |
| PortSecStud | GLM | 3.86 (0.17) | 1.55 (0.1) | 1.55 (0.1) | 1.55 (0.1) | 1.55 (0.1) | 1.55 (0.1) | 1.55 (0.1) |
| XGB | 3.86 (0.17) | 1.51 (0.12) | 1.51 (0.08) | 1.46 (0.06) | 1.52 (0.06) | 1.57 (0.08) | 1.5 (0.06) | |
| xAPI-Edu | GLM | 0.2 (0.02) | 0.75 (0.06) | 0.76 (0.03) | 0.75 (0.06) | 0.73 (0.05) | 0.73 (0.09) | 0.75 (0.06) |
| XGB | 0.2 (0.02) | 0.76 (0.05) | 0.78 (0.04) | 0.78 (0.06) | 0.78 (0.08) | 0.72 (0.07) | 0.76 (0.02) | |
| OULAD | GLM | 0.81 (0.0) | 0.87 (0.01) | 0.87 (0.01) | 0.87 (0.01) | 0.87 (0.01) | 0.87 (0.01) | 0.87 (0.01) |
| XGB | 0.81 (0.0) | 0.91 (0.0) | 0.91 (0.0) | 0.91 (0.0) | 0.91 (0.0) | 0.91 (0.0) | 0.91 (0.0) |
Table 3 shows the results for the different datasets and categorical data treatment methods. In general, it appears that the treatment method does not matter. According to a t-test over the folds, for three datasets, ignoring the categorical features works just as well as using the categorical data, regardless of the encoding method. For the Engineering dataset, the target scale is rather large, such that performance differences on the digits after the decimal point do not matter. Hence, for this dataset, too, we can consider the encoding method irrelevant. As most of the categorical features are demographic features, this indicates a low importance of demographic characteristics. Finally, our conclusion to RQ6 is that the treatment of categorical features does not affect performance. Hence, we use 5CV-GLMM encoding for GLMs and ordinal encoding for XGBoost in the following experiments.
6.2 Performance Comparison of Different Feature Subsets
| Dataset | Baseline | Demo only | Study only | Demo + Study | All | |
|---|---|---|---|---|---|---|
| Engineering | GLM | 23.11 (0.26) | 20.53 (0.3) | 14.47 (0.22) | 14.35 (0.25) | 14.14 (0.29) |
| XGB | 23.11 (0.26) | 20.43 (0.34) | 14.39 (0.2) | 14.28 (0.23) | 14.05 (0.29) | |
| PortSecStud | GLM | 3.86 (0.17) | 3.76 (0.11) | 1.57 (0.1) | 1.58 (0.1) | 1.56 (0.1) |
| XGB | 3.86 (0.17) | 3.83 (0.15) | 1.49 (0.09) | 1.54 (0.14) | 1.54 (0.05) | |
| xAPI-Edu | GLM | 0.2 (0.02) | 0.39 (0.04) | 0.74 (0.03) | 0.74 (0.05) | 0.74 (0.06) |
| XGB | 0.2 (0.02) | 0.54 (0.03) | 0.74 (0.03) | 0.75 (0.05) | 0.78 (0.05) | |
| OULAD | GLM | 0.81 (0.0) | 0.81 (0.0) | 0.87 (0.01) | 0.87 (0.01) | 0.87 (0.01) |
| XGB | 0.81 (0.0) | 0.81 (0.0) | 0.91 (0.0) | 0.91 (0.0) | 0.91 (0.0) |
Table 4 shows the results for different data subsets as defined in section 5.1.
6.2.1 Predictive Capability of Demographic Features
For OULAD, no difference can be seen between the baseline and using solely demographic features for prediction. Hence, predicting that every student passes the course works equally well as training a model solely using demographic features. For the PortSecStud dataset, the improvement over the baseline is small, such that the usefulness of the demographic features can be considered small also for this dataset. For the Engineering dataset, there is a considerable improvement over the baseline, and for the xAPI-Edu-Data, the improvement over the baseline is the largest. Hence, for these two datasets, it can be said that there is an impact of the demographic features on the performance. Considering RQ1, we conclude that demographic characteristics can be used to explain differences in student achievement. However, this does not hold in every setting and for every type of demographic characteristic.
6.2.2 Mediation Capability of Study-Related Features
For all datasets, using only study-related features achieves far better performance than using only demographic features. Using only study-related features achieves approximately the same performance as additionally considering demographic features in almost every setting. Only for XGBoost on the xAPI-Edu-Data, there is a noteworthy mean difference; however, given the large standard deviations, it cannot be said that it is meaningful in practice. These results confirm the hypothesis that study-related information mediates the effect of demographic characteristics on student achievement. As soon as meaningful information about the student’s activity and/or previous performance is available, the demographic features are not required anymore for accurate predictions. Hence, considering RQ2, demographic characteristics are generally not useful anymore if study-related information is available.
6.2.3 Feature Subsets Achieving the Best Performance
It can be seen that for all datasets, using the whole data is always among the best subsets, as can be expected. Furthermore, according to the t-test for the OULAD dataset, using only study-related information performs equally well as using the whole available information for both GLMs and XGB. The same holds for XGB on the PortSecStud dataset and GLMs on the xAPI-Edu-Data. Given the range of the target values of the Engineering and the PortSecStud datasets, the performance differences are not meaningful in practice, despite the significant differences in the t-test. We conclude that using only study-related features suffices as well for this dataset. For XGBoost on the xAPI-Edu-Data, using all features performs significantly better than solely using study-related features. However, this is rather due to the other features included in the dataset than due to the demographic features, as the performance increase in using demographic data in addition to study-related data is insignificant. Hence, also for this dataset, it would be suitable not to use demographic features without significant loss of performance. In summary, models using all except the demographic features do not perform significantly worse than models additionally considering demographic features. Given the sensitive nature of demographic features, we conclude RQ3 with the recommendation to use only study-related and other than demographic features for predicting student success. If sufficient study-related information is not available but predictive performance matters, demographic features may still be helpful.
6.2.4 Comparison between GLMs and XGBoost
For the regression datasets, the difference between GLMs and XGBoost is small for all models, such that we would prefer GLMs as the simpler solution. For the xAPI-Edu-Data [3], XGBoost is superior for models trained on the whole data on average. However, this has to be viewed with care as the standard deviation between folds is large. Furthermore, GLMs perform equally well as XGBoost when using only the study-related data. Hence, using GLMs solely on performance and activity data could be an alternative for this dataset. For the OULAD dataset, there is a clear performance benefit in using nonlinear methods. As the dataset is large, the results are more robust, with a small standard deviation between folds. Hence, we can say that for this dataset, using XGBoost solely on activity and performance data would be the preferred solution. Considering RQ5, there is evidence that for some educational data mining datasets, using linear models for at-risk prediction suffices. However, when larger datasets with thousands of students are available, nonlinear methods can perform better. These datasets can especially be collected in online settings similar to the OULAD datasets. However, for small in-class datasets, linear models should be the first choice.
6.3 Feature Importance of Demographic Data
| Dataset | Demo only | Demo + Study | All | |
|---|---|---|---|---|
| Engineering | GLM | 1.0 (0.0) | 0.25 (0.03) | 0.23 (0.02) |
| XGB | 1.0 (0.0) | 0.23 (0.06) | 0.19 (0.09) | |
| PortSecStud | GLM | 1.0 (0.0) | 0.08 (0.04) | 0.03 (0.02) |
| XGB | 1.0 (0.0) | 0.26 (0.04) | 0.16 (0.04) | |
| xAPI-Edu | GLM | 1.0 (0.0) | 0.32 (0.14) | 0.23 (0.1) |
| XGB | 1.0 (0.0) | 0.26 (0.03) | 0.21 (0.02) | |
| OULAD | GLM | 1.0 (0.0) | 0.13 (0.0) | 0.13 (0.0) |
| XGB | 1.0 (0.0) | 0.08 (0.0) | 0.08 (0.01) |
| Dataset | Effect of demographics |
|---|---|
| Engineering | 0.97 (0.07) |
| PortSecStud | 0.28 (0.06) |
| xAPI-Edu | 0.11 (0.05) |
| OULAD | 0.33 (0.01) |
The previous subsections have provided clear evidence that demographic features are not necessary for at-risk predictions when sufficient information about students’ study activities or previous performance is available. However, our theoretical considerations indicate that demographic features might correlate with other study-related features. Thus, it is possible that models use these demographic features when they are included in the training data. To further inspect whether the tuned models learn that demographic features are not necessary for high predictive performance, we analyze the learned coefficients of the linear models as well as the feature importances of the XGBoost models as described in Subsection 5.6. Surprisingly, Table 5 shows that despite the fact that an equally good model could have been learned for all models without demographic features, those are still used for all models and datasets. Even for the PortSecStud dataset and the OULAD dataset, where we previously found that demographic features do not help at all compared to the naive baseline, the features are still used. For the XGBoost model trained on study-related and demographic data of the PortSecStud dataset, the demographic information even accounts for 26% of the feature importance despite not being necessary to achieve the performance. Furthermore, Table 6 shows that in every case, the utilization of demographic data directly affects the predictions of the models. For regression, the effect is not large considering the scales of the targets. Nevertheless, it might lead to biases for some students. For classification, the impact of demographic features on actual predictions is large. In general, if practitioners would be to use these models and look for an explanation for predictions, demographic features would be included, although this is not necessary.
One might think that the unnecessary use of demographic features is related to our extensive hyperparameter optimization, which chose a hyperparameter configuration that considered all features, although it is not significantly better than another model with fewer features could be. However, we found that using the default configurations for sklearn linear models and XGBoost, either reproduces the same patterns or is not applicable due to bad performance. Hence, some kind of parameter selection or tuning is necessary. Generally, the models could be prevented from using all features by adjusting the regularization parameters accordingly. However, automatic parameter tuning does not guarantee finding this solution, as different parameterizations might achieve equal performance. In any case, our answer to RQ4 is that just throwing in all features leads to models which use information from demographic features, although this is not necessary. That, combined with the previous results of this section, leads us to the general recommendation to consider completely leaving demographic features out for at-risk predictions whenever sufficient activity and/or previous performance information is available.
7. DISCUSSION
Our evaluation shows that using demographic features does not lead to better model performance as long as we include study-related features. Considering the fairness and privacy concerns, it is, thus, strongly advisable for both researchers and practitioners not to use these features for at-risk prediction.
7.1 The Importance of Demographic Features
Of course, this does not mean that we should never explore the
impact of demographic features on academic achievement
or that demographic features are not important. On the
contrary, it is very important to investigate how demographic
characteristics impact academic achievement so that we can
intercept mechanisms that would lead to disadvantages of
certain populations [21]. For example: If we notice that people
from a lower socioeconomic background tend to a) live further
away from campus and b) have to work a lot and that both of
these influence the time they have for studying, which in turn
influences their academic achievement, then we can come up
with solutions for this on several levels. For example, the study
management and academic staff might be able to come
up with an adjusted study program and timetable. The
university might provide cheap student housing close to the
university; the state might provide funding for disadvantaged
students.
Hence, we certainly do not want to discourage research on
causal mechanisms of demographic characteristics on academic
achievement. Rather, we want to highlight the importance of
thinking about demographic features. Looking at the fairness
literature, two aspects need to be highlighted. First, it might
still be helpful to have demographic features available. This
allows us to estimate a model’s Demographic Parity Ratio
or other common metrics in evaluating the fairness of a
model’s prediction [17]. Second, our theoretical model in 1
indicates that there might be proxy features that transport
information about demographic features even if we do not
include demographic features. It could, therefore, also be argued
that demographic biases in these proxy features should be
mitigated to receive a truly fair model [17]. Then, we would also
need the demographic features to perform a form of bias
mitigation.
7.2 Drawbacks of Feature Selection and Feature Attribution Methods
Most common feature selection or feature attribution techniques rely on the correlation between features and the target in one way or another. As we have discussed at length by now, demographic features are, in general, correlated with the target. This means that employing feature selection methods that rely on correlation will most likely lead to the inclusion of at least some of these features. Likewise, models are likely to place importance on demographic features as there are several equally good parameterizations leading to feature attribution methods recognizing these features as important. It also explains why some scholars who used such techniques (e.g., Information Gain or relative feature importance) reported that demographic features were at least partially important [15, 6, 35]. However, our analysis shows that it is not enough to simply employ such techniques to assess the usefulness of demographic features. While they are not necessary to achieve the best-performing model, they are still correlated with the target. Therefore, we recommend that researchers consciously think about whether and why they should include demographic features instead of using automatic (correlation-based) techniques for feature selection. Furthermore, in addition to feature attribution techniques, researchers should evaluate whether similar performance can be reached without certain features.
7.3 Implications for Practitioners
This is also one of the major implications of our paper for
practitioners. Educational Data Mining researchers and
practitioners should distinguish between models trained
for deployment, where the goal is to achieve maximum
performance, and models trained for gaining insights about
the factors driving academic success. Depending on the
application, the feature subset, especially whether to include
demographic information, should be determined. Practitioners,
when deploying models, should be very careful when it
comes to including demographic features. They can, as
discussed, not rely on technical solutions but should instead
think critically about including these features. There may
exist cases for which including demographic features is
meaningful, but practitioners should be absolutely certain
that including these features does not introduce biases
producing unfairness. [33] state that sensitive features should be
included for fairness reasons if the prediction accuracy itself is
equal. However, Table 6 shows that using demographic
features changed the prediction for some students; this is an
indication that the models using demographic features
are, indeed, unfair [17]. Therefore, leaving them in would
probably not result in an equally fair model. Again, whether
and how to use demographic features has to be carefully
evaluated.
The other major recommendation for practitioners resulting
from our paper concerns the kind of data useful for at-risk
prediction. Our analysis clearly shows that past performance is
extremely important, while demographic characteristics alone
have little predictive power. In particular, features that mirror
the requirements necessary to perform well in the target are
highly relevant for the prediction. Therefore, practitioners
should ideally use standardized tests that capture the kind of
abilities relevant to the target. This would provide the best
features for at-risk prediction.
7.4 Limitations of Our Study and Future Work
Despite our solid results, it is important to note certain
limitations. We only used four datasets and two types of models
to test our hypotheses. As these datasets are diverse (online,
offline, different countries, different levels of education) as are
the model types (linear, non-linear), we believe that our main
findings are still very reliable. Nonetheless, future work should investigate whether the findings hold when using other datasets
and models.
Additionally, we did not investigate whether the models’ feature
importance may change when using different encoding methods.
This may be the case when the encoding methods learn that
demographic features are not necessary for the prediction.
However, given the correlation between demographic features
and the target, it is unlikely that different encodings lead
to models not contributing importance to demographic
features at all. Still, this should also be investigated in the
future.
Because it is not the major focus of our study, we have not
investigated the relationship between the importance of activity-
and performance-related features. Future research could
investigate what is more important and how the two feature
subsets relate to each other.
8. CONCLUSION
Our analyses show strong evidence that demographic features do not increase a model’s performance on at-risk prediction as long as study-related information is available. Nonetheless, both our theoretic considerations, as well as our empirical evaluations indicate that demographic features correlate both with study-related features and the target. Thus, they are used by the models for the prediction, although this would not be necessary, leading to biases and, as a result, unfairness. Because of these fairness concerns, we advise leaving out demographic features and features pointing towards demographic characteristics. This should also make it possible to share more data between researchers, as it reduces privacy concerns. Nonetheless, our paper also shows that investigating the causal mechanisms of how demographic features impact academic achievement is worthwhile and should be encouraged. Deployments of at-risk prediction models should not include demographic features, though.
9. REFERENCES
- A. Al-Zawqari and G. Vandersteen. Investigating the role of demographics in predicting high achieving students. In International Conference on Artificial Intelligence in Education, pages 440–443. Springer, 2022.
- S. Alturki, I. Hulpu, and H. Stuckenschmidt. Predicting academic outcomes: A survey from 2007 till 2018. Technology, Knowledge and Learning, pages 1–33, 2020.
- E. A. Amrieh, T. Hamtini, and I. Aljarah. Mining educational data to predict student’s academic performance using ensemble methods. International Journal of Database Theory and Application, 9(8):119–136, 2016.
- S. Batool, J. Rashid, M. W. Nisar, J. Kim, T. Mahmood, and A. Hussain. A random forest students’ performance prediction (rfspp) model based on students’ demographic features. In 2021 Mohammad Ali Jinnah University International Conference on Computing (MAJICC), pages 1–4. IEEE, 2021.
- J. Bergstra, B. Komer, C. Eliasmith, D. Yamins, and D. D. Cox. Hyperopt: a python library for model selection and hyperparameter optimization. Computational Science & Discovery, 8(1):014008, 2015.
- P. Cortez and A. M. G. Silva. Using data mining to predict secondary school student performance. 2008.
- A. Daud, N. R. Aljohani, R. A. Abbasi, M. D. Lytras, F. Abbas, and J. S. Alowibdi. Predicting student performance using advanced learning analytics. In Proceedings of the 26th international conference on world wide web companion, pages 415–421, 2017.
- E. Delahoz-Dominguez, R. Zuluaga, and T. Fontalvo-Herrera. Dataset of academic performance evolution for engineering students. Data in brief, 30:105537, 2020.
- G. Fenu, R. Galici, and M. Marras. Experts’ view on challenges and needs for fairness in artificial intelligence for education. In International Conference on Artificial Intelligence in Education, pages 243–255. Springer, 2022.
- L. Grinsztajn, E. Oyallon, and G. Varoquaux. Why do tree-based models still outperform deep learning on tabular data? arXiv preprint arXiv:2207.08815, 2022.
- P. K. Hee and L. Shuhan. Influences of economic capital, cultural capital and social capital on asian high school students’ academic achievement. Journal of Educational and Social Research, 12(3):1–1, 2022.
- A.-S. Hoffait and M. Schyns. Early detection of university students with potential difficulties. Decision Support Systems, 101:1–11, 2017.
- Q. Hu and H. Rangwala. Towards fair educational data mining: A case study on detecting at-risk students. International Educational Data Mining Society, 2020.
- N. I. Jha, I. Ghergulescu, and A.-N. Moldovan. Oulad mooc dropout and result prediction using ensemble, deep learning and regression techniques. In CSEDU (2), pages 154–164, 2019.
- A. U. Khasanah et al. A comparative study to predict student’s performance using educational data mining techniques. In IOP Conference Series: Materials Science and Engineering, volume 215, page 012036. IOP Publishing, 2017.
- J. Kuzilek, M. Hlosta, and Z. Zdrahal. Open university learning analytics dataset. Scientific data, 4(1):1–8, 2017.
- N. Mehrabi, F. Morstatter, N. Saxena, K. Lerman, and A. Galstyan. A survey on bias and fairness in machine learning. ACM Computing Surveys (CSUR), 54(6):1–35, 2021.
- D. Micci-Barreca. A preprocessing scheme for high-cardinality categorical attributes in classification and prediction problems. ACM SIGKDD Explorations Newsletter, 3(1):27–32, 2001.
- V. L. Miguéis, A. Freitas, P. J. Garcia, and A. Silva. Early segmentation of students according to their academic performance: A predictive modelling approach. Decision Support Systems, 115:36–51, 2018.
- E. W. Neblett Jr, C. L. Philip, C. D. Cogburn, and R. M. Sellers. African american adolescents’ discrimination experiences and academic achievement: Racial socialization as a cultural compensatory and protective factor. Journal of Black psychology, 32(2):199–218, 2006.
- L. Paquette, J. Ocumpaugh, Z. Li, A. Andres, and R. Baker. Who’s learning? using demographics in edm research. Journal of Educational Data Mining, 12(3):1–30, 2020.
- F. Pargent, F. Pfisterer, J. Thomas, and B. Bischl. Regularized target encoding outperforms traditional methods in supervised machine learning with high cardinality features. Computational Statistics, pages 1–22, 2022.
- R. Pishghadam and R. Zabihi. Parental education and social and cultural capital in academic achievement. International Journal of English Linguistics, 1(2):50, 2011.
- L. Prokhorenkova, G. Gusev, A. Vorobev, A. V. Dorogush, and A. Gulin. Catboost: unbiased boosting with categorical features. Advances in neural information processing systems, 31, 2018.
- N. J. Salkind. Encyclopedia of research design, volume 1. sage, 2010.
- R. Shwartz-Ziv and A. Armon. Tabular data: Deep learning is not all you need. Information Fusion, 81:84–90, 2022.
- F. Sigrist. Latent gaussian model boosting. arXiv preprint arXiv:2105.08966, 2021.
- F. Sigrist. Gaussian process boosting. Journal of Machine Learning Research, 23(232):1–46, 2022.
- L. Sweeney. k-anonymity: A model for protecting privacy. International journal of uncertainty, fuzziness and knowledge-based systems, 10(05):557–570, 2002.
- M. Sweeney, J. Lester, H. Rangwala, A. Johri, et al. Next-term student performance prediction: A recommender systems approach. Journal of Educational Data Mining, 8(1):22–51, 2016.
- N. Tomasevic, N. Gvozdenovic, and S. Vranes. An overview and comparison of supervised data mining techniques for student exam performance prediction. Computers & education, 143:103676, 2020.
- B. Trstenjak and D. Donko. Determining the impact of demographic features in predicting student success in croatia. In 2014 37th International Convention on Information and Communication Technology, Electronics and Microelectronics (MIPRO), pages 1222–1227. IEEE, 2014.
- R. Yu, H. Lee, and R. F. Kizilcec. Should college dropout prediction models include protected attributes? In Proceedings of the eighth ACM conference on learning@ Scale, pages 91–100, 2021.
- M. Zaffar, M. A. Hashmani, K. Savita, and S. S. H. Rizvi. A study of feature selection algorithms for predicting students academic performance. International Journal of Advanced Computer Science and Applications, 9(5), 2018.
- Y. Zhao, Q. Xu, M. Chen, and G. Weiss. Predicting student performance in a master’s program in data science using admissions data. In Educational Data Mining, 2020.
© 2023 Copyright is held by the author(s). This work is distributed under the Creative Commons Attribution-NonCommercial-NoDerivatives 4.0 International (CC BY-NC-ND 4.0) license.